Publisher’s version / Version de l'éditeur:
BMC Evolutionary Biology, 7, pp. 1-12, 2007-07-03
READ THESE TERMS AND CONDITIONS CAREFULLY BEFORE USING THIS WEBSITE. https://nrc-publications.canada.ca/eng/copyright
Vous avez des questions? Nous pouvons vous aider. Pour communiquer directement avec un auteur, consultez la première page de la revue dans laquelle son article a été publié afin de trouver ses coordonnées. Si vous n’arrivez pas à les repérer, communiquez avec nous à PublicationsArchive-ArchivesPublications@nrc-cnrc.gc.ca.
Questions? Contact the NRC Publications Archive team at
PublicationsArchive-ArchivesPublications@nrc-cnrc.gc.ca. If you wish to email the authors directly, please see the first page of the publication for their contact information.
This publication could be one of several versions: author’s original, accepted manuscript or the publisher’s version. / La version de cette publication peut être l’une des suivantes : la version prépublication de l’auteur, la version acceptée du manuscrit ou la version de l’éditeur.
For the publisher’s version, please access the DOI link below./ Pour consulter la version de l’éditeur, utilisez le lien DOI ci-dessous.
https://doi.org/10.1186/1471-2148-7-107
Access and use of this website and the material on it are subject to the Terms and Conditions set forth at
Comparative sequence analysis of the complete set of 40S ribosomal
proteins in the Senegalese sole (Solea senegalensis Kaup) and Atlantic
halibut (Hippoglossus hippoglossus L.) (Teleostei: Pleuronectiformes):
phylogeny and tissue- and development-specific expression
Manchado, Manuel; Infante, Carlos; Asensio, Esther; Cañavate, Jose Pedro;
Douglas, Susan E.
https://publications-cnrc.canada.ca/fra/droits
L’accès à ce site Web et l’utilisation de son contenu sont assujettis aux conditions présentées dans le site LISEZ CES CONDITIONS ATTENTIVEMENT AVANT D’UTILISER CE SITE WEB.
NRC Publications Record / Notice d'Archives des publications de CNRC:
https://nrc-publications.canada.ca/eng/view/object/?id=56b907f9-c985-4826-8199-575d08c6f9c0 https://publications-cnrc.canada.ca/fra/voir/objet/?id=56b907f9-c985-4826-8199-575d08c6f9c0
Open Access
Research article
Comparative sequence analysis of the complete set of 40S
ribosomal proteins in the Senegalese sole (Solea senegalensis Kaup)
and Atlantic halibut (Hippoglossus hippoglossus L.) (Teleostei:
Pleuronectiformes): phylogeny and tissue- and
development-specific expression
Manuel Manchado*
1, Carlos Infante
1, Esther Asensio
1, Jose Pedro Cañavate
1and Susan E Douglas
2Address: 1IFAPA Centro El Toruño, Junta de Andalucía Camino Tiro de pichón s/n, 11500 El Puerto de Santa María, Cádiz, Spain and 2Institute
for Marine Biosciences, National Research Council, 1411 Oxford Street, Halifax, Nova Scotia, B3H 3Z1, Canada
Email: Manuel Manchado* - manuel.manchado.ext@juntadeandalucia.es; Carlos Infante - carlos.infante.ext@juntadeandalucia.es; Esther Asensio - esther.asensio.ext@juntadeandalucia.es; Jose Pedro Cañavate - josep.canavate@juntadeandalucia.es;
Susan E Douglas - susan.douglas@nrc-cnrc.gc.ca * Corresponding author
Abstract
Background: Ribosomal proteins (RPs) are key components of ribosomes, the cellular organelle
responsible for protein biosynthesis in cells. Their levels can vary as a function of organism growth and development; however, some RPs have been associated with other cellular processes or extraribosomal functions. Their high representation in cDNA libraries has resulted in the increase of RP sequences available from different organisms and their proposal as appropriate molecular markers for phylogenetic analysis.
Results: The development of large-scale genomics of Senegalese sole (Solea senegalensis) and Atlantic
halibut (Hippoglossus hippoglossus), two commercially important flatfish species, has made possible the identification and systematic analysis of the complete set of RP sequences for the small (40S) ribosome subunit. Amino acid sequence comparisons showed a high similarity both between these two flatfish species and with respect to other fish and human. EST analysis revealed the existence of two and four RPS27 genes in Senegalese sole and Atlantic halibut, respectively. Phylogenetic analysis clustered RPS27 in two separate clades with their fish and mammalian counterparts. Steady-state transcript levels for eight RPs (RPS2, RPS3a, RPS15, RPS27-1, RPS27-2, RPS27a, RPS28, and RPS29) in sole were quantitated during larval development and in tissues, using a real-time PCR approach. All eight RPs exhibited different expression patterns in tissues with the lowest levels in brain. On the contrary, RP transcripts increased co-ordinately after first larval feeding reducing progressively during the metamorphic process.
Conclusion: The genomic resources and knowledge developed in this survey will provide new insights
into the evolution of Pleuronectiformes. Expression data will contribute to a better understanding of RP functions in fish, especially the mechanisms that govern growth and development in larvae, with implications in aquaculture.
Published: 3 July 2007
BMC Evolutionary Biology 2007, 7:107 doi:10.1186/1471-2148-7-107
Received: 5 March 2007 Accepted: 3 July 2007
This article is available from: http://www.biomedcentral.com/1471-2148/7/107 © 2007 Manchado et al; licensee BioMed Central Ltd.
This is an Open Access article distributed under the terms of the Creative Commons Attribution License (http://creativecommons.org/licenses/by/2.0), which permits unrestricted use, distribution, and reproduction in any medium, provided the original work is properly cited.
Background
The eukaryotic ribosome is a complex macromolecular structure composed of a large (60S) and a small (40S) subunit. The large ribosomal subunit catalyses peptide bond formation and is responsible for channelling the nascent proteins through their exit tunnel. The small ribosomal subunit binds mRNA and is responsible for the fidelity of translation by ensuring the correct base pairing between aminoacyl-tRNAs and codons of the mRNA in the decoding centre [1]. Biochemically, the eukaryotic ribosome is composed of four ribosomal RNA molecules and over 70 ribosomal proteins (RPs) [2]. In mammals, the 60S and 40S subunits are composed of 47 and 32 RPs, respectively [3]. Each mammalian RP is typically encoded by a single gene except RPS4 in human [4], and RPS27 in rat [5] and human [6], which are encoded by two separate genes. In contrast, in the yeast Saccharomyces cerevisiae, the 78 RPs are encoded by 137 genes, 59 of which are dupli-cated [7]. In fish, the complete set of RPs in Fugu rubripes [8] and Ictalurus punctatus [9] has been described. Of the 32 RPs from the 40S subunit, a duplication of RPS27 in both species and of RPS26 in I. punctatus was observed. In the 47 RPs from the 60S subunit, all of them but one (RPL5 in I. punctatus) appeared to have only one type of mRNA [10].
RPs play a critical role in protein biosynthesis. Cellular levels change as a function of growth rate in bacteria and fungi [11-14]. In fish, mRNA levels increase co-ordinately during embryogenesis and larval development [15-18]. In mammals, certain tumors have substantially increased levels of some RP transcripts [19,20]. However, different RPs have also been associated with various other cellular processes; the so-called extraribosomal functions. For example, in Drosophila, mutations in the RPS2 gene appear to cause arrest of oogenesis [21] and RPS6 func-tions as a tumor suppressor in the hematopoietic system [22]. Mammalian RPS3 appears to possess apurinic/apyri-midinic endonuclease activity involved in DNA repair functions [23]. Haploinsufficiency of the RPS4 genes has been suggested to contribute to anatomic abnormalities associated with the Turner syndrome in humans [4]. The gene encoding RPS19 seems to participate in embryogen-esis due to its capacity to interact with FGF-2, a factor involved in the differentiation process of different cell types [24]. Finally, apoptosis can be induced by inhibiting or activating expression of RPS3a and RPS27L, respec-tively [6,25].
Senegalese sole, Solea senegalensis (Pleuronectiformes: Soleidae), and Atlantic halibut, Hippoglossus hippoglossus (Pleuronectiformes: Pleuronectidae), are two commer-cially important flatfish species. During larval develop-ment, both species change from a symmetrical morphology to an asymmetric, benthic juvenile. This
metamorphic process involves dramatic morphological and physiological changes. In Senegalese sole, metamor-phosis occurs very early during larval development, between 12 and 19 days after hatching (DAH) [26]. In Atlantic halibut, metamorphosis begins with the migra-tion of the left eye about 80 DAH [27]. Apoptotic proc-esses induced by thyroxine hormone have been associated with this tissue remodelling in flatfish [28]. In addition, Senegalese sole larvae exhibit two different growth rates during development [26,29]. Because of the key role RPs play in cellular growth and proliferation and in some cases apoptosis, it is important to elucidate the expression pattern of RPs during flatfish development.
RPs are highly represented in cDNA libraries [9,10]. The development of large-scale genomics on Senegalese sole and Atlantic halibut has made possible an efficient and systematic analysis of RP sequences in both species. In this work, we report the complete set of 32 40S subunit RP cDNAs for both Senegalese sole and Atlantic halibut and describe their main characteristics. Comparative sequence analysis revealed the existence of two and four RPS27 genes in Senegalese sole and Atlantic halibut, respectively. Real-time PCR analysis revealed different RP expression patterns during larval development and in tissues in sole.
Results
Characteristics of the 40S RPs
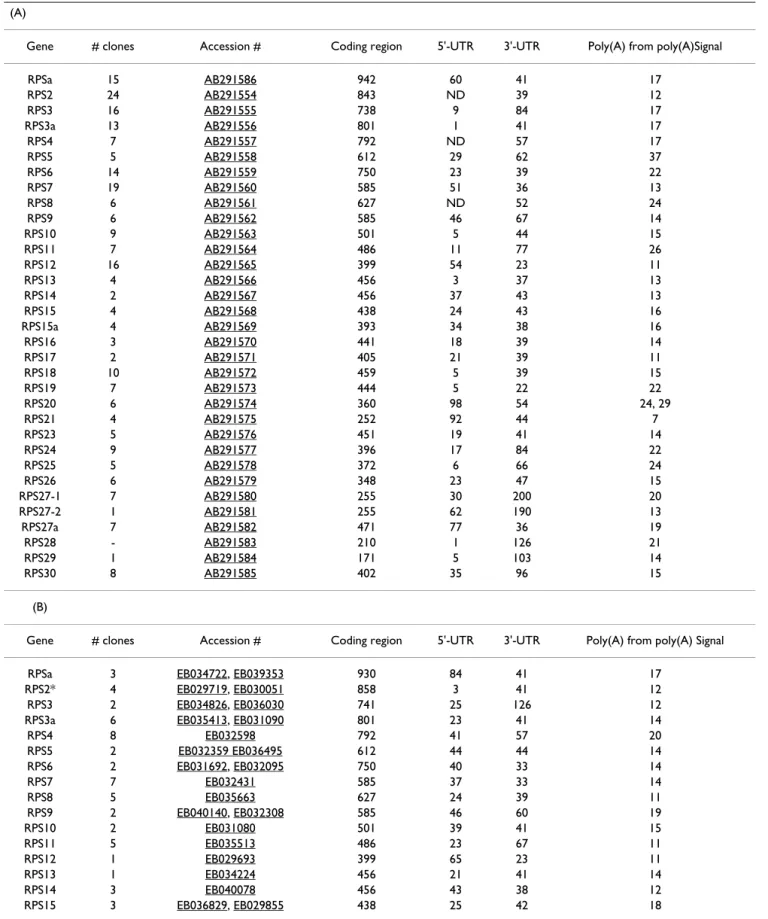
Sequence analysis of normalized libraries for Senegalese sole allowed the identification of 31 out of 32 40S subunit RPs (only RPS28 was absent). RPS28 was obtained from a premetamorphic stage larval library using specific primers (Table 1). Overall, 40S RP genes were not highly repre-sented in the normalized libraries accounting for 252 (2.5%) out of the 10,099 good sequences. The number of clones for each RP ranged between 24 for RPS2 and only 1 for RPS27-2 and RPS29 (Table 2A).
Gene sizes for the complete set of 40S RPs ranged between 279 and 1,043 bp for RPS29 and RPSa, respectively. Only RPS2, RPS4 and RPS8 had partial sequences missing the 5'-ends. All cDNA sequences have been deposited in the GenBank/EMBL/DDBJ with accession numbers from AB291554 to AB291586 (Table 2A). Most RPs (63.6%) used TAA as termination codon. Only RPS8, RPS11, RPS12, RPS15, RPS17, RPS27-1, RPS28, and RPS29 used TAG, and RPS6 and RPS24, TGA. The 3'-UTRs were highly AT-rich. All RPs had a canonical AATAAA polyadenylation signal between 7–37 nucleotides from the poly(A) tail. In halibut, sequences for all except RPS29 and RPS27-2 were identified from the Pleurogene database (Table 2B). In most cases, the complete coding sequences were obtained, but 3'-end sequencing was performed for all RP sequences to confirm the 3'ends, particularly of the long
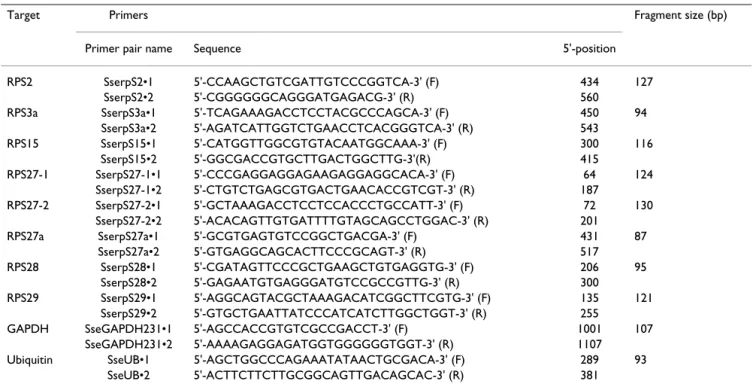
Table 1: Primers used for real-time PCR gene expression analysis. F and R refer to forward and reverse primers, respectively.
Target Primers Fragment size (bp)
Primer pair name Sequence 5'-position
RPS2 SserpS2•1 5'-CCAAGCTGTCGATTGTCCCGGTCA-3' (F) 434 127
SserpS2•2 5'-CGGGGGGCAGGGATGAGACG-3' (R) 560
RPS3a SserpS3a•1 5'-TCAGAAAGACCTCCTACGCCCAGCA-3' (F) 450 94
SserpS3a•2 5'-AGATCATTGGTCTGAACCTCACGGGTCA-3' (R) 543 RPS15 SserpS15•1 5'-CATGGTTGGCGTGTACAATGGCAAA-3' (F) 300 116 SserpS15•2 5'-GGCGACCGTGCTTGACTGGCTTG-3'(R) 415 RPS27-1 SserpS27-1•1 5'-CCCGAGGAGGAGAAGAGGAGGCACA-3' (F) 64 124 SserpS27-1•2 5'-CTGTCTGAGCGTGACTGAACACCGTCGT-3' (R) 187 RPS27-2 SserpS27-2•1 5'-GCTAAAGACCTCCTCCACCCTGCCATT-3' (F) 72 130 SserpS27-2•2 5'-ACACAGTTGTGATTTTGTAGCAGCCTGGAC-3' (R) 201
RPS27a SserpS27a•1 5'-GCGTGAGTGTCCGGCTGACGA-3' (F) 431 87
SserpS27a•2 5'-GTGAGGCAGCACTTCCCGCAGT-3' (R) 517
RPS28 SserpS28•1 5'-CGATAGTTCCCGCTGAAGCTGTGAGGTG-3' (F) 206 95
SserpS28•2 5'-GAGAATGTGAGGGATGTCCGCCGTTG-3' (R) 300
RPS29 SserpS29•1 5'-AGGCAGTACGCTAAAGACATCGGCTTCGTG-3' (F) 135 121
SserpS29•2 5'-GTGCTGAATTATCCCATCATCTTGGCTGGT-3' (R) 255
GAPDH SseGAPDH231•1 5'-AGCCACCGTGTCGCCGACCT-3' (F) 1001 107
SseGAPDH231•2 5'-AAAAGAGGAGATGGTGGGGGGTGGT-3' (R) 1107
Ubiquitin SseUB•1 5'-AGCTGGCCCAGAAATATAACTGCGACA-3' (F) 289 93
SseUB•2 5'-ACTTCTTCTTGCGGCAGTTGACAGCAC-3' (R) 381
ESTs. The RPS29 and RPS27-2 sequences presented in this analysis derive from Atlantic halibut ESTs in GenBank [GenBank:DN792676, GenBank:DN794622]. In addi-tion, only a partial sequence for RPS2 was obtained and the 5'-end was completed by the addition of an Atlantic halibut EST in GenBank [GenBank:CF931586]. 108 ESTs from a total of 12,675 sequences in the database encoded RPs (0.9%), an indication of the excellent normalization in these cDNA libraries.
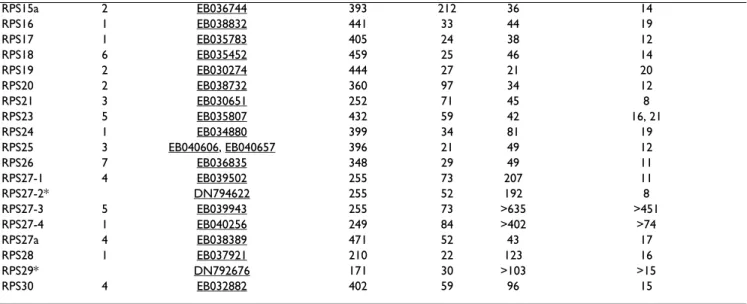
Sizes of coding sequences, 5'- and 3'-UTRs and positions of polyadenylation signals are given in Table 2B. All RPs had a single polyadenylation signal with the exception of RPS20, which had two possible non-canonical sites (AtTAAA and AATgAA), and RPS23, which had two possi-ble canonical sites. The polyadenylation signal for RPS19 overlapped the stop signal and no polyadenylation signal could be identified in RPS27-3. As with Senegalese sole, most 40S subunit RPs used TAA (59%) as a stop codon, followed by TAG (26%) and TGA (15%) and the 3'-UTRs were very AT-rich. Two ESTs comprising RPS14 and RPS27a contigs differed in the lengths of their 5'-UTRs by over 100 nucleotides due to the presence of unspliced introns in this region.
Comparison of the Senegalese sole and Atlantic halibut 40S subunit RPs
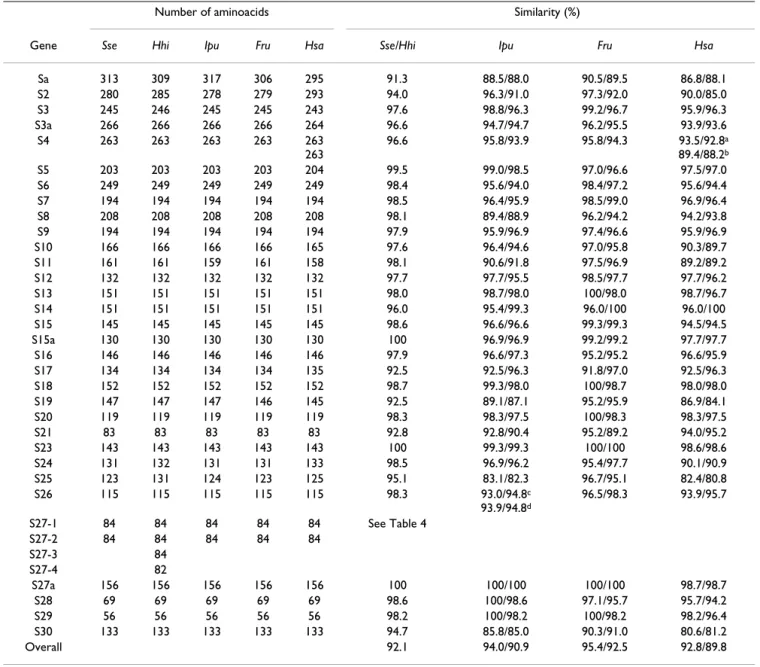
The complete set of 40S RPs in Senegalese sole and Atlan-tic halibut had a high overall similarity (92.1%) as deter-mined by deduced amino acid sequences (Table 3). With
respect to the other species, Senegalese sole overall simi-larities ranged between 92.8 and 95.4% with human and
F. rubripes, respectively. For halibut, these values were 89.8
and 92.5% with human and F. rubripes, respectively. The most conserved 40S RPs in the five species (overall mean >99%) were RPS23 and RPS27a; and the most divergent ones were RPS30 (86.9%), RPS25 (87.9%), and RPSa (89.0%).
The number of amino acids was highly conserved throughout evolution. Of the 32 40S subunit RP cDNAs, 21 had ORFs with identical number of amino acids in the five species compared; RPS3 and RPS24 showed different sizes in Atlantic halibut and human. Four RPs had the same number of amino acids among fish species but dif-ferent from human (RPS3a, RPS5, RPS10, and RPS17). In addition, three others varied in more than two species (RPSa, RPS2, and RPS25) (Table 3). Senegalese sole RPSa and RPS2 showed the highest differences in size being 18 amino acids longer and 13 amino acids shorter than in human, respectively.
Phylogenetic analysis of RPS27 genes
Two and four cDNAs encoding RPS27 were found in Sen-egalese sole (referred to as RPS27-1 and RPS27-2) and Atlantic halibut (referred to as 1, 2, RPS27-3, and RPS27-4), respectively (Figure 1A). In Senegalese sole, the total lengths of RPS27-1 and RPS27-2 were 485 and 507 nucleotides (nt), respectively. They were repre-sented by 7 and 1 clones, respectively (Table 2A). In
Atlan-Table 2: Structural characteristics of the cDNAs encoding RPs of (A) Senegalese sole, Solea senegalensis and (B) Atlantic halibut,
Hippoglossus hippoglossus. Lengths of coding regions, available 5'-UTR, 3'-UTR and poly (A) tail distances from poly(A) signals are
indicated. Asterisk (*) denotes RPS coding sequences that were derived partially or completely from sequences present in GenBank. ND, not detected.
(A)
Gene # clones Accession # Coding region 5'-UTR 3'-UTR Poly(A) from poly(A)Signal
RPSa 15 AB291586 942 60 41 17 RPS2 24 AB291554 843 ND 39 12 RPS3 16 AB291555 738 9 84 17 RPS3a 13 AB291556 801 1 41 17 RPS4 7 AB291557 792 ND 57 17 RPS5 5 AB291558 612 29 62 37 RPS6 14 AB291559 750 23 39 22 RPS7 19 AB291560 585 51 36 13 RPS8 6 AB291561 627 ND 52 24 RPS9 6 AB291562 585 46 67 14 RPS10 9 AB291563 501 5 44 15 RPS11 7 AB291564 486 11 77 26 RPS12 16 AB291565 399 54 23 11 RPS13 4 AB291566 456 3 37 13 RPS14 2 AB291567 456 37 43 13 RPS15 4 AB291568 438 24 43 16 RPS15a 4 AB291569 393 34 38 16 RPS16 3 AB291570 441 18 39 14 RPS17 2 AB291571 405 21 39 11 RPS18 10 AB291572 459 5 39 15 RPS19 7 AB291573 444 5 22 22 RPS20 6 AB291574 360 98 54 24, 29 RPS21 4 AB291575 252 92 44 7 RPS23 5 AB291576 451 19 41 14 RPS24 9 AB291577 396 17 84 22 RPS25 5 AB291578 372 6 66 24 RPS26 6 AB291579 348 23 47 15 RPS27-1 7 AB291580 255 30 200 20 RPS27-2 1 AB291581 255 62 190 13 RPS27a 7 AB291582 471 77 36 19 RPS28 - AB291583 210 1 126 21 RPS29 1 AB291584 171 5 103 14 RPS30 8 AB291585 402 35 96 15 (B)
Gene # clones Accession # Coding region 5'-UTR 3'-UTR Poly(A) from poly(A) Signal
RPSa 3 EB034722, EB039353 930 84 41 17
RPS2* 4 EB029719, EB030051 858 3 41 12
RPS3 2 EB034826, EB036030 741 25 126 12
RPS3a 6 EB035413, EB031090 801 23 41 14
RPS4 8 EB032598 792 41 57 20 RPS5 2 EB032359 EB036495 612 44 44 14 RPS6 2 EB031692, EB032095 750 40 33 14 RPS7 7 EB032431 585 37 33 14 RPS8 5 EB035663 627 24 39 11 RPS9 2 EB040140, EB032308 585 46 60 19 RPS10 2 EB031080 501 39 41 15 RPS11 5 EB035513 486 23 67 11 RPS12 1 EB029693 399 65 23 11 RPS13 1 EB034224 456 21 41 14 RPS14 3 EB040078 456 43 38 12 RPS15 3 EB036829, EB029855 438 25 42 18
tic halibut, total lengths ranged between 499 and 963 nt for RPS27-2 and RPS27-3, respectively. The Atlantic hali-but RPS27-4 had a slightly shorter coding region (249 nt), whereas no putative polyadenylation signal could be identified in RPS27-3. RPS27-1 and RPS27-3 were repre-sented by 4 and 5 clones in the halibut libraries, respec-tively, and RPS27-4 by only 1 EST.
Both Senegalese sole paralogs showed a high divergence at the nucleotide level when complete cDNAs (48.4% iden-tity) or coding regions (73.7%) were aligned. At the amino acid level, they differed in 9 residues with a sequence identity of 89.3% (Figure 1B; Table 4). Similarly, low sequence similarity (36.5–49.4%) was detected among Atlantic halibut full-length sequences. These val-ues ranged between 66.7 (RPS27-1 and RPS27-4) and 82.0% (RPS27-1 and RPS27-3) in the coding regions. At the protein level, RPS27-4 was 2 amino acids shorter that the other paralogs. Amino acid similarities ranged between 74.4 (RPS27-3 and RPS27-4 with 21 amino acid changes) and 95.2% (RPS27-1 and RPS27-3 with 4 resi-due differences). Among species, S. senegalensis RPS27-1 and H. hippoglossus RPS27-1 were the closest evolutionary homologues with 82.5% similarity using full-length sequence, 92.5% in coding sequence and 100% in amino acid sequence (Table 4).
A phylogenetic analysis based on RPS27 coding sequences using the NJ, MP and ML methods showed that fish RPS27 genes grouped mainly in two distinct clades (Figure 2). Both Senegalese sole and Atlantic halibut RPS27-2 genes clustered with their fish counterparts. The RPS27-4 appeared more closely related to RPS27-2 than the other
two Atlantic halibut RPS27 genes. Moreover, RPS27-2 and RPS27L genes in rat and human, respectively, formed a sister clade sharing a common ancestor with fish RPS27-2 genes (bootstrap values higher than 50%). The other fish RPS27 gene copies appeared linked in a clade that was not well resolved. Both Senegalese sole and Atlantic halibut RPS27-1 grouped with P. flesus and T. nigroviridis RPS27-1 (bootstrap values higher than 70%). Curiously, this clade contained both I. punctatus RPS27 genes.
Gene expression analysis
We used a quantitative approach based on reverse tran-scription followed by real-time PCR amplification to investigate the steady-state levels of eight sole RP tran-scripts (RPS2, RPS3a, RPS15, RPS27-1, RPS27-2, RPS27a, RPS28, and RPS29) in liver, spleen, intestine, stomach, head kidney, gills, muscle, brain, heart, and skin. Relative gene expression levels were normalized by measuring ubiquitin levels.
All eight RP genes were expressed in detectable amounts in all tissues (Figure 3). RPS2 transcripts were the most abundant except in brain, where RPS27-1 showed the highest values (1.82-fold higher than RPS2). On the other hand, RPS27-2 was expressed at the lowest level in all tis-sues analyzed.
RP genes were expressed differentially among tissues. RPS2, RPS15, and RPS28 exhibited lower expression lev-els in brain and RPS3a transcripts were reduced in brain, heart, and skin. In contrast, RPS27-2 was expressed more highly in intestine and stomach, and RPS29 in heart. If we calculate the mean ribosomal expression ratio as a global
RPS15a 2 EB036744 393 212 36 14 RPS16 1 EB038832 441 33 44 19 RPS17 1 EB035783 405 24 38 12 RPS18 6 EB035452 459 25 46 14 RPS19 2 EB030274 444 27 21 20 RPS20 2 EB038732 360 97 34 12 RPS21 3 EB030651 252 71 45 8 RPS23 5 EB035807 432 59 42 16, 21 RPS24 1 EB034880 399 34 81 19 RPS25 3 EB040606, EB040657 396 21 49 12 RPS26 7 EB036835 348 29 49 11 RPS27-1 4 EB039502 255 73 207 11 RPS27-2* DN794622 255 52 192 8 RPS27-3 5 EB039943 255 73 >635 >451 RPS27-4 1 EB040256 249 84 >402 >74 RPS27a 4 EB038389 471 52 43 17 RPS28 1 EB037921 210 22 123 16 RPS29* DN792676 171 30 >103 >15 RPS30 4 EB032882 402 59 96 15
* GenBank sequences comprise final contig
Table 2: Structural characteristics of the cDNAs encoding RPs of (A) Senegalese sole, Solea senegalensis and (B) Atlantic halibut,
Hippoglossus hippoglossus. Lengths of coding regions, available 5'-UTR, 3'-UTR and poly (A) tail distances from poly(A) signals are
indicated. Asterisk (*) denotes RPS coding sequences that were derived partially or completely from sequences present in GenBank. ND, not detected. (Continued)
RP expression index, all tissues showed similar values (0.74–0.99) except brain with only 0.48.
We also investigated the expression pattern of RP genes during sole larval development. mRNA levels were deter-mined in samples extracted from whole larvae pools col-lected from 2 to 22 DAH (Figure 4). Expression levels of each RP gene were normalized to that of GAPDH. RPS2, RPS27-1, RPS27a, RPS28, and RPS29 showed higher tran-script levels than RPS3a, RPS15 and RPS27-2 during early (2 to 3 DAH) larval development in Senegalese sole.
All RP mRNAs increased from 2 to 3 DAH, 24 hours after first external feeding (2.1-fold as global mean). Fold induction values ranged between 1.7 for both RPS27-1 and RPS28 and 3.0 for RPS27-2. These levels were reduced at 9 DAH, two days before the onset of eye migration, with the lowest values at the first metamorphic stages (13 DAH). The number of mRNA molecules for the 8 RPs ana-lyzed declined approximately 3.5-fold as global mean from 3 (pre-metamorphosis) to 13 DAH (metamorpho-sis). The fold reduction values ranged between 1.7 and 10.3 for RPS28 and RPS27-2, respectively. RPS27-1 was expressed at a higher level than RPS27-2 during all
pre-Table 3: Amino acid comparisons of the RPs from S. senegalensis (Sse) and H. hippoglossus (Hhi) with those of I. punctatus (Ipu), F.
rubripes (Fru) and human (Hsa). Similarity values for Senegalese sole and Atlantic halibut are separated by "/".
Number of aminoacids Similarity (%)
Gene Sse Hhi Ipu Fru Hsa Sse/Hhi Ipu Fru Hsa
Sa 313 309 317 306 295 91.3 88.5/88.0 90.5/89.5 86.8/88.1 S2 280 285 278 279 293 94.0 96.3/91.0 97.3/92.0 90.0/85.0 S3 245 246 245 245 243 97.6 98.8/96.3 99.2/96.7 95.9/96.3 S3a 266 266 266 266 264 96.6 94.7/94.7 96.2/95.5 93.9/93.6 S4 263 263 263 263 263 263 96.6 95.8/93.9 95.8/94.3 93.5/92.8a 89.4/88.2b S5 203 203 203 203 204 99.5 99.0/98.5 97.0/96.6 97.5/97.0 S6 249 249 249 249 249 98.4 95.6/94.0 98.4/97.2 95.6/94.4 S7 194 194 194 194 194 98.5 96.4/95.9 98.5/99.0 96.9/96.4 S8 208 208 208 208 208 98.1 89.4/88.9 96.2/94.2 94.2/93.8 S9 194 194 194 194 194 97.9 95.9/96.9 97.4/96.6 95.9/96.9 S10 166 166 166 166 165 97.6 96.4/94.6 97.0/95.8 90.3/89.7 S11 161 161 159 161 158 98.1 90.6/91.8 97.5/96.9 89.2/89.2 S12 132 132 132 132 132 97.7 97.7/95.5 98.5/97.7 97.7/96.2 S13 151 151 151 151 151 98.0 98.7/98.0 100/98.0 98.7/96.7 S14 151 151 151 151 151 96.0 95.4/99.3 96.0/100 96.0/100 S15 145 145 145 145 145 98.6 96.6/96.6 99.3/99.3 94.5/94.5 S15a 130 130 130 130 130 100 96.9/96.9 99.2/99.2 97.7/97.7 S16 146 146 146 146 146 97.9 96.6/97.3 95.2/95.2 96.6/95.9 S17 134 134 134 134 135 92.5 92.5/96.3 91.8/97.0 92.5/96.3 S18 152 152 152 152 152 98.7 99.3/98.0 100/98.7 98.0/98.0 S19 147 147 147 146 145 92.5 89.1/87.1 95.2/95.9 86.9/84.1 S20 119 119 119 119 119 98.3 98.3/97.5 100/98.3 98.3/97.5 S21 83 83 83 83 83 92.8 92.8/90.4 95.2/89.2 94.0/95.2 S23 143 143 143 143 143 100 99.3/99.3 100/100 98.6/98.6 S24 131 132 131 131 133 98.5 96.9/96.2 95.4/97.7 90.1/90.9 S25 123 131 124 123 125 95.1 83.1/82.3 96.7/95.1 82.4/80.8 S26 115 115 115 115 115 98.3 93.0/94.8c 93.9/94.8d 96.5/98.3 93.9/95.7 S27-1 84 84 84 84 84 See Table 4 S27-2 84 84 84 84 84 S27-3 84 S27-4 82 S27a 156 156 156 156 156 100 100/100 100/100 98.7/98.7 S28 69 69 69 69 69 98.6 100/98.6 97.1/95.7 95.7/94.2 S29 56 56 56 56 56 98.2 100/98.2 100/98.2 98.2/96.4 S30 133 133 133 133 133 94.7 85.8/85.0 90.3/91.0 80.6/81.2 Overall 92.1 94.0/90.9 95.4/92.5 92.8/89.8
a and b refer to similarities to H. sapiens RPS4X and RPS4Y isoforms, respectively. c and d refer to similarities to I. punctatus RPS26-1 and RPS26-2 isoforms, respectively.
metamorphic, metamorphic and post-metamorphic stages (28-fold higher on average).
Discussion
In this work, we describe the complete set of 40S RPs in the Senegalese sole and Atlantic halibut. Sequences were generated from normalized cDNA libraries constructed for expressed sequence tag (EST) analysis. The rapid devel-opment of genomics in all biological research areas,
including aquaculture, and the high representation of RPs in the cDNA libraries have favoured the availability of an increasing number of RP sequences from different organ-isms [30]. This fact has motivated their proposed use as appropriate molecular markers for phylogenetic analysis. In fact, concatenation of orthologous RP amino acid sequences to form a single one of more than 10,000 char-acters has allowed the reconstruction of phylogenetic rela-tionships between animal, fungal, and plant kingdoms
RPS27 genes from S. senegalensis (Sse) and H. hippoglossus (Hhi)
Figure 1
RPS27 genes from S. senegalensis (Sse) and H. hippoglossus (Hhi). (A) Coding sequence alignment. (B) Amino acid alignment. Dots indicate identity and hyphens represent indels.
Table 4: Amino acid similarities of RPS27 from S. senegalensis (Sse) and H. hippoglossus (Hhi) with those of I. punctatus (Ipu), F. rubripes (Fru) and H. sapiens (Hsa).
Sse RPS27-2 Hhi RPS27-1 Hhi RPS27-2 Hhi RPS27-3 Hhi RPS27-4 Ipu RPS27-1 Ipu RPS27-2 Fru RPS27-1 Hsa RPS27-1 Hsa RPS27-L
SseRPS27-1 89.3 100.0 91.7 95.2 79.3 96.4 97.6 100.0 98.8 95.2 SseRPS27-2 89.3 96.4 85.7 74.4 90.5 90.5 89.3 89.3 86.9 HhiRPS27-1 91.7 95.2 79.3 96.4 97.6 100.0 98.8 95.2 HhiRPS27-2 88.1 76.8 92.9 92.9 91.7 91.7 89.3 HhiRPS27-3 74.4 91.7 92.9 95.2 94.0 91.7 HhiRPS27-4 79.3 79.3 79.3 78.0 75.6 IpuRPS27-1 98.8 96.4 95.2 92.9 IpuRPS27-2 97.6 96.4 92.9 FruRPS27-1 98.8 95.2 HsaRPS27-1 96.4
[31]. With regard to this, Pleuronectiformes comprises a broad taxonomic group with 11 families and about 500 species worldwide, some of them of high commercially interest both in fisheries and aquaculture [32-34]. All flat-fish species share in common an asymmetrical body development and a bottom-dwelling mode of life. How-ever, their high phenotypic similarity has invoked great differences in the number and nomenclature of taxa depending on the relevance assigned to morphologic fea-tures [35-38]. Most phylogenetic studies focused on rela-tionships among Pleuronectiformes have been based on partial mitochondrial DNA sequences [39-41]. The description of the complete set of RPs in one
Pleuronecti-dae and SoleiPleuronecti-dae species provides new molecular markers to investigate the taxonomy and phylogeny among Pleu-ronectiformes. Also, the existence of paralogous genes exhibiting differential expression patterns in tissues, and even more important during larval development, particu-larly in metamorphosis, suggests RPs as interesting molec-ular markers to investigate flatfish genome evolution in terms of gain and loss of paralogous genes and the availa-bilty to acquire new functions (neofunctionalization) or divide the ancestral function between the paralogs (sub-functionalization) [42,43].
Three rounds of large-scale gene duplications (referred to as 1R, 2R, and 3R or fish-specific genome duplication) have been identified in fish [44,45]. These duplications are responsible, at least in part, for their speciation, adap-tive radiation and high morphological complexity [45]. Although the majority of these gene duplicates have been lost or silenced during evolution, several gene copies have been described for some group of genes including glyco-lytic enzymes [44], Hox genes [46,47] and hormones and their receptors [48,49]. Similarly, different gene copies have been described for some RPs. In human, two
differ-Gene expression of RPS2, RPS3a, RPS15, RPS27-1, RPS27-2 RPS27a, RPS28 and RPS29 during larval development in Sen-egalese sole
Figure 4
Gene expression of RPS2, RPS3a, RPS15, RPS27-1, RPS27-2 RPS27a, RPS28 and RPS29 during larval development in Sen-egalese sole. Expression ratios of each RP mRNA relative to GAPDH mRNA ± SEM are shown. Values with the same superscript are not significantly different (P < 0.05).
Phylogenetic relationships of RPS27 genes from S. senegalen-sis (Sse), H. hippoglossus (Hhi) H. sapiens (Hsa), R. norvegicus (Rno), I. punctatus (Ipu), P. flesus (Pfl), D. rerio (Dre) and T. nigroviridis (Tni)
Figure 2
Phylogenetic relationships of RPS27 genes from S.
senegalen-sis (Sse), H. hippoglossus (Hhi) H. sapiens (Hsa), R. norvegicus
(Rno), I. punctatus (Ipu), P. flesus (Pfl), D. rerio (Dre) and T.
nigroviridis (Tni). Xenopus laevis RPS27 was used as outgroup
to root tree. Bootstrap values using NJ/MP/ML are indicated on each branch.
Gene expression of RPS2, RPS3a, RPS15, RPS27-1, RPS27-2 RPS27a, RPS28 and RPS29 in tissues from Senegalese sole
Figure 3
Gene expression of RPS2, RPS3a, RPS15, RPS27-1, RPS27-2 RPS27a, RPS28 and RPS29 in tissues from Senegalese sole. Expression ratios of each RP mRNA relative to ubiquitin mRNA ± SEM are shown. Values with the same superscript are not significantly different (P < 0.05).
ent RPS4 genes exist, one encoded on the X and one on the Y chromosome. Rat possesses two distinct RPS27 tran-scripts that are expressed differentially in the hypothala-mus [5]. In fish, I. punctatus has two paralogous genes of RPS26 and RPS27 [9]. In S. senegalensis and H.
hippoglos-sus, two and four different RPS27 genes have been
detected, respectively. Phylogenetic analysis revealed that RPS27-1 and RPS27-2 sequences grouped in two separate clades supported by significant bootstrap values. Although Thomas et al. [5] proposed the RPS27-2 as a mammalian-specific isoform, the identification of orthol-ogous sequences for both RPS27 genes in different fish species supports the hypothesis of at least two RPS27 par-alogs as a common feature in fish as well. Moreover, two additional RPS27 genes (referred to as RPS27-3 and RPS27-4) were identified in H. hippoglossus. These two par-alogous genes might have appeared in the 3R or fish-spe-cific genome duplication, In this respect, we should highlight that both RPS27 genes in I. punctatus grouped together in the same clade with S. senegalensis RPS27-1 and H. hippoglossus RPS27-1 and RPS27-3. This clustering suggests the existence of, at least, a third RPS27 gene in I.
punctatus orthologous to fish RPS27-2. Such a hypothesis
is also supported by the fact that both I. punctatus RPS27 paralogs were expressed at a similar level (represented by 7 and 10 clones for RPS27-1 and RPS27-2, respectively) [9], whereas in S. senegalensis RPS27-2 was expressed at a much lower level than RPS27-1 in all tissues and during larval development as determined by real-time PCR. During embryogenesis, after mid-blastula transition in zebrafish, RP genes co-ordinately increase their expression [16-18]. In addition, in Atlantic halibut up to 40 and 41 RPs increase mRNA levels from embryos to 1 day-old yolk sac larvae and fast skeletal muscle in juveniles, respec-tively [15]. In this study, we provide evidence that one day after first feeding, the eight RPs analyzed by real-time PCR increase their expression levels in Senegalese sole also. During this period, larvae undergo important physiologi-cal and morphologiphysiologi-cal changes such as the opening of the mouth and anus. When live prey are provided for feeding, different organs such as the liver, pancreas, and the diges-tive tract are activated, promoting larval metabolism [50]. Larval rearing is a critical period during which different aspects concerning important anatomical and physiologi-cal traits in the juvenile stage are modulated. There are reports on biomarkers for fish larvae fed different diets that focused specifically on oxidative stress [51] and diges-tive enzymes [52]. The co-ordinate changes in RP expres-sion under important physiological events such as the first feeding suggest RPs might be considered as biomarkers that could provide broader information about the general physiological condition in fish. In addition, the high abundance of these RPs (about 50% of RNA polymerase II transcription in rapidly growing yeast cells [53]), most
of which are considered as house-keeping genes, indicates that even small induction values, as observed in this sur-vey (1.7–3.0 fold), can play an important physiological role.
Although RP transcript levels increased after first feeding, they dropped at the first metamorphic stages (13 DAH). In this respect, we should take into account that Senega-lese sole exhibits two different growth rates during larval development. At pre-metamorphosis, larvae grow at almost twice the rate as at metamorphosis and accumulate energy reserves in tissues to be used during this important period [26,29]. The lower growth rate at metamorphosis has been correlated with reduced IGF-II expression levels [54], an activator of the 70-kDa ribosomal S6 kinase (S6K1), a serine/threonine protein kinase that plays a cen-tral role in cell growth and proliferation. This kinase mediates the phosphorylation of RPS6, thereby enabling efficient translation of 5'-terminal oligopyrimidine tract (5'-TOP) mRNAs. Since RPs and translation elongation factors are encoded by 5'-TOP mRNAs, signalling along the S6K1 pathway may regulate ribosome biogenesis and therefore the response to growth conditions [55,56]. Moreover, apoptosis has been shown to play an impor-tant role in the organ-rebuilding process during flatfish metamorphosis [57] and some RPs have been associated with apoptotic processes [25,58]. The reduction in RP gene expression, especially at the beginning of sole meta-morphosis, suggests they could also be involved in the control of apoptosis during metamorphosis.
We evaluated gene expression of eight RPs in ten different sole tissues. Overall, all tissues except brain expressed RPs at a similar level. These data agree with those obtained in
I. punctatus using a transcriptomic approach.
Representa-tion of RPs was reduced in brain compared with skin and head kidney [9]. Ribosome formation can vary in response to cellular demands and their protein biosyn-thetic requirements [59] and these differences in the steady-state number of RP transcripts might reflect the dis-tinct metabolic activity of tissues.
RPs exhibited different expression levels in different sole tissues. RPS27-2 mRNA levels were up to 41.9 and 54.7-fold lower than RPS27-1 and RPS2, respectively. These dif-ferences in relative mRNA abundance among RPs were also observed in I. punctatus and H. hippoglossus larvae and juveniles [9,15]. Such difference suggests a translational regulation to facilitate the correct assembly of ribosomes. Moreover, there is increasing evidence that RPs modulate a variety of cellular activities independent of their own involvement in the protein biosynthesis such as replica-tion, transcripreplica-tion, RNA processing, DNA repair, and inflammation [60]. In our study, some RPs exhibited dif-ferent tissue expression patterns. For instance, RPS2 was
highly expressed in all tissues except in brain where RPS27-1 transcripts were the highest. These data agree with those described for I. punctatus where the number of ESTs corresponding to RPS2 and RPS27 were 10-fold lower and 3-fold higher, respectively, in brain than in skin and head kidney [9]. In addition, RPS3a transcripts were reduced in brain, heart, and skin, and RPS27-2 showed the highest expression levels in intestine and stomach. All these data underscore the necessity for new studies to elu-cidate the regulation of these RPs in tissues and their pos-sible extraribosomal function.
Conclusion
In this work we have identified and characterized the complete set of 40S RPs in two Pleuronectiformes: Sen-egalese sole and Atlantic halibut. These data provide new molecular markers to investigate genome evolution and phylogenetic relationships among flatfish. Also, gene expression studies in Senegalese sole have revealed a co-ordinate response after first feeding in larvae suggesting a possible role of RPs as general condition biomarkers to estimate larval physiological status in response to chang-ing environmental conditions. Moreover, the differential expression patterns in tissues suggest that RPs might per-form other functions distinct from protein biosynthesis.
Methods
Identification of RP cDNAs in Senegalese sole and Atlantic halibut
Ten cDNA libraries were constructed from different larval stages and adult tissues of Senegalese sole using the ZAP Express® cDNA Syntesis kit and Zap Express cDNA
Giga-pack® III Gold Cloning kit (Stratagene) following the
manufacturer's protocol (Cerdà et al., in preparation). The libraries were pooled and normalized, and approximately 11,000 randomly selected clones were sequenced from the 3'-end. Expressed sequence tags (ESTs) encoding RPs were identified after EST annotation. For RPS28 isolation, we designed specific primers (Table 1) using a partial sequence from a suppression subtractive hybridization library. RPS28 was amplified from the premetamorphic larval development library using combination of specific primers and the universal primers T3 and T7.
In halibut, normalised cDNA libraries were constructed for five different larval time points (hatching, mouth-opening, midway to metamorphosis, premetamorphosis, and postmetamorphosis) and eight adult tissues (testis, ovary, liver, head kidney, spleen, skin, gill, and intestine) [61], incorporated into the Pleurogene database http:// www.pleurogene.ca and provisionally annotated using AUTOFACT [62] implemented on the database.
Fish sampling
Juvenile Senegalese sole individuals (n = 3) were obtained from IFAPA Centro El Toruño facilities (El Puerto Santa María, Cádiz, Spain). They were sacrificed by immersion in tricaine methanesulfonate (MS-222). Liver, spleen, intestine, stomach, head kidney, gills, muscle, brain, heart, and skin were rapidly dissected, frozen in liquid nitrogen and stored at -80°C until use.
For larval studies, fertilized eggs from a naturally spawn-ing Senegalese sole broodstock (IFAPA Centro El Toruño) were collected. They were incubated in a 150 L tank at 19– 21°C for two days. Newly hatched larvae were transferred to a 400 L tank at an initial density from 45 to 50 larvae L -1 with a 16L:8D photoperiod and a light intensity of 600–
800 lux. Larvae were fed rotifers (Brachionus plicatilis) 3 DAH till 9 DAH. From 7 DAH enriched artemia metanau-plii were fed until the end of the experiment. Pools of lar-vae from 2 to 22 DAH (n = 3) were collected, washed with DEPC water, frozen in liquid nitrogen and stored at -80°C until analysis.
RNA isolation and gene expression analysis
Homogenization of juvenile tissues and larvae was carried out using Lysing Matrix D (Q-BioGene) for 40 s at speed setting 6 in the Fastprep FG120 instrument (Bio101). Total RNA was isolated from 50 mg of S. senegalensis tis-sues or pools of larvae using the RNeasy Mini Kit (Qia-gen). All RNA isolation procedures were performed in accordance with the manufacturer's protocol. In all cases, total RNA was treated twice with DNase I using the RNase-Free DNase kit (Qiagen) for 30 min in order to avoid amplification of contaminated genomic DNA. RNA sam-ple quality was checked using Experion (Bio-Rad) and quantification was performed spectrophotometrically. Total RNA (1 µg) from each sample was reverse-tran-scribed using the iScript™ cDNA Synthesis kit (Bio-Rad). Reverse transcription reactions were performed in dupli-cate. Lack of genomic DNA contamination was confirmed by PCR amplification of RNA samples in the absence of cDNA synthesis.
Real-time analysis was carried out on an iCycler (Bio-Rad). Reactions were performed in a 25 µl volume con-taining cDNA generated from 10 ng of original RNA tem-plate, 300 nM each of specific forward (F) and reverse (R) primers (Table 1), and 12.5 µl of iQ™ SYBR Green Super-mix (Bio-Rad). Matching oligonucleotide primers were designed using Oligo v6.89 software (Medprobe). The amplification protocol used was as follows: initial 7 min denaturation and enzyme activation at 95°C, 40 cycles of 95°C for 15 s and 70°C for 30 s. Each assay was per-formed in duplicate. For normalization of cDNA loading, all samples were run in parallel with a housekeeping gene (glyceraldehyde-3-phosphate dehydrogenase (GAPDH;
[DDBJ:AB291587]) or ubiquitin ([DDBJ:AB291588]) for larval development or juvenile tissues, respectively). To estimate efficiencies, a standard curve was generated for each primer pair based on known quantities of cDNA (10-fold serial dilutions corresponding to cDNA transcribed from 100 to 0.01 ng of total RNA). All calibration curves exhibited correlation coefficients higher than 0.99 and the corresponding real-time PCR efficiencies were 0.90–0.95. Relative mRNA expression of RPs was determined using the Ct method (value obtained by subtracting the Ct value of GAPDH or ubiquitin mRNA from the Ct value of the target mRNA). Data was expressed as the ratio (calculated using 1.93-(∆Ct)) of target mRNA to reference (GAPDH or
ubiquitin) mRNA. Owing to the small differences among amplicons both in size (87–139 bp) and %GC (45.4– 65.4), the relative sensitivity factor KRS was assumed to be one.
Results were expressed as mean ± SEM. Comparisons among groups were performed with one-way analysis of variance, followed by a Tukey test for identification of the statistically distinct groups. Significance was accepted for
P < 0.05.
Sequence and phylogenetic analysis
Alignments of sequences were carried out and the sequence similarities calculated by the MegAlign program from the LASERGENE software suite. For phylogenetic analysis, sequences of RPS27 from different species including Homo sapiens ([GenBank:HSU57847, Gen-Bank:NM_015920]; [6,63]), Rattus norvegicus ([Gen-Bank:AF184893, EMBL:X59375]; [5,64]), Xenopus laevis ([GenBank:BC053815]; [65]), Ictalurus punctatus ([Gen-Bank:AF402836, GenBank:AF402837]; [9]), Platichthys
flesus ([GenBank:DV566302 and GenBank:DV567451];
unpublished), Danio rerio ([GenBank:BQ077524, Gen-Bank:BC114281]; unpublished) and Tetraodon nigroviridis ([EMBL:CR722207 and EMBL:CR642405]; unpublished) were employed. Coding sequences were aligned using MegAlign software. Neighbor-joining (NJ), maximum parsimony (MP) and maximum likelihood (ML) analyses were carried out using PAUPv4beta10 software [66]. The
TrNef + G model of sequence evolution was the most
appropriate as selected by MODELTEST v3.5 [67]. The parameters of ML methods were R(a) = 1.0000, R(b) = 3.2865, R(c) = 1.0000, R(d) = 1.0000, and R(e) = 6.057. The gamma distribution shape parameter was estimated to be 0.3234. The degree of confidence assigned to nodes in trees was achieved by bootstrapping with 1,000 repli-cates.
Authors' contributions
MM designed the study, carried out the phylogenetic anal-yses, and drafted the manuscript. CI carried out the gene expression analysis and helped to draft the manuscript.
EA performed the Senegalese sole cultures and samplings. JPC participated in the study design and coordination and helped to draft the manuscript. SED participated in sequence analysis and drafted the manuscript. All authors read and approved the final manuscript.
Acknowledgements
This work has been financially supported by PLEUROGENE project funded by the Genome Canada-Genoma España joint program. Sequencing by the Atlantic Genome Centre http://www.tagc.ca, Halifax, Nova Scotia, Canada a partnership between Genome Atlantic and the National Research Coun-cil of Canada Institute for Marine Biosciences, is gratefully acknowledged. This is NRC publication number 42688.
References
1. Zarivach R, Bashan A, Berisio R, Harms J, Auerbach T, Schluenzen F, Bartels H, Baram D, Pyetan E, Sittner A, et al.: Functional aspects of ribosomal architecture: symmetry, chirality and regulation. J
Phys Org Chem 2004, 17:901-912.
2. Wool IG, Endo Y, Chan YL, Glück A: Studies of the structure, function and evolution of mammalian ribosomes. In Ribosome
Structure, Function and Evolution Edited by: Hill W, Dahlberg A, Garrett
R, Moore P, Schlessinger D, Warner J. Washington DC: Society for Microbiology; 1990:203-214.
3. Wool IG, Chan YL, Glück A: Structure and evolution of mamma-lian ribosomal proteins. Biochem Cell Biol 1995, 73:933-947. 4. Fisher EM, Beer-Romero P, Brown LG, Ridley A, McNeil JA, Lawrence
JB, Willard HF, Bieber FR, Page DC: Homologous ribosomal pro-tein genes on the human X and Y chromosomes: escape from X inactivation and possible implications for Turner syn-drome. Cell 1990, 63:1205-1218.
5. Thomas EA, Alvarez CE, Sutcliffe JG: Evolutionarily distinct classes of S27 ribosomal proteins with differential mRNA expression in rat hypothalamus. J Neurochem 2000, 74:2259-2267.
6. He H, Sun Y: Ribosomal protein S27L is a direct p53 target that regulates apoptosis. Oncogene 2007, 19:2707-2716.
7. Planta RJ, Mager WH: The list of cytoplasmic ribosomal proteins of Saccharomyces cerevisiae. Yeast 1998, 14:471-477.
8. Ribosomal Protein Gene Database [http://ribosome.med.miya zaki-u.ac.jp]
9. Karsi A, Patterson A, Feng J, Liu Z: Translational machinery of channel catfish: I. A transcriptomic approach to the analysis of 32 40S ribosomal protein genes and their expression. Gene 2002, 291(1–2):177-186.
10. Patterson A, Karsi A, Feng J, Liu Z: Translational machinery of channel catfish: II. Complementary DNA and expression of the complete set of 47 60S ribosomal proteins. Gene 2003, 305:151-160.
11. Cujec TP, Tyler BM: Nutritional and growth control of ribos-omal protein mRNA and rRNA in Neurospora crassa. Nucleic
Acids Res 1996, 24:943-950.
12. Herruer MH, Mager WH, Woudt LP, Nieuwint RT, Wassenaar GM, Groeneveld P, Planta RJ: Transcriptional control of yeast ribos-omal protein synthesis during carbon-source upshift. Nucleic
Acids Res 1987, 15(24):10133-10144.
13. Milne AN, Mak WW, Wong JT: Variation of ribosomal proteins with bacterial growth rate. J Bacteriol 1975, 122:89-92. 14. Waldron C, Jund R, Lacroute F: Evidence for a high proportion of
inactive ribosomes in slow-growing yeast cells. Biochem J 1977, 168:409-415.
15. Bai J, Solberg C, Fernandes JM, Johnston IA: Profiling of maternal and developmental-stage specific mRNA transcripts in Atlan-tic halibut Hippoglossus hippoglossus. Gene 2006, 386:202-210. 16. Linney E, Dobbs-McAuliffe B, Sajadi H, Malek RL: Microarray gene
expression profiling during the segmentation phase of zebrafish development. Comp Biochem Physiol C Toxicol Pharmacol 2004, 138:351-362.
17. Lo J, Lee S, Xu M, Liu F, Ruan H, Eun A, He Y, Ma W, Wang W, Wen Z, et al.: 15000 unique zebrafish EST clusters and their future use in microarray for profiling gene expression patterns dur-ing embryogenesis. Genome Res 2003, 13:455-466.
18. Mathavan S, Lee SG, Mak A, Miller LD, Murthy KR, Govindarajan KR, Tong Y, Wu YL, Lam SH, Yang H, et al.: Transcriptome analysis of zebrafish embryogenesis using microarrays. PLoS Genet 2005, 1:260-276.
19. Kowalczyk P, Woszczynski M, Ostrowski J: Increased expression of ribosomal protein S2 in liver tumors, posthepactomized liv-ers, and proliferating hepatocytes in vitro. Acta Biochim Pol 2002, 49:615-624.
20. Pogue-Geile K, Geiser JR, Shu M, Miller C, Wool IG, Meisler AI, Pipas JM: Ribosomal protein genes are overexpressed in colorectal cancer: isolation of a cDNA clone encoding the human S3 ribosomal protein. Mol Cell Biol 1991, 11:3842-3849.
21. Cramton SE, Laski FA: String of pearls encodes Drosophila ribos-omal protein S2, has Minute-like characteristics, and is required during oogenesis. Genetics 1994, 137:1039-1048. 22. Watson KL, Konrad KD, Woods DF, Bryant PJ: Drosophila
homolog of the human S6 ribosomal protein is required for tumor suppression in the hematopoietic system. Proc Natl Acad
Sci USA 1992, 89:11302-11306.
23. Kim J, Chubatsu LS, Admon A, Stahl J, Fellous R, Linn S: Implication of mammalian ribosomal protein S3 in the processing of DNA damage. J Biol Chem 1995, 270:13620-13629.
24. Draptchinskaia N, Gustavsson P, Andersson B, Pettersson M, Willig TN, Dianzani I, Ball S, Tchernia G, Klar J, Matsson H, et al.: The gene encoding ribosomal protein S19 is mutated in Diamond-Blackfan anaemia. Nat Genet 1999, 21:169-175.
25. Naora H, Takai I, Adachi M, Naora H: Altered cellular responses by varying expression of a ribosomal protein gene: sequential coordination of enhancement and suppression of ribosomal protein S3a gene expression induces apoptosis. J Cell Biol 1998, 141:741-753.
26. Fernández-Díaz C, Yúfera M, Cañavate JP, Moyano FJ, Alarcón FJ, Díaz M: Growth and physiological changes during metamorphosis of Senegal sole reared in the laboratory. J Fish Biol 2001, 58:1-13. 27. Haug T: Biology of the Atlantic halibut, Hippoglossus
hippoglos-sus (L. 1758). Adv Mar Biol 1990, 26:2-70.
28. Power DM, Llewellyn L, Faustino M, Nowell MA, Bjornsson BT, Ein-arsdottir IE, Canario AV, Sweeney GE: Thyroid hormones in growth and development of fish. Comp Biochem Physiol C Toxicol
Pharmacol 2001, 130(4):447-459.
29. Parra G, Yúfera M: Comparative energetics during early devel-opment of two marine fish species, Solea senegalensis (KAUP) and Sparus aurata (L.). J Exp Biol 2001, 204:2175-2183.
30. Nakao A, Yoshihama M, Kenmochi N: RPG: the Ribosomal Pro-tein Gene database. Nucleic Acids Res 2004, 32:D168-170. 31. Veuthey AL, Bittar G: Phylogenetic relationships of fungi,
plan-tae, and animalia inferred from homologous comparison of ribosomal proteins. J Mol Evol 1998, 47:81-92.
32. Nelson JS: Fishes of the world. 3rd edition. New York: John Wiley & Sons; 1994.
33. Helfman G, Collette B, Facey D: The diversity of fishes. Malden, MA: Blackwell Science; 1997.
34. Froese R, Pauly D: FishBase. World Wide Web electronic publication.
version (01/2007) 2007 [http://www.fishbase.org].
35. Chapleau F: Pleuronectiform relationships: a cladistic reassess-ment. Bull Mar Sci 1993, 52:516-540.
36. Cooper JA, Chapleau F: Monophyly and intrarelationships of the family Pleuronectidae (Pleuronectiformes), with a revised classification. Fish Bull 1998, 96:686-726.
37. Hensley DA: An overview of the systematics and biogeography of the flatfishes. J Sea Res 1997, 37:187-194.
38. Hoshino K: Monophyly of the Citharidae (Pleuronectoidei: Pleuronectiformes: Teleostei) with considerations of pleu-ronectoid phylogeny. Ichthyol Res 2001, 48:391-404.
39. Pardo BG, Machordom A, Foresti F, Porto-Foresti F, Azevedo MFC, Bañón R, Sánchez L, Martínez P: Phylogenetic analysis of flatfish (Order Pleuronectiformes) based on mitochondrial 16S rDNA sequences. Sci Mar 2005, 69:531-543.
40. Infante C, Catanese G, Manchado M: Phylogenetic relationships among ten sole species (Soleidae, Pleuronectiformes) from the Gulf of Cadiz (Spain) based on mitochondrial DNA sequences. Mar Biotechnol (NY) 2004, 6:612-624.
41. Berendzen PB, Dimmick WW: Phylogenetic relationships of Pleuronectiformes based on molecular evidence. Copeia 2002, 3:642-652.
42. Force A, Lynch M, Pickett FB, Amores A, Yan YL, Postlethwait J: Pres-ervation of duplicate genes by complementary, degenerative mutations. Genetics 1999, 151:1531-1545.
43. Sidow A: Gen(om)e duplications in the evolution of early ver-tebrates. Curr Opin Genet Dev 1996, 6:715-722.
44. Steinke D, Hoegg S, Brinkmann H, Meyer A: Three rounds (1R/2R/ 3R) of genome duplications and the evolution of the glycolytic pathway in vertebrates. BMC Biol 2006, 4:16.
45. Volff JN: Genome evolution and biodiversity in teleost fish.
Heredity 2005, 94:280-294.
46. Hoegg S, Brinkmann H, Taylor JS, Meyer A: Phylogenetic timing of the fish-specific genome duplication correlates with the diversification of teleost fish. J Mol Evol 2004, 59:190-203. 47. Hoegg S, Meyer A: Hox clusters as models for vertebrate
genome evolution. Trends Genet 2005, 21:421-424.
48. Moncaut N, Somoza G, Power DM, Canario AV: Five gonado-trophin-releasing hormone receptors in a teleost fish: isola-tion, tissue distribution and phylogenetic relationships. J Mol
Endocrinol 2005, 34:767-779.
49. Sherwood NM, Adams BA: Gonadotropin-Releasing hormone in fish: Evolution, expression and regulation of the GnRH gene. In Hormones and Their Receptors in Fish Reproduction Volume 4. Edited by: Melamed P, Sherwood NM. Singapore: World Scientific Publishing Company; 2005:1-39.
50. Ribeiro L, Sarasquete C, Dinis MT: Histological and histochemical development of the digestive system of Solea senegalensis (Kaup, 1858) larvae. Aquaculture 1999, 171:293-308.
51. Fernández-Díaz C, Kopecka J, Cañavate JP, Sarasquete C, Solé M: Var-iations on development and stress defences in Solea
senega-lensis larvae fed on live and microencapsulated diets.
Aquaculture 2006, 251:573-584.
52. Gudmundsdottir A, Palsdottir HM: Atlantic cod trypsins: from basic research to practical applications. Mar Biotechnol (NY) 2005, 7:77-88.
53. Warner JR: The economics of ribosome biosynthesis in yeast.
Trends Biochem Sci 1999, 24:437-440.
54. Funes V, Asensio E, Ponce M, Infante C, Cañavate JP, Manchado M: Insulin-like growth factors I and II in the sole Solea
senegalen-sis: cDNA cloning and quantitation of gene expression in
tis-sues and during larval development. Gen Comp Endocrinol 2006, 149:166-172.
55. Jefferies HB, Fumagalli S, Dennis PB, Reinhard C, Pearson RB, Thomas G: Rapamycin suppresses 5'TOP mRNA translation through inhibition of p70s6k. EMBO J 1997, 16:3693-3704.
56. Terada N, Patel HR, Takase K, Kohno K, Nairn AC, Gelfand EW: Rapamycin selectively inhibits translation of mRNAs encod-ing elongation factors and ribosomal proteins. Proc Natl Acad Sci
USA 1994, 91:11477-11481.
57. Bao-Long B, Gui-Mei Y, Da-Ming R: Apoptosis in the metamor-phosis of Japanese flounder Paralichthys olivaceus. Acta Zool Sin 2006, 52:355-361.
58. Bushell M, Stoneley M, Sarnow P, Willis AE: Translation inhibition during the induction of apoptosis: RNA or protein degrada-tion? Biochem Soc Trans 2004, 32:606-610.
59. Woolford JL Jr, Warner JR: The ribosome and its synthesis. In The
Molecular Biology and Cellular Biology of the Yeast Saccharomyces cerevisiae
Edited by: Broach JR, Pringle JR, Jones EW. Cold Spring Harbor, NY: Cold Spring Harbor Laboratory Press; 1991:587-626.
60. Wool IG: Extraribosomal functions of ribosomal proteins.
Trends Biochem Sci 1996, 21:164-165.
61. Douglas SE, Knickle LC, Kimball J, Reith ME: Comprehensive EST analysis of Atlantic halibut (Hippoglossus hippoglossus), a com-mercially relevant aquaculture species. BMC genomics in press. 62. Koski LB, Gray MW, Lang BF, Burger G: AutoFACT: an automatic functional annotation and classification tool. BMC Bioinformatics 2005, 6:151.
63. Tsui SK, Lee SM, Fung KP, Waye MM, Lee CY: Primary structures and sequence analysis of human ribosomal proteins L39 and S27. Biochem Mol Biol Int 1996, 40:611-616.
64. Chan YL, Suzuki K, Olvera J, Wool IG: Zinc finger-like motifs in rat ribosomal proteins S27 and S29. Nucleic Acids Res 1993, 21:649-655.
65. Klein SL, Strausberg RL, Wagner L, Pontius J, Clifton SW, Richardson P: Genetic and genomic tools for Xenopus research: The NIH Xenopus initiative. Dev Dyn 2002, 225:384-391.
66. Swofford DL: PAUP*. Phylogenetic Analysis Using Parsimony (*and Other Methods). Version 4 edition. Sunderland, Massachu-setts: Sinauer Associates; 2003.
67. Posada D, Crandall KA: Modeltest: testing the model of DNA substitution. Bioinformatics 1998, 14:817-818.