Assessment Framework for Wireless V2V
Communication-based ITS Applications
MASSACHUSETTS INSITTE
by
OF TECHNOLOGYSwapnil Shankar Rajiwade
MAR
0
8
2012
Bachelor of Technology in Civil Engineering (2009)
LIBRARIES
Indian Institute of Technology Bombay, Mumbai, India
Submitted to the Department of Civil and Environmental Engineering
in partial fulfillment of the requirements for the degree of
ARCHNVES
Master of Science in Transportation
at the
MASSACHUSETTS INSTITUTE OF TECHNOLOGY
September 2011
©
Massachusetts Institute of Technology 2011. All rights reserved.
A u th or ...
2 ...
Department of
Ci
and Environmental Engineering
August 18, 2011
Certified by...
Moshe E. Ben-Akiva
Edmund K. Turner Professor of Civil and Environmental Engineering
Thesis Supervisor
,1
A
Accepted by ...
Heidi M.
ep[
Assessment Framework for Wireless V2V
Communication-based ITS Applications
by
Swapnil Shankar Rajiwade
Submitted to the Department of Civil and Environmental Engineering on August 18, 2011, in partial fulfillment of the requirements for the degree of
Master of Science in Transportation
Abstract
Inter-vehicle communication enabled by wireless technology is an emerging area of In-telligent Transportation Systems (ITS). This technology has generated great interest among automobile manufacturers and ITS researchers alike because of its poten-tial to improve safety and non-safety ITS applications by supporting data collection and dissemination at the individual vehicle level. A modelling framework based on a microscopic traffic simulator is presented in this thesis to explore the effects of wireless Vehicle-to-Vehicle (V2V) communication based ITS applications on traffic performance.
Microscopic traffic simulators describe the interaction between drivers and infras-tructure at individual vehicle level. The behaviour models in microscopic traffic sim-ulators describe driving decisions like route choice, car-following and lane-changing. The existing behaviour model is extended to incorporate the effect of V2V commu-nication based applications by tying information generated by the application to the behaviour model.
A case study on a road network in Singapore with green light prediction
applica-tion as the V2V communicaapplica-tion applicaapplica-tion is implemented. The car-following model in MITSIMLab is modified to account for speed advisories generated by green light prediction application. The application shows gains in travel time savings and a smoother traffic flow as a result of the green light prediction. Higher improvements across penetration rates were observed at high demand levels. The incremental im-pact of the application on traffic performance tapers off at higher penetration rates. Drivers responding to the speed advisories also affect vehicles immediately following them. Hence the effective penetration rate of the application is higher than actual penetration rate. The results imply that the green light prediction application would reduce the average number of halts per trip by approximately 10% at existing travel demand. The current model can be extended to test other V2V based ITS applica-tions and to couple with a wireless network simulator to represent wireless data flows more realistically.
Thesis Supervisor: Moshe E. Ben-Akiva
Acknowledgements
I would like to take this opportunity to express my sincere gratitude to my research advisor Prof. Moshe Ben-Akiva. I have learnt a lot from Prof. Ben-Akiva, both academic and otherwise, and I consider myself lucky to have had the opportunity to work under his guidance. It has been a wonderful growing experience for me.
Thanks to Prof. Charisma Choudhury, for guiding me through my initial research at the ITS Lab.
This research was funded by Singapore-MIT Alliance for Research and Technology (SMART). I would like to acknowledge Future Urban Mobility -Interdisciplinary Research Group (FM-IRG) for lending support to the research; as well as all the PIs involved directly or indirectly in the development of SimMobility, for showing interest in this research. Thanks to Em-manouil for acquiring and sharing the data for Bugis network.
I want to thank my fellow lab-mate, Marty Milkovits for all the help and support during my stay in the ITS Lab. His constant feedback and constructive criticism of my work has been a key motivating factor in the whole process.
I am extremely thankful to all of my friends from the ITS Lab for making this stay a memorable one. Thanks to Li for her help on Linux and MITSIMLab. Thanks to Carlos for his input on the GIS shape-files. I want to acknowledge other members of the lab for their constant support and moments of laughter: Angelo, Varun, both Joao's, Peter, Eric and Sujith. Thanks to Katie for organising things and making the lab a lively place. Thanks to all of my friends from MST; especially Paul and Kari for always being great friends and introducing me to the American way of life.
Thanks to all of my Indian friends for making the moments away from home and family, ones to cherish; especially Nihit for his friendship and support, and Arun for being such a great room-mate over the last two years.
Above all, I want to thank my family: my parents, Sunita and Shankar for their unending love and faith in me. I dedicate this work to my brother, Amol who has been instrumental in my academic growth and has always been the caring figure.
Contents
1 Introduction 1.1 V2V Communication ... 1.1.1 Technology . . . . 1.1.2 Application ... 1.1.2.1 Potential Applications . 1.1.2.2 IntelliDrive . . . . 1.1.2.3 Non-Safety Applications: 1.2 Simulation approach . . . .1.3 Future Urban Mobility Project . . . . .
1.4 Objectives . . . .
1.5 Thesis Outline . . . .
2 Literature Review
2.1 Applications . . . . 2.2 Need for simulation approach . . . . 2.2.1 ParkNet . . . . 2.2.2 En route connectivity . . . .
2.3 Simulation approach . . . . 2.3.1 Wireless network simulation . . .
2.3.2 Traffic network simulation . . . .
2.3.3 Integrated simulation approach . 2.3.4 Conclusion . . . . 2.4 Summary . . . .
3 Methodology
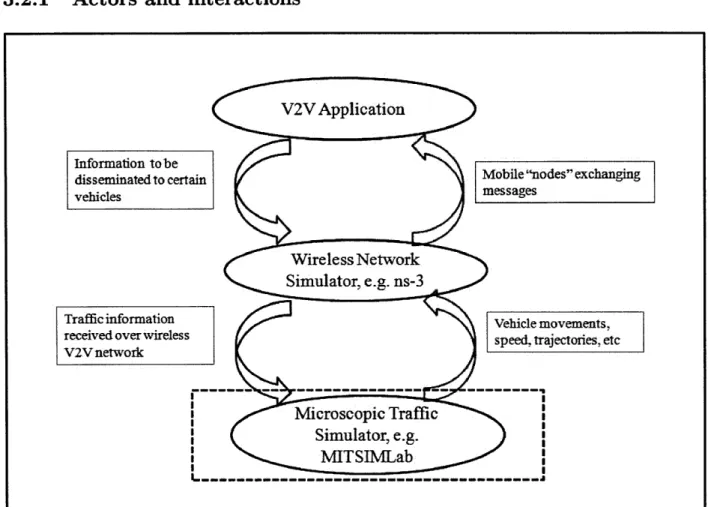
3.1 Requirements . . . . 3.2 Framework Design . . . . 3.2.1 Actors and interactions . . . .
3.2.2 Driving Response
3.3 Implementation . . . . . 3.3.1 Traffic Simulator
3.3.2 Data needs . . . 3.4 Summary . . . .
4 Case Study: Bugis Road Network, Singapore 4.1 Green light prediction application ...
4.1.1 Goal of the application . . . . 4.1.2 Data collection and prediction . . . . 4.2 Modelling framework for the green light prediction 4.2.1 Driving Response . . . . 4.3 Application of the framework in a Case Study . . 4.3.1 Dataset Description . . . . 4.3.1.1 Study Area . . . . 4.3.1.2 Dataset Overview . . . . 4.3.2 Aggregate Calibration . . . . 4.3.3 Base-line Scenario. . . . . 4.3.4 Scenario Analysis . . . . 4.3.4.1 Average Speed . . . . 4.3.4.2 Travel Time . . . . 4.3.4.3 Halts . . . . 4.4 Summary . . . . application 5 Conclusion 5.1 Thesis Summary . . . . 5.2 Contribution. . . . . 5.3 Future Directions for Research . . . .
Bibliography
A MITSIMLab: Micro-scopic Traffic Simulation Laboratory
A.1 MITSIMLab . . . . A.1.1 Traffic Flow Simulator (MITSIM): . . . . A.1.2 Traffic Management Simulator (TMS): . . . . A.1.3 Graphical User Interface (GUI): . . . .
87 93 93 94 95 96
B Aggregate Calibration Framework 97
B.1 Calibration Framework ... 97
B.1.1 Problem Formulation ... 98
B.2 Goodness of fit measures ... 100
C Communication Technologies 101
List of Figures
1.1 2004 US Crash statistics classified by manner of collision . . . .
2.1 Ultrasonic sensor fitted on the side of a car detects parked cars and vacant spaces . . . .
2.2 Sketch of communication between a car and a sensor belt in tecture ...
2.3 Simple incident message propagation scenario . . . .
2.4 Coupling of network and traffic simulator . . . .
3.1 3.2 3.3 4.1 4.2 4.3 4.4 4.5 4.6 4.7 4.8 4.9 4.10 4.11 4.12 4.13 4.14 NOTICE archi-. archi-. archi-. archi-. archi-. archi-. archi-. archi-. archi-. archi-. 30 . . . . 32 . . . . 35
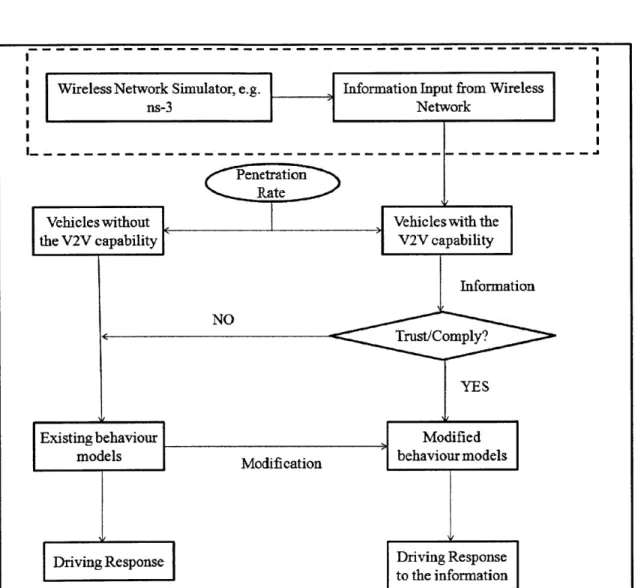
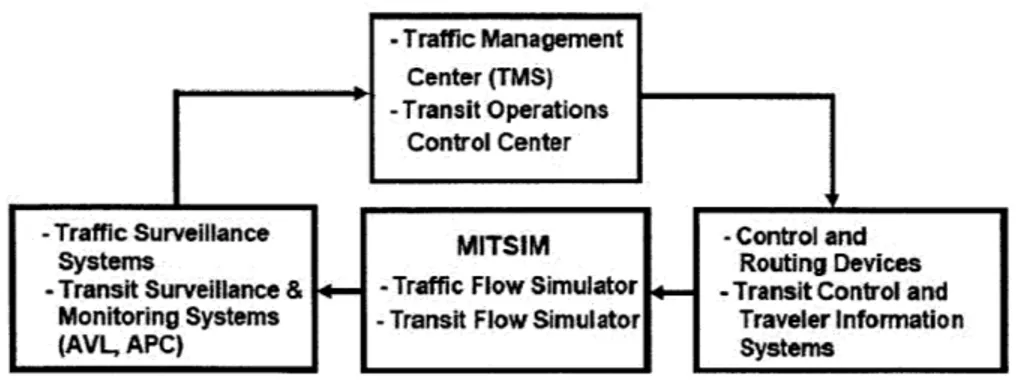
Driver - Wireless Network interaction . . . . Modelling Framework . . . . MITSIM-Traffic Management System Integration . . . . .
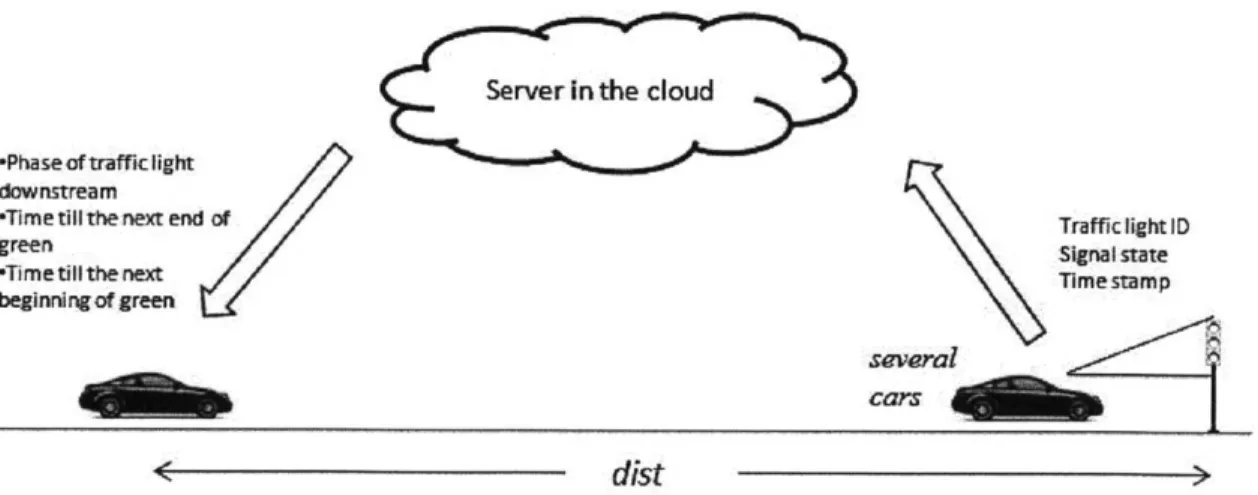
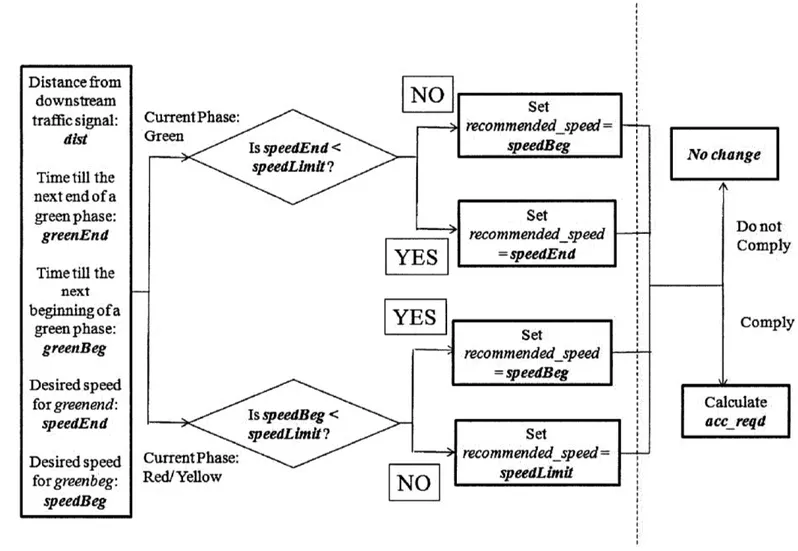
Schematic of green light prediction . . . . Lane change by the V2V enabled driver to pass the myopic driver . . . . Driver response to green light prediction flow-chart . . . . Bugis Network . . . . Location of loop detectors on the Bugis Network . . . . Average Speed across penetration rates over different travel demand levels . Average Speed across travel demand levels over different penetration rates . Average speed across different penetration rates at 25% compliance rate . . .
Average speed across different penetration rates at 50% compliance rate . . .
Average speed across different penetration rates at 75% compliance rate . . .
Average travel time across penetration rates at existing travel demand level Average travel time across compliance rates at existing travel demand level Percentage change in average number of halts per trip across penetration rates Percentage change in average number of halts per trip across compliance rates
List of Tables
4.1 Statistics of Count Data . . . . 61
4.2 Calibration Results . . . . 62
4.3 Validation Results - Measures of effectiveness for counts . . . . 63
4.4 Network performance across different penetration rates at One-third of exist-ing travel demand . . . . 65
4.5 Network performance across different penetration rates at Two-third of ex-isting travel demand . . . . 66
4.6 Network performance across different penetration rates at existing travel
de-mand... ... ... 66
4.7 Network performance across different penetration rates at Maximum travel dem and . . . . 67
4.8 Network performance across different penetration rates at 25% compliance rate 71 4.9 Network performance across different penetration rates at 50% compliance rate 72 4.10 Network performance across different penetration rates at 75% compliance rate 73 4.11 Average number of halts per trip across penetration rates . . . . 76
4.12 Average number of halts per trip across compliance rates . . . . 77
Chapter 1
Introduction
Traffic congestion is a source of significant economic and social costs in urban areas. Ac-cording to the Urban Mobility Report developed by the Texas Transportation Institute in
2007 (Schrank and Lomax, 2007), the costs of congestion (realised as prolonged travel time
and wasted fuel) in leading US cities has been steadily increasing. In 2007, an estimated amount of 4.2 billion hours and 2.9 billion gallons of fuel were wasted in the US due to traffic congestion.
Intelligent Transportation Systems (ITS) combine advances in information systems, com-munications, sensors, and advanced modelling and algorithms to improve the performance of surface transportation. For years ITS have been successful in addressing transportation problems and improving traffic performance. In the past, ITS applications were limited to deployment of fixed infrastructure based technology such as Variable Message Signs (VMS) which disseminate useful information or traffic guidance and automatic toll collections like Electronic Road Pricing (ERP) in Singapore (Tuan Seik, 2000). Research in wireless com-munications has opened a new area of ITS application by making communication between vehicles (Vehicle-to-Vehicle/V2V) possible which supports data collection and information dissemination at individual vehicle level. To model the impact of V2V communication based applications, a microscopic traffic simulation model is necessary.
Microscopic traffic simulators have been used as evaluation and planning tools for policies and initiatives to improve traffic performance (Barcelo, 2010). These simulators include driving behaviour models that represent interactions between vehicles by simulating driving decisions by individual drivers. These behaviour models are sensitive to information pro-vided by fixed infrastructure based ITS applications like VMS and Variable Speed Limit Signs (VSLS). However, ITS applications enabled by wireless V2V communication can
pro-vide important traffic information to vehicles irrespective of the location of VMS or VSLS. To analyse the effects of these applications, the underlying driving behaviour models need to be modified. This thesis presents a modelling framework for behavioural models that are sensitive to V2V communication based ITS applications.
The next section provides an overview of V2V communication and examples of applications, followed by a summary of our microsimulation framework. Finally the funding project Future Urban Mobility (FM) is described and the objectives and organisation of this thesis are presented.
1.1
V2V Communication
V2V communication, also referred to as inter-vehicle communication, is a communications technology that allows the vehicles on a network to "talk" to each other. The technology was first developed and successfully demonstrated for safety purposes by General Motors in
2005 (AutomotiveWorld.com, 2005).
1.1.1
Technology
Communication is established through Dedicated Short Range Services (DSRC) devices (ITS Standards Advisory, 2003) installed on individual vehicles which allows high-speed communications between vehicles and infrastructure. In October 1999, the Federal Com-munication Committee granted the use of 5.9 GHz frequency with a 75 MHz wide spectrum for DSRC with a stipulation for priority to public safety uses (Research and Innovative Technology Administration, 2003). DSRC devices have a range up to 1000 metres and af-ter accounting for various obstacles in the message transmission, the wireless connectivity range can be around 300 metres (ITS Standards Advisory, 2003). Thus communication over DSRC enables vehicles to exchange data with other vehicles that are out of the visibility distance and even line of sight. Vehicles can even "relay" the messages onwards to form a multihop network where the connectivity range can go well beyond the radio range.
1.1.2
Application
The goal of the wireless network of participating vehicles to increase traffic safety is well summarised by the vision for V2V as stated by Research and Innovative Technology Ad-ministration (RITA, 2011):
* "Eventually, each vehicle on the roadway will be able to communicate with other vehi-cles and that this rich set of data and communications will support a new generation of active safety applications and safety systems."
Vehicle collectively scout a large area of a road network while making their trips to respec-tive destinations. With robust and reliable sensing technology, individual vehicles can be used as data collectors. This level of physical penetration of the network is not offered by other surveillance technologies which rely on fixed infrastructure. Hence a higher level of data collection and sharing can be achieved by enabling wireless connectivity among mov-ing vehicles. This rich set of data and communications can also be leveraged to realise informational (non-safety) applications.
Information disseminated over the wireless network connecting vehicles via wireless V2V communication can include valuable information about road congestion, physical condition of the road, facility locations, etc. As a result, users on this wireless network can poten-tially have information about a broader area of road network. This information could have significant effects on driving decisions and improve capacity of the network.
1.1.2.1 Potential Applications
Figure 1.1: 2004 US Crash statistics classified by manner of collision Source: Carter et al. (2009)
The importance of V2V communication can be accentuated with the help of the crash statistics depicted in Figure 1.1. It gives the distribution of the 6.2 million crashes reported in 2004 via NHTSA's General Estimate System (GES). Data for GES is comes from na-tionally representative sample of police reported motor vehicle crashes (National Highway Traffic Safety Administration, 2011). V2V communication combined with GPS enables a
360 degree field of view which covers the "blind spots" in the limited field of view of
con-ventional radars which only cover head-on and angle crashes. Rear-end, head-on, angle and side-swipe collisions, all are relevant to V2V communication amounting to a total of 66% of annual crashes. Thus, V2V applications can prevent a larger share of accidents amounting to about 4 million crashes annually. Initially, V2V communication was implemented primar-ily for safety applications (AutomotiveWorld.com, 2005); e.g., the VSC-A project (Carter et al. 2009) developed interoperable crash avoidance applications. Hence the use of V2V in the traffic safety application is of extreme importance as realised by the automobile manu-facturers. Because of its immense potential to increase traffic safety, there has been a great government interest in V2V communication (Shulman and Deering, 2007). IntelliDrive is an initiative from US DOT to leverage V2V communication for traffic safety (RITA, 2010). 1.1.2.2 IntelliDrive
IntelliDrive is a US Department of Transportation (US DOT) initiative which enables safe, interoperable networked wireless communications among vehicles, the infrastructure, and passenger's personal communication devices in an attempt to make surface transportation safer, smarter and greener. The IntelliDrive approach can increase the efficiency of the road-way systems and provide economic and environmental benefits. The IntelliDrive system will combine technology solutions - advanced roadside infrastructure, wireless communications, advanced vehicle sensors, onboard computer processing, and GPS navigation - to provide vehicles the capability to detect threats and hazards on the roadway and to communicate this to the driver through alerts and warnings.
1.1.2.3 Non-Safety Applications: Green Light Prediction
The potential applications of V2V communication also go beyond safety purposes. For example, SignalGuru (Koukoumidis, Peh and Martonosi; 2011) is a software service that uses a collection of mobile phones mounted on the wind-shields of vehicles to detect traffic signals with the cameras, collaboratively communicate and learn traffic signal schedule pat-terns to predict their future schedule. The application was tested only on 5 vehicles mounted with iPhones carrying SignalGuru application, travelling around three intersections in
Cam-bridge, MA. Using SignalGuru to generate Green Light Optimal Speed Advisories showed fuel consumption savings of 20.3%. A larger scale experimentation of this application has not been carried out. To predict the impact of such an application on traffic performance would require running various hypothetical scenarios on a simulation framework.
1.2
Simulation approach
As we have seen above there are several opportunities to exploit this technology to mitigate traffic problems. Since these applications are relatively new and their experimental deploy-ment in the field is costly, traffic simulation offers a practical way to evaluate the efficiency and the impact of these technologies. These applications need to be tested under different scenarios varying across penetration rates, reliability of technology, etc. for a comparative study of their practicality and benefits.
In case of the deployment of V2V communication, there are two distinctly different systems interacting with each other:
e The wireless network system comprising mobile nodes capable of telecasting signals
over a wireless network and;
a The transportation network system comprising drivers interacting with each other and
the infrastructure to arrive at desired destination.
Since this technology involves smarter vehicles with communication capabilities, the best approach would be to simulate the traffic flow and the wireless connectivity at the same time. These two systems can be modelled separately in a simulation environment. The wireless network simulators use wave propagation and interference models to compute the strength and range of the signal transmitted, whereas traffic simulators use behaviour models to predict vehicle movements. Hence to model V2V communications completely, it is beneficial to couple these simulators together in a closed feedback loop.
In this coupling scenario, the traffic simulator can receive the state of the wireless network in terms of the wireless connectivity and data transfer taking place between the vehicle. To make the driving behaviour models sensitive to the V2V communication technology, we need to incorporate this dynamic information exchange in our modelling framework. Thus we modify the behavioural models to reflect the changes brought about by the conveyed information.
The use of microscopic traffic simulators as evaluation and planning tools has been well established by a number of case studies (Ben-Akiva et al., 2003; Choudhury et al., 2011). Microscopic traffic simulators provide the ability to model driving behaviour and the inter-action between the vehicles at the level of granularity of individual vehicles and individual lanes. One of the approaches to driving behaviour models is based on frameworks that incorporate different stages of decision-making (Choudhury, 2007). In this model, driving behaviour of the user is viewed as a combination of his/her own intentions and his/her response to the surroundings based on the perceived information.
In this thesis, we focus on the traffic simulation side of this integrated simulation approach. We extend behaviour models that take into account ITS applications deployed as fixed infrastructure, to make them sensitive to these new technologies. The improved model can be linked to a wireless simulator to achieve the desired integration of the simulators.
1.3
Future Urban Mobility Project
This research is conducted as a part of the Future Urban Mobility (FM-IRG) project (Ben-Akiva, 2010). It is an inter-disciplinary research project funded by National Research Foun-dation (NRF), Singapore. The goal of the FM-IRG is to develop, in and beyond Singapore, a new paradigm for the planning, design and operation of future urban mobility systems. The basic premise of FM-IRG is that the advances in computing, communications and sensing technologies give us powerful capabilities to model, evaluate and optimise urban mobility systems.
One of the goals of this project is to leverage the devices on pedestrians, cars, roads, etc. to build a network of computation devices to enable better traffic control. These devices are excellent potential wireless nodes that can track the mobility of their user. The connection of all these devices over the wireless network forms a mesh network of mobile data collec-tion/dissemination nodes over the road network. The connectivity of these devices can be extended to a server in the cloud via the internet to achieve real-time data exchange among the peers partaking in this mesh network of vehicles. The result is accessibility to a very large pool of data and its real-time dissemination. One of these applications will be used to test our modelling framework in a case study.
1.4
Objectives
Here we define our objectives for this thesis:
e Develop a modelling framework that is sensitive to changes brought to ITS by the use
of wireless communication technology based V2V applications.
a Use this framework to model an application based on wireless V2V communication
and test for its effect on traffic performance.
e Develop behaviour models in a traffic simulator in order to extend to implement the
integration of a wireless and a network simulator in the future.
a Demonstrate the use of micro-simulation models to assess V2V communication based
applications.
1.5
Thesis Outline
This thesis is organised in five chapters including this introductory chapter. Chapter 2 covers a literature review of the existing V2V applications and the approaches to analyse their impact with the help of microscopic traffic simulation, in some cases along with wireless network simulation. The various methodologies used to quantify the impacts are detailed. In Chapter 3 we describe the conceptual framework and model structure. The modelling framework is generalised to be expanded into an integration approach in the future.
Chapter 4 presents a case study on the Bugis road network in Singapore. In this chapter, we test the modelling framework using a green light prediction application as an example of the V2V communication based technology.
Chapter 2
Literature Review
There has been a recent surge in research activity in the area of V2V communication and its applications in ITS for safety (Gallagher et al., 2006), route guidance (Weis and Sandweg,
2010), energy efficiency (Tsugawa and Kato, 2010), etc . Several different aspects of the use
of DSRC technology to establish vehicular ad-hoc networks (VANET) have been explored in the previous work (Yin et al., 2004; Torrent-Moreno et al., 2004). The literature on the interaction of wireless network with transportation systems needs to be reviewed to under-stand state-of-the-art practices and gain insights on the potential of the V2V technology to improve the performance of traffic systems. It is important to understand its applications and possible approaches to assess their impact with a simulation platform. The literature review of these aspects is necessary to understand how the behavioural models need to be changed to make them sensitive to these changes in the technologies deployed in ITS. The impact of V2V technology on traffic performance depends on the changes in driving experience in response to these technologies. The first step to understand this change is to understand the type and value of information provided to the user. This accuracy and reliability of information provided to the user via V2V communication depends on the deployed technology and the connectivity over the wireless network among the users. The information conveyed over the V2V communication can contain any data that can be collected/processed by other vehicles on the wireless network. This information can be leveraged to build a variety of ITS applications addressing different traffic problems. Hence the potential applications of V2V technology can affect the driving behaviour in different ways.
To assess the effect of V2V communication based ITS applications on traffic performance, we can create a physical experimental setup on a test-bed or conduct the same comparative
analysis on a simulation platform tool. The selection of the approach depends on trade-offs between the cost of experimentation and the extent of interactions captured.
In order to gain sufficient depth and clarity in the dynamics of this problem, we need to:
e Gain brief understanding of types of V2V applications and their inputs to the
trans-portation system;
e Review physical experimental setups to justify a simulation approach and
a Review simulation studies to gain understanding of the various approaches used for
the assessment of these applications.
In this chapter, we first briefly give an account of different types of applications of V2V communication. Later we present a review of different studies about the assessment of these applications. We begin with a few examples of physical experimentation studies followed by different approaches to model the wireless networks over a traffic network on a simulation platform. We develop the section further by detailing some of the integration approaches used for analysing such systems. We conclude the chapter by drawing motivation from previous works to identify areas to improve and to build our own methodology framework for the assessment of the technology.
2.1
Applications
The applications of V2V communication can be broadly categorised as follows:
a Safety related: collision avoidance, cooperative merging, etc.
9 Incident report: dissemination of data regarding accidents on the network or
break-down/ blockage of a link, etc.
e Route Guidance: en-route guidance about the shortest path, route guidance for gas
stations, etc.
Safety related applications are among the first to be implemented using V2V communica-tion technology. The basic applicacommunica-tions typically include crash-avoidance and co-operative driving systems. Incident report and route guidance applications (Thiagarajan et al., 2009) disseminate information that is directly relevant to the driver and his/her immediate de-cision making process. Miscellaneous applications try to mitigate the problems that affect the traffic conditions in more indirect way; e.g., finding parking space is a major concern in urban areas. ParkNet (Mathur et al., 2010) is one such drive-by sensing technology that has been tested using physical experimentation. In fact research (Shoup, 2007) points out that the driver spends a significant amount of travel time at the end of the trip in an effort to find a parking space. The effects of this additional travel time are conspicuously visible in congested metropolitan areas such as New York City.
The impact assessment for these different types of applications can be done either by di-rect physical experimentation or simulation studies. In the simulation studies, the wireless network and the traffic system would be required to be modelled together in an integrated approach. In the following section we discuss the need for the simulation approach with the help of an example of physical experimentation. In the later sections we look into the litera-ture about simulation approaches to gain any insights in the assessment of V2V technology and its applications.
2.2
Need for simulation approach
The utilisation of wireless communication technology goes beyond the safety measures that triggered the conceptualisation of V2V connectivity in the first place. ParkNet is one such example of addressing non-safety problems of transportation systems by using vehicles as mobile sensors. Other applications also support the view that vehicular wireless networks can be used to collect and disseminate critical traffic data to users. Physical experimentation is the direct way of assessing the performance of any technology. It involves deploying the technology in a controlled or uncontrolled environment; and observing a set of measures of performance reflecting the impact of the concerned technology. A large scale deployment of any new technology for experimental purposes comes with high costs in terms of money, time and efforts. Hence costs of the whole experiment needs to be justified by the depth of the insights gained by physical experimentation.
2.2.1
ParkNet
1- SenSor car driing by
Vacant
spot
Parked car Parked car
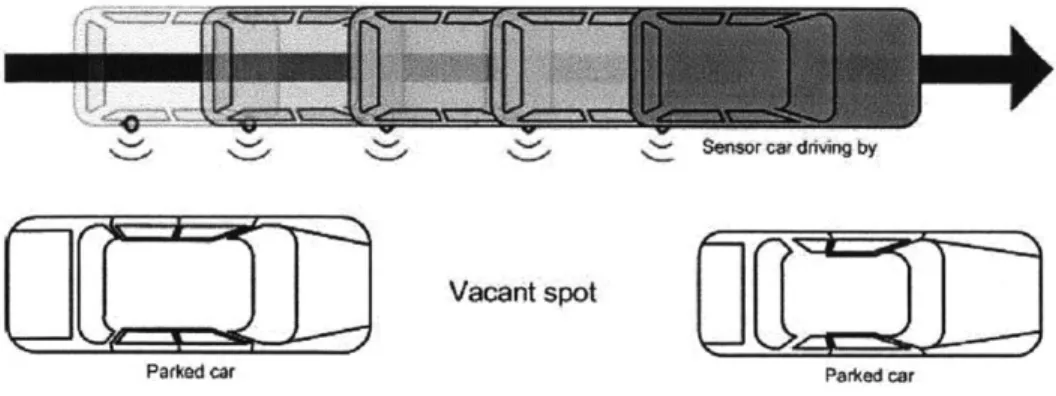
Figure 2.1: Ultrasonic sensor fitted on the side of a car detects parked cars and vacant spaces
Source: Mathur et al. (2010)
Mathur et al. (2010) describe a physical experimentation study to test ParkNet, a drive-by sensing technology to collect road-side parking statistics. The key idea of ParkNet is to leverage the mobility of vehicles that regularly comb a city, such as taxicabs. In the absence of ParkNet this service would be provided by more expensive fixed sensor infrastructure. The goal of ParkNet architecture is to reduce the number of sensors needed to offer this service. Each ParkNet vehicle is equipped with a GPS receiver and a passenger-side facing ultrasonic rangefinder to determine parking spot occupancy (Figure 2.1). The data is aggregated at a central server, which builds a real-time map of parking availability.
A physical experiment was conducted to assess the practicality of this application. About 500 miles of road-side parking data was collected by the taxicabs over a period of two
months and matched against the observed parking data to check for accuracy of the parking space reporting. The accuracy of the GPS technology was found to be 95% in terms of the parking spots counts accuracy and 90% in terms of occupancy maps accuracy. The study also quantifies the amount of sensors required to provide adequate coverage in a city. The results show that ParkNet technology deployed on city taxicabs can provide adequate coverage and are more cost-effective by a factor of 10-15 as compared to a network with a dedicated sensor at every parking space. The technology restrictions limited this application only to single lane roads and some issues with power sources were also reported.
This study shows the feasibility of developing a technology to use individual vehicles as sensors and leverage the mobility of the participants that continuously traverse an area to build and maintain a database of a network. The big contribution of this study was proving the effectiveness and sufficiency of the regular fleet of taxicabs to generate a vehicle mobility based service in terms of the parking spots maps. Also the study observed certain drawbacks of the infrastructure which otherwise possibly would not have been detected on a simulation model. But the approach suffers from the drawbacks of a physical experimentation. The experiment had to be carried out in the field which is costly and may not be possible for every application. A simulation study perhaps, can be used to perform the same analysis over a broader range of scenarios.
2.2.2 En route connectivity
A similar approach to leverage existing infrastructure for en route connectivity of vehicles
was presented in Bychkovsky et al. (2006). The authors discussed the practicality aspects of an unplanned in situ 802.11 (Wi-Fi) network service to provide reasonable performance to network clients moving in cars at vehicular speeds. The goal was to "open up" Wi-Fi Access Points (AP) in the vicinity of the route and leverage this connectivity to upload data to the cloud. This approach extends the wireless connectivity from inter-vehicle domain to the internet.
The study evaluates expected performance of these open Wi-Fi networks for users moving in automobiles. A measurement study was conducted in and around the Boston metropolitan area using several cars which logged a total of 290 "drive-hours" collected over 232 different days over a year. Nine cars, each out-fitted with a cell-phone embedded computer running the CarTel system software (Hull et al., 2006), collected data about Wi-Fi networks during the course of their driving. During the course of test run, cars were able to successfully associate with APs and transfer data at all speeds between 0 to 60 km/hr. The APs appeared in clusters and the mean inter-arrival duration for these clusters was found to be about 75 seconds. However frequent power disruptions and flash failures that corrupted the file-system and extremely time consuming data analysis were observed to be the two biggest challenges. The median AP coverage was found to be 96 metres with top 10 percentile having a coverage more than 300 metres. Uni-directional delivery rate of packets was about 90%. Overall the study was able to establish the promise of in situ wireless connections to upload the data over the internet.
Based on the observations of this experiment, authors were able to suggest some policies to give incentives to users and service providers to open their APs in order to exploit this connectivity in metropolitan areas. Such open Wi-Fi networks can be leveraged for a variety of vehicular applications that can tolerate some intermittent connectivity. The en
route connectivity if achieved can become the basis of several other ITS applications. The experimentation was also successful in obtaining the critical parameter values to appraise the scope for "open Wi-Fi networks" in the future. The approach however was limited to only nine cars which is a typical restriction of physical experimentation. Transferring the setup to a simulation model can help run the scenarios with more realistic number of cars accessing the CarTel system software.
In these applications technology evaluation was conducted by actual physical experiments. To summarise:
e The use of the existing infrastructure in conjunction with the mobile computing
de-vices carried by the users on the road was shown to be capable of sustaining the dissemination of key information and making it accessible to participating users.
e Also the experimentation was able to observe certain technical difficulties in the
in-frastructure which otherwise may not be detected on a simulation platform.
a However the costs involved in conducting these experiments motivate the need for the
simulation studies.
In the next section we look at some simulation approaches to analyse the feasibility and the benefits of such systems.
2.3
Simulation approach
In almost all the V2V applications, deploying a prototype and analysing its effects is imprac-tical because of the relatively high costs involved. A realistic penetration rate of technology to carry out experiments is not feasible to achieve in real life unless technology requires only a very simple modification to existing infrastructure. Hence simulation is a better way of assessing a modern technology like V2V communication. To evaluate their impact, traffic simulations based on an agent-based architecture that also take into account the communication between vehicles are needed (Fernandes and Nunes, 2008).
In the following sub-sections, we look into various studies that used simulation approach to model the wireless network and the traffic network separately followed by studies focussing on integrated approach.
2.3.1
Wireless network simulation
ElBatt et al. (2006) tested the suitability of DSRC for Cooperative Collision Warning (CCW) using simulation of wireless network. CCW is a class of vehicular safety applications where vehicles periodically broadcast short messages for the purposes of driver situational awareness and warning. The Forward Collision Warning (FCW) application was modelled using the QualNet (Scalable Network Technologies, 2011) as the simulation tool. QualNet is a simulation tool that contains detailed 802.lla radio and channel models, including widely accepted models for wireless propagation and interference. In FCW it was assumed that each vehicle carries some type of localisation device like GPS in addition to a wireless communication device using DSRC. Each vehicle periodically broadcasts the information regarding its current status like location, velocity, etc. The neighbouring vehicles which receive this information calculate the likelihood of collision based on their own status. The simulation runs were performed to assess the performance of the application in extreme vehicle densities and to explore potential broadcast enhancement techniques. The approach uses QualNet which applies widely accepted wireless propagation models, but the models governing the vehicle movements in the simulation run are not very clear.
Conceicao et al. (2008) used an integrated approach to simulate large scale V2V environ-ments. The study makes use of a simulation prototype named DIVERT set up over road network of the city of Porto. It uses shortest path algorithm to generate random or pre-defined routes. To capture the inter-vehicle communication, a very simple broadcasting model, in which vehicles within certain threshold (determined by the transmission radius) are able to communicate with each other is used. Every "sensor" vehicle in the traffic simu-lation generates GPS-like messages with its position and speed. The communication layer in the wireless network simulator transmits this data package according to an algorithm to other vehicles within the threshold. The simulation runs had 5000 vehicles with 10% pen-etration rate of the inter-vehicle communication technology. To implement mobility based navigation, vehicles should have a good knowledge of traffic conditions at a given instant. Hence, the mobility propagation was used as the metric to test over a spectrum of conser-vative transmission ranges. With this approach, the authors were able to generate a map of segments about which more than 50% of the sensor vehicles had traffic information that
was fresher than the last 5 minutes. Though the study provides a good way of measuring the spread of traffic conditions across a large V2V network, it suffers from drawbacks on the traffic modelling side. The traffic simulator accounts for only the longitudinal motion. The approach can be improved by integrating the network simulator with a better traffic simulation model. Also the simplistic propagation model can be extended to include more rigorous models.
2.3.2
Traffic network simulation
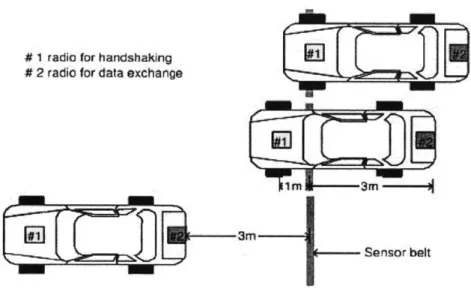
# I radio for handshaking # 2 radio for data exchange
Sensor belt
Figure 2.2: Sketch of communication between a car and a sensor belt in NOTICE architec-ture
Source: Rawat et al. (2008)
The wireless network side of the problem is addressed in the above studies. On the other hand, traffic simulation studies also have been used to assess the performance of inter-vehicle communication. Chiara et al. (2008) defined a Risk Index (RI) to assess the effects of inter-vehicle communication systems in terms of the risk of longitudinal collisions for vehicles. Aim-sun was used as the traffic simulator platform to analyse a hypothetical highway scenario where a vehicle suddenly brakes down. The RI values with the inter-vehicle communication showed significant improvement in the safety with respect to the current scenario without the technology. However the study is limited to single lane scenario and the improvements shown might be a little too idealistic.
Rawat et al. (2008) describe the NOTICE architecture for vehicular communications and use a traffic simulation approach to test the challenges in its implementation. NOTICE is a new concept in VANET that aims at providing automated notification of traffic inci-dents on the highways in order to reduce congestion and improve overall traffic safety. In V2V communication, vehicles are responsible for forwarding and exchanging information to fellow participants. This makes the system vulnerable to attacks from malevolent traffic participants. Hence to address these issues, in NOTICE architecture the communication takes place through a system of sensor belts embedded in the roadway (Figure 2.2) that collect information and provide driver notification in case of highway incidents.
A traffic simulator based on Intelligent Driver Model (IDM) (Abuelela et al., 2008) was used
to evaluate the NOTICE architecture. The incident detection time was used as the metric to test the efficiency of architecture. The simulation analysis showed a U-shaped trend in detection time with respect to density whereas the incident detection time was shown to increase as distance between belts increases. The simulation was useful in identifying possible belt and traffic densities for a practical implementation of NOTICE architecture. This study provides a good example of investigating a proposed architecture using the traffic simulation approach.
Yeo et al. (2010) analysed the impact of V2V communication systems on traffic operations. The modelling of driving behaviour with V2V communication hazard alert system in incident situations on freeways was carried out for a range of traffic operations conditions. The NGSIM freeway flow algorithm was used to simulate the driving behaviour. This algorithm is an integrated car-following and lane changing model which also explicitly models "short gap" where drivers accept very small gaps in the target lane. Lane changing manoeuvres were classified as mandatory or discretionary depending on the situation.
To model the driver response to an incident, a blockage is introduced in one lane of a four-lane homogeneous freeway section. In a lane specific scenario, the vehicle involved in the incident sends a warning message with the location, time and lane of the incident. This message is relayed upstream by equipped vehicles within certain communication range R (Figure 2.3). Vehicles equipped with V2V receive the information about the incident wherever they are on the freeway. Drivers of unequipped vehicle have no information about the incident until it comes within their visibility distance. All warned drivers are assumed to be identical in their response to the warning message. Due to lower expected downstream speeds, larger gaps and slower speeds are generated.
Figure 2.3: Simple incident message propagation scenario Source: Yeo et al. (2010)
This is factored in the car-following model by modifying the safety constraint. The fol-lowing deceleration rate is applied instead of the maximum acceleration rate: aL(E)
max(aL, aL(7 + 611 - linc|)
where y, 6 = constants less than 1,
1 = current lane, and linc= incident-blocked lane
aL= maximum deceleration rate of vehicle n (< 0)
The calculated deceleration rate for the equipped vehicle assumes a reduction in normal de-celeration rate (6) reflecting better safety constraints. When an equipped vehicle approaches within a distance En from the incident location it will start lane changing manoeuvre. It was assumed that the drivers can scan 50 metre ahead of all lanes and pick the fastest lane as the target lane. In the non-lane specific case, equipped drivers do not know whether they are travelling on a blocked lane. A 20% reduction in free flow speed in assumed because of the uncertainty about downstream conditions. It was observed that a higher flow can be sustained by increasing the market penetration of the equipped vehicles. Also larger com-munication range R meant larger space over which equipped vehicles could make mandatory lane changes. This approach provides a good example of modifying the driving behaviour to take into account the change in response to incident detection. However the selection of the chosen values of -y, En and 6 can be questioned.
Wang et al. (2007) explored the benefit of applying simple traffic control strategy at a merging section in the presence of V2V connectivity. The goal was to promote collision free ways of effective "proactive" merging for improved throughput. The methodology involved dissociating the point of merging and point of decision making. Proactive action on the part of driver leads to more efficient merging manoeuvres. This merging strategy leverages the information communicated via the V2V technology at the decision point to compute a proper gap to prepare for merging. The information received includes the position, velocity and acceleration of competing vehicles. Along the approach to the merging point the vehicle adjusts its velocity to prepare for actual merging. A microscopic simulator IDM was used to test this strategy against the priority based, non-proactive merging strategy. The simulation results show a reduced delay in proactive merging to about only a third of the delay in the priority merging strategy. Also the throughput in proactive merging strategy is observed to be higher.
The studies mentioned in this sub-section show the importance of modifying the driving behaviour models to take into account change in the information provided to driver. The simulation approaches were able to model the changes in traffic flow while making certain assumptions about the wireless communication.
2.3.3
Integrated simulation approach
The simulation approach can be extended to include traffic flow side of the problem by coupling together wireless network simulator and traffic simulator. An integration between a wireless network simulator with wireless propagation and interference models and a traffic simulator with vehicle movement models is a more complete way to address the problem.
Kim and Fujimoto (2009) presented a traffic simulation study to explore the effect of an ATIS architecture using wireless communications. The ATIS application under considera-tion was Dynamic Route Guidance System (DRGS) which attempts to search for the most cost effective route for a participating vehicle. An integration approach using an off-the-shelf microscopic simulation model with a Vehicle Communication Module (VCM) was used. A simple VISSIM traffic network is utilised across different demands and penetration ratios of enabled vehicles to evaluate travel time savings of participating vehicles. A simple incident is generated to trigger the DRGS which helps participating drivers to choose better routes. Some delay was observed between the incident start and the instant when it starts affect-ing the travel time estimates by the DRGS. As expected the travel time savaffect-ings show an
increasing trend as the penetration ratio increases. The integration approach covers both sides of the problem. However the system suffers from some modelling drawbacks. E.g. the participating vehicles did not opt for the incident hit link even after the incident was removed. The travel time estimates are updated by the data collected by probing vehicles. When the vehicles are diverted away from the incident hit link, there is no further data collected regarding that link. Thus the DRGS does not redistribute the traffic even after the incident is removed. A better algorithm for route guidance can improve the impact of the technology in reducing congestion.
Bing Mei et al. (2010) use a simulation approach to test the impact of route guidance information disseminated over VANET on traffic performance. Modelling methodology involved two types of networks: a highway network and wireless VANET. When the two networks are in operation, highway traffic operations data are simultaneously collected, transmitted and analysed by and among vehicles. To model these networks together Aimsun was used as a platform for the integrated model. The programming language Python was used to develop a customised module to interface with Aimsun. Some of the vehicles loaded in the network were assumed to have onboard equipment that can identify the location of other vehicles, collect operations data and communicate with other similarly "equipped vehicles". These vehicles can receive en route traffic information which can help drivers make decisions to improve their travel plans.
An incident was assumed to have occurred if the ratio of the average instant speed to the typical speed on the link fell below 0.5. If an incident was detected, an alarm was triggered which is immediately sent via VANET. All directions, single-hop broadcasting was used for message transmittals to other vehicles within a wireless transmittal range of 250 metres. In other words, if an equipped vehicle is within this range, it receives this message and then can forward it onwards. After the message is received it was checked for relevance to the current vehicle path. If deemed relevant, the message was evaluated for the reliability of the broadcasted traffic information. A reliability index was generated which reflects the significance of each message based on its age, frequency and the degree of atypicality. If this index is greater than a certain threshold, the driver was allowed to act on it. Two types of response types were modelled: dynamic route diversion (DRD) and variable speed limits
(VSL). Normal control is resumed once the incident section is no longer on the vehicle's
Network ~~~~ "~ Traffic
Simtor Communication Communa Si
Sinulator Module Data Modute exchange
Client Server
Figure 2.4: Coupling of network and traffic simulator
A small portion of the city of Victoria, Spain was used as a test bed. Eight different scenarios
including a baseline scenario were tested.
Source: Eichler et al. (2005)
An incident was created on one of the links which takes 15 minutes to clear up. The results showed that most messages can propagate to the maximum range within 7 to 8 seconds. The average number of stops decreased slightly when VSL was deployed. Overall, an increased market penetration of the V2V vehicles in the fleet showed benefits for both appropriate incident response and better utilisation of network capacity. However in some cases, penalis-ing alternative routes with excessive diversions were observed. The key observation to infer from this study is that the impact of this technology depends significantly on two factors: reliability of the information and penetration rate of the technology. These effects need not be intuitive and a simulation case study can provide a useful insight in the effectiveness of technology.
Eichler et al. (2005) analyse the effects of a real-time V2V warning message distribution application on road traffic. This paper presents the work on an integrated simulation en-vironment with three components: Traffic Simulator CARISMA; Network Simulator NS-2; and an incident warning Application. CARISMA randomly chooses a start and destination point for every vehicle on the map and the vehicles choose the shortest path for their travel. It periodically receives the data regarding changes in the vehicle behaviour from the traffic simulator and sends node positions and connectivity patterns back to the network simulator (Figure 2.4).
A total of 900 cars of which 400 cars were equipped with wireless technology were used in
at the beginning of a simulation run and starts periodically sending a warning message. V2V equipped cars have the assistance of route guidance which leads them to other routes, while not warned vehicles still drive through the affected zone and possibly get trapped in congestion. Several simulation runs over different vehicle densities and penetration rates of V2V technology showed significant travel time benefits for V2V enabled cars. The key observation from this study was that the loss of these travel time benefits as the number of informed cars goes up. The broadcast of warning message to a large number of users decreases the benefits from alternative routes.
Klunder et al. (2009) discuss the results of a field operational test to test the effect of adaptive cruise control (ACC) on driving behaviour. ACC is mainly a comfort system that manages car-following while the driver remains responsible for steering and collision avoidance. The study tested the effect of larger penetration rate of ACC on traffic safety, throughput and environment using ITS modeler, a microscopic simulator platform interfaced with Paramics, a traffic simulator. The implemented cooperative driver models specified active gap creation, active gap searching and adaptation to the speed in the left lane. The model also considered the on and off modes of ACC in the cases where the driver desires a different manoeuvre. The simulation setup included scenarios with different penetration rates and continuous or interrupted ACC activity. The results from the study showed sig-nificant impact on the traffic throughput in presence of ACC. The effect was observed to be higher during high congestion. Also the freedom to turn ACC on or off had a nega-tive impact on the throughput while continuous use of ACC showed improvements in the throughput.
2.3.4
Conclusion
The previous studies suggests that an integrated simulation module does a better job of assessing the application of V2V technology by capturing the interactions between the wire-less network and the traffic network than individual simulation modules alone. The wirewire-less network simulator modules used in these case studies follow the established message prop-agation models. However there is room to improve on traffic simulation models in these approaches. In the integration of simulators approach, wireless network simulators are able to simulate the wireless environment based on the technology specifications and vehicle traces. But the driving response is heavily dependent on the content of the information carried by messages. Thus driving response and hence the traffic performance can be ex-pected to follow different trends for different applications. Therefore every application needs
to be classified based on the content of the information carried and should be addressed accordingly in the traffic simulator module. The previous simulation studies show consid-erable variation in the impact of the V2V technology across different penetration rate of the technology. Also the effects vary according to the type and content of the informa-tion disseminated and driver never relies or follows this technology perfectly. Therefore the reliability and compliance to the technology shall be considered in the traffic simulation model.
2.4
Summary
To summarise,
" There is a myriad of different possible applications of V2V technology. The benefits
from the additional information communicated between the users are significant.
" We looked at a few examples of physical experiments that were carried out for the
impact assessment. However the experiments are costly and may not be possible for all the applications.
" Though physical experiments to test the validity of these technologies are not practical,
the simulation methodologies have proved to be a good way to predict the impact of these technologies.
" Integrating the wireless and traffic simulators together is a good way to represent both
sides of the situation.
" Several scenarios across different penetration rates and reliability of the broadcasted
information need to be modelled in the simulation to observe non-intuitive effects the technology might have on the network performance.
" Also the impact of every technology depends on the type and content of the
infor-mation disseminated. A new simulation approach needs to be defined to analyse the impact of a new V2V technology application such as the green light prediction technology on the overall network performance.
" Hence it is essential to modify the behavioural models to make them
sen-sitive to the deployed V2V application.
In the next chapter, we look at the methodology of our approach to analyse the impact of V2V technology on traffic performance.
Chapter 3
Methodology
This chapter presents a general methodology and framework to evaluate the impact of V2V communication technology on overall network performance. It is necessary to address the impact of technology on driving response in the traffic simulator module. The proposed methodology adds a layer to the traffic modelling framework where the effects of V2V based application are translated into behaviour models. The impact can be quantified by several measures like average travel times, number of halts, etc. depending on the application being tested. Section 3.1 describes the requirements of the simulator platform to be used. Section 3.2 presents the actors and the interactions involved and motivates a discussion about how they can be modelled. Later in Section 3.3 we discuss how these requirements can be implemented. We finish the chapter with a brief discussion of how the approach
needs to vary to model any V2V application in the future.
3.1
Requirements
In the previous chapter, we noted that integration of a traffic simulator and wireless net-work simulator is a better way to approach modelling the impact of wireless based V2V technologies on traffic performance. Wireless networks can be simulated over off-the-shelf simulators like ns-3 which utilise widely accepted wave propagation and interference models. The selection of the traffic simulator, however, depends on the requirements of simulation experiments.
e The exchange of messages over wireless network occurs between individual vehicles.
This message exchange over wireless networks is modelled by the wireless network simulator. The underlying models in these simulators take into account the relative position and relative speed of the "mobile" wireless nodes to simulate the data
ex-change. In the case of wireless technology based V2V communication these nodes are the individual vehicles. Hence it is essential for the traffic simulator to keep
track of the movements of the individual vehicles.
" The wireless data exchange is dynamic and has a different impact on the movements of
different vehicles. The dynamic interaction between the vehicles requires modelling of the responses from the driver to the information received. The traffic simulator needs to model the manoeuvres of the driver on the road along with its interactions with other vehicles in the surroundings. Microscopic behaviour models are required
to simulate the driving response at this level.
" The driving response as modelled by the microscopic behaviour models is a
combina-tion of various manoeuvres like acceleracombina-tion/deceleracombina-tion, lane-changing, merging, etc. The road network needs to be represented at the level of individual links, lanes, inter-sections, traffic lights, etc. to accommodate the details of road geometry as required
3.2
Framework Design
3.2.1
Actors and interactions
Figure 3.1: Driver - Wireless Network interaction
To model the impact of V2V technologies on traffic performance correctly, we need to make a clear distinction between the technological aspects of application and the information conveyed to driver. The wireless technology creates the "connections" between vehicles which can be used for data gathering and information dissemination. The content and extent of the information conveyed to the driver is the outcome of this technology and is the component that actually changes the way a driver responds. Hence the change in driving manoeuvres occurs as a response to the information conveyed by the technology (dotted rectangle in Figure 3.1). However the dynamics of data sharing among participating users and how information is disseminated on a larger scale is modelled in a wireless network simulator like ns-3. The traffic modelling part of the simulation is only concerned about the type and content of the information shared.