AUV NILM Update
Robert Cox, Steven Leeb, and TeamWork on the AUV NILM project has proceeded along two main fronts: • NILM System Development
• Diagnostics for Li-Ion Batteries
I. NILM System Development
In January 2009, we installed a NILM system in the Odyssey Class AUV at MIT. The primary components are the following:
• NILM Sensor and Power Board • Computer
• Data Acquisition System • Wireless Adapter
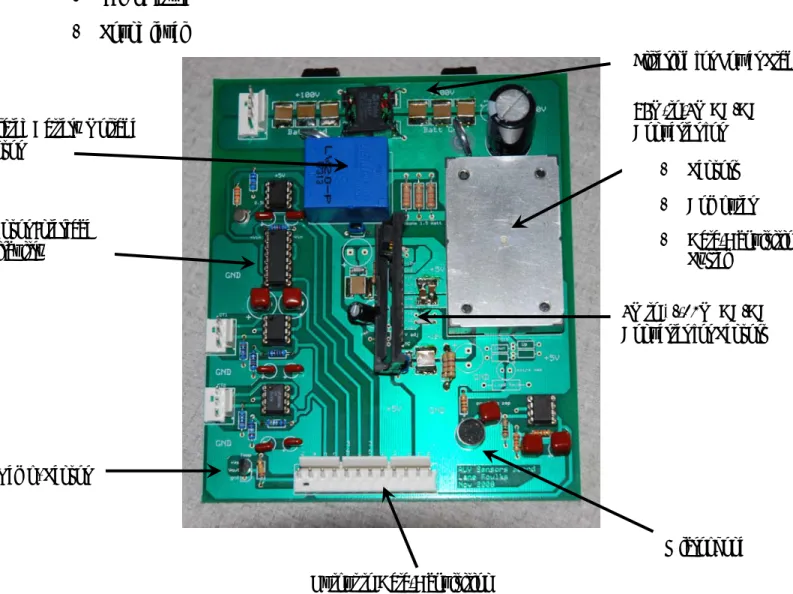
Figure 1 shows the sensor and power board designed for use in the AUV. Circuitry on this board is powered directly from the 96V DC signal provided from the Li-ion battery pack. This voltage is stepped down to 5V using a compact quarter-brick DC/DC converter from Synqor. The 5V DC output from the Synqor module supplies power to all of the other components in the system. A +12V bus and -12V bus are provided by a separate DC/DC converter that is fed from the 5V rail. The sensor board is equipped to interface with a variety of sensors. Our suite currently includes the following:
• LA-55 Hall effect probe monitoring battery current.
• LA-55 Hall effect probe monitoring current into one phase of one of the thrusters. • Isolated LV-25 Hall effect voltage sensor monitoring battery voltage
• LM35 temperature sensor • FET microphone
Signal-conditioning circuits on the PCB perform amplification and filtering. An instrumentation amplifier and a precision voltage reference compute the “details” of the low-frequency variations in the battery voltage. Ultimately, seven signals are provided to the data-acquisition system via the Molex connector at the bottom of the board:
• Battery current • Thruster current
• Battery voltage
• Zoomed-in “Details” of the battery voltage • Precision voltage reference
• Temperature • Sound level
Filtering for Power Stage 96V-to-5V DC/DC Converter for
Figure 1: NILM Sensor and Power Board.
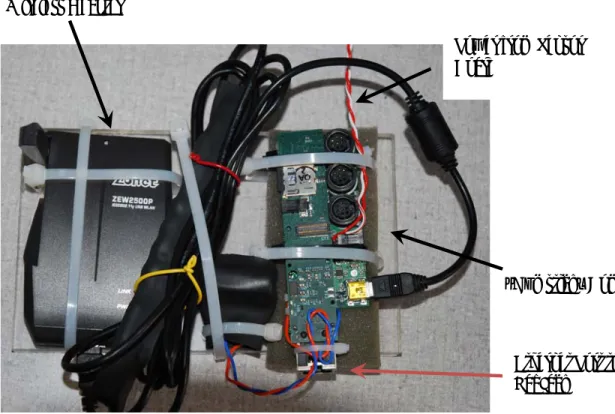
Data acquisition and storage in the AUV NILM is controlled by a small-footprint computer manufactured by Gumstix. Figure 2 shows a photograph of the “gumstick” device. This Linux-based computer interfaces with both a wireless adapter (via USB) and a 16-bit data-acquisition system manufactured by LabJack. The wireless adapter is connected to the gumstick via USB, and the LabJack module is connected via Ethernet. The wireless feature was added so that data can be easily downloaded by a user with a nearby laptop. Power is provided from the Synqor
• Sensors • Computer • Data-Acquisition
System Isolated Battery Voltage
Sensor
Sensor Interface Circuitry
5V to +/-12V DC/DC Converter for Sensors
Temp. Sensor
Microphone Output to Data-Acquisition
module on the sensor board. Note that both the adapter and the computer are affixed to a plexi-glass backplane.
“Gumstick” Comp. Power from Sensor
Board
Ethernet Port to LabJack Wireless Adapter
Figure 2: Gumstick computer (right) and wireless adapter (left).
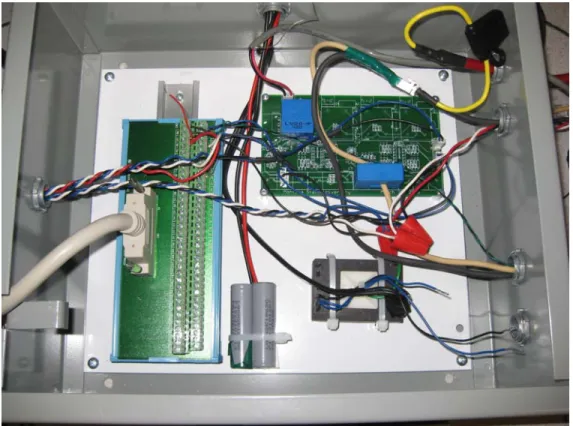
All of the components of the NILM system are installed inside of a high-pressure housing from Prevco. The sensor board is affixed to the transparent lid of the Prevco housing as shown in Figure 3. Note that all of the other components are currently strapped to the sensor board. The data-acquisition system from LabJack can be seen immediately to the left of the gumstick computer.
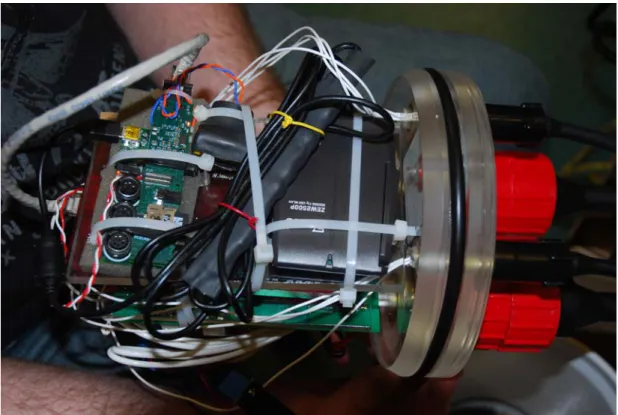
Figure 4 shows the complete NILM sphere connected to the AUV. Note that four sets of cables are connected to the top of the housing. The two cables with the red connectors carry the main battery current. The other two cables carry three wires, one for each phase of one of the thruster motors. Current sensors are contained inside of the NILM housing, and a 3A inline fuse protects the battery from any potential problems inside the NILM sphere.
Figure 3: Complete NILM system as installed inside the Prevco housing.
The NILM Sphere
Battery Sphere Thruster
Control Sphere
System Features
Currently, the NILM system is configured to sample 7 signals at a rate of 8kHz per channel. Given the data storage limitations on the gumstick, the NILM can sample for approximately 10 hours. To begin data collection, a user must bring a laptop close to the AUV and log into the gumstick using an ssh client. Once logged in, the user must execute the start_run script which begins data collection. At that point, data collection will continue independently without any need for interaction from the user. The NILM will continue to collect data until it is either told to stop via execution of the stop_run script, or until its flash memory becomes nearly full. To retrieve data, the user can again log into the gumstick from a laptop and transfer files using either ftp or ssh.
Example Data
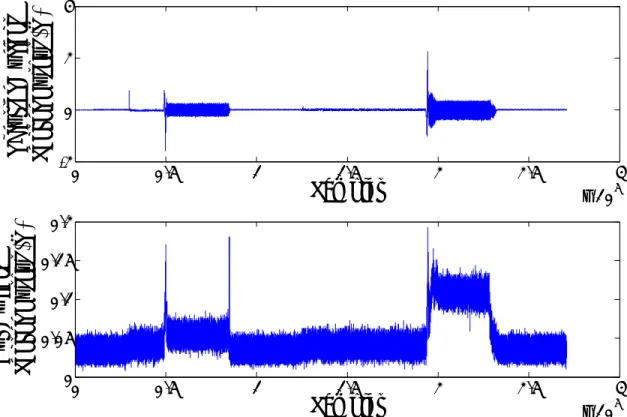
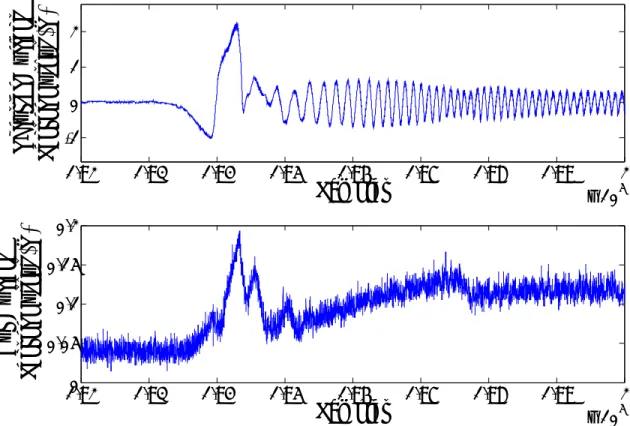
We have performed initial testing with the NILM connected to the AUV in the laboratory. Figure 5 shows some results. The top trace is the output voltage from the hall effect sensor that monitors one of the thruster currents. The bottom trace is the output voltage from the sensor monitoring the battery current. Note that the thruster was started twice. During the first start, the thruster was operated at a low speed; during the second test it was operated at its highest speed.
0 0.5 1 1.5 2 2.5 3 x 10⁵ -2 0 2 4
Samples
T
hr
ust
er
Cu
rr
en
t
Se
ns
or
O
utput
(V)
0 0.5 1 1.5 2 2.5 3 x 10⁵ 0 0.05 0.1 0.15 0.2Samples
Bu
s Cu
rr
en
t
Se
ns
or Output (
V
)
Figure 6 shows details of both the thruster current and the battery current during a thruster start-up. Note that the battery current is clearly related to the envelope of the thruster current. We are currently investigating this behavior in the laboratory using a similar system described later. 1.92 1.93 1.94 1.95 1.96 1.97 1.98 1.99 2 x 10⁵ -1 0 1 2
Samples
T
hrus
te
r C
urre
nt
Se
ns
or
O
utput (
V
)
1.92 1.93 1.94 1.95 1.96 1.97 1.98 1.99 2 x 10⁵ 0 0.05 0.1 0.15 0.2Samples
Bu
s Cu
rr
en
t
Se
ns
or O
utput (
V
)
Figure 6: Details of the sensor output signals during the high-speed start.
II. Battery Diagnostics
1We are currently investigating non-intrusive diagnostics and health-monitoring algorithms for lithium-ion batteries. Our technique is based on an approach that we previously developed for lead-acid batteries. This method is described below, and some results from tests using individual cells from the Odyssey class AUVs are included. This section also describes ongoing work using Bayesian Belief Networks to try to model the complex physical relationships that exist between battery parameters and various external effects.
1 The work described in this section is to be presented at the IEEE Energy Conversion Congress and Exposition
Introduction to the Transient-Based Monitoring Approach
The growing demand for electric vehicles and distributed energy sources has increased the need for safe, reliable, and cost-effective energy-storage systems, many of which include batteries. The reliability and efficiency of these battery-based systems can be significantly improved using intelligent energy-management systems that effectively indicate battery health in real time. On-line monitoring can be difficult, however, because batteries are non-linear and time-varying systems whose parameters and terminal characteristics depend on temperature, usage history, and many other environmental and state-based factors [1]. Such a monitoring system would be useful aboard AUVs.
This section describes a non-intrusive method for estimating the electrical parameters of a battery during typical operating cycles. In this approach, parameters in an equivalent lumped-element electrical model are estimated when transient currents are drawn from the battery terminals. The method is based on the experimental observation that standard electrical loads draw transient current waveforms that sufficiently excite the internal dynamics of the battery. Extensive previous research and theoretical arguments indicate that these electrical parameters are closely related to the overall health and state-of-charge of the battery [1],[2],[3],[4],[5]. One could thus use the estimated parameter values as the basis for an on-line monitoring system. Such a method would have advantages over other approaches. For instance, many methods require special tests sources, and others, such as the estimation of state-of-charge based on current integration, are subject to biases [1], [2], [3].
The Estimation Process
Transient measurements are used to estimate the values of the parameters in the circuit model shown in Fig. 7 [4], [6], [7]. Identification is performed by connecting the battery to a typical electrical load such as a headlamp. Figure 8 shows the response when a 12V lead-acid battery is connected to a halogen bulb. Clearly, the first-order dynamics represented in Fig. 7 have been excited. Several researchers have proposed higher order models with additional time constants [6], [7], but we have found the single time-constant model to be sufficient over the majority of the lifetime of the battery.
0 50 100 150 200 250 11.4 11.6 11.8 12 V ol tage, V 0 50 100 150 200 250 -10 0 10 20 Time, Sec C urre nt , A
Figure 8: Terminal voltage and terminal current following the connection of a halogen head lamp to a 12V
lead-acid battery.
The model in Fig. 7 is described by the state equation b
α
1 cα
2c
I
V
dt
dV
=
−
. and the observations
V
b=
V
oc−
I
bα
3 −V
c.The parameters α1, α2,and α3 are defined as follows:
C 1 1 = α C R2 2 1 = α α3 =R1.
The values of these parameters are estimated using a three-step procedure. First, we excite the battery using an ordinary load such as an automotive headlamp. During this test, we measure both the terminal current Ib and the terminal voltage Vb. Second, we pre-estimate initial guesses
for a non-linear estimation routine to be used in the next step. Finally, we estimate the final parameter values. Each step is described in greater detail below.
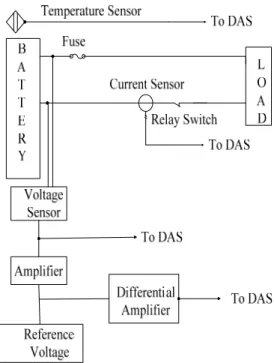
Step 1: Measurement
The estimation procedure uses data collected during the turn-on transient of a typical electrical load. Figure 9 shows the block diagram of the current laboratory setup. In all, four quantities are measured:
• Battery terminal voltage • Battery terminal current • Ambient temperature
• Amplified “details” of the battery voltage
The fourth channel uses a differential amplifier to remove the DC average from the battery voltage. This circuit allows one to accurately observe the “details” of the relatively tiny battery response. Experimental loads such as automotive headlamps and ventilation fans are connected to the battery through a solid-state relay. Note that the overall measurement setup is similar to the one used aboard the AUV.
Figure 9: The block diagram of the current measurement system. Note that four signals are interfaced to the
Data-Acquisition System (DAS).
Step 2: Pre-Estimation
Initial guesses for all three model parameters are determined from simple physical arguments. First, an initial guess for α3 is determined by noting that the capacitor initially acts as
a short circuit when a current is suddenly applied at the terminals. This observation allows us to easily obtain a guess for α3, which is related to the resistance R1. The remaining two parameters
are estimated by noting that the capacitor voltage displays an exponential response when excited by a step current. This observation is utilized to calculate a pre-estimate for α2, a parameter that
is related to the time constant of the resulting exponential. A pre-estimate for the remaining parameter, α1, is evaluated in multiple steps. First, we know that the terminal voltage will
approach as t → ∞. Because of this, we can estimate a value for the total resistance using the steady-state value of the current and the magnitude of the change in the terminal voltage. Since α3 depends on R1, its value is used with the estimate for the total
resistance to obtain a guess for R2. The capacitance C, which is inversely related to the
parameter α1, is finally calculated using the estimate for R2 and the estimate for α2. Throughout
(
R1 R2 Iall of these steps, we assume that the ideal source Voc does not change significantly during the
course of the transient. Experimental results have shown this to be true as long as the state-of-charge is not extremely low and the load step is not extremely large.
Part 3: Estimation
Initial guesses for the three parameters are fed to a non-linear least-squares routine that estimates the value of each. Our algorithm is based on the modified version of the Gauss-Newton method presented in [8]. This robust routine tends to avoid local minima by exploiting any structure in the residuals [8]. The overall estimation step minimizes
) ( ^ μ b b V V r= − ,
where μ is the parameter set and is the resulting estimate of the terminal voltage. is produced via a simulation.
^
b
V V^b
Experimental Results
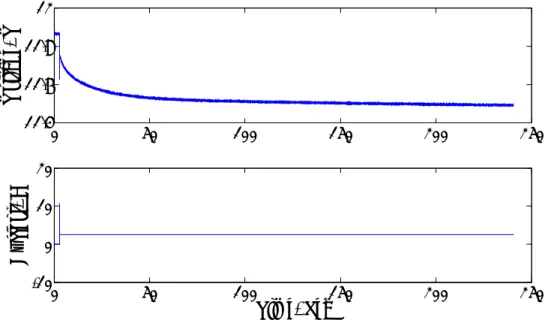
Experimental testing has been conducted in the laboratory. Figure 10 shows both the measured and estimated battery voltage following the connection of a halogen headlamp to a standard 12V automotive lead-acid battery. Figure 11 shows how the estimated resistance R1
(the model parameter α3) varies versus state-of-charge at a fixed temperature (25o C). In these
experiments, state-of-charge was independently verified using the open-circuit voltage, which is linearly related to state-of-charge except at very low and very high values of state-of-charge [1], [3]. Details about the effects of other quantities such as temperature are briefly addressed later in this document. 0 50 100 150 200 12.84 12.86 12.88 12.9 12.92 12.94 Time, Sec Vol ta ge, V
0.03 0.025 0.02 0.015 0.01
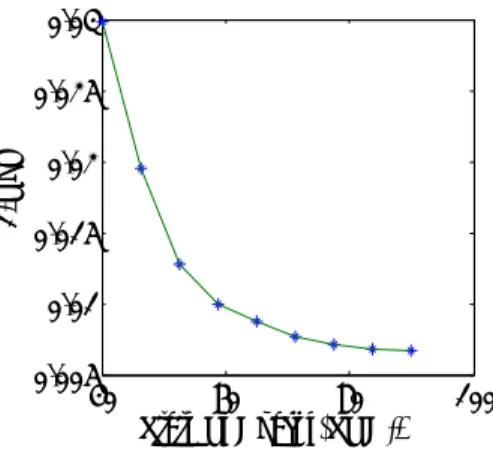
Figure 11: Value of R1 versus state-of-charge at 25 degrees C. Note that R1 increases as state of charge decreases.
Approach used with Lithium-Ion Batteries
The estimation method described above has also been applied to the lithium-ion batteries deployed on the Odyssey class AUVs in the MIT AUV Laboratory. The batteries under test are 18650-type cells. These cylindrical devices are commonly used in portable electronics, including laptops and camcorders. Their nominal voltage is approximately 3.7V [10].
Various models have been proposed for lithium-ion batteries. Many of these try to express the complex non-linear behavior using detailed physical models for the internal electrochemical and thermal processes [9]. A simple lumped-element electrical model has been used here. This model has the same form as the one shown in Fig. 7 for the lead-acid battery. In this model the capacitance describes the effects arising from polarization and the diffusion of space charges near the electrode/solution interface, and the resistances model the effects of finite conductivities in the electrodes and separators, limited reaction rates at the electrodes, and concentration gradients near the electrodes [10]. All of the elements in the simple lumped-element model, including the open-circuit voltage, depend upon temperature, the amount of remaining active material, and other effects. Although highly simplified, the first-order dynamics of the proposed model match closely with experimental measurements. This fact has also been observed by other researchers [10].
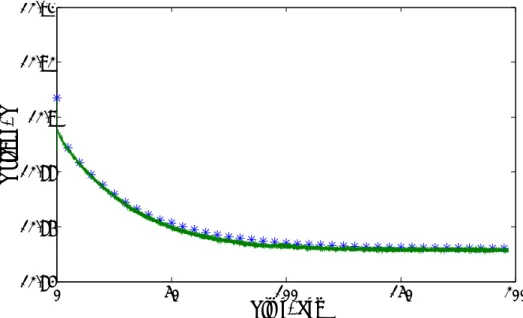
The experimental setup used with the Li-ion batteries is shown in Fig. 12. This arrangement is functionally equivalent to the one shown in Fig. 9 for the lead-acid battery. In this case, we connect a 4.7Ω resistor across a single cell. The resulting transient response is used for estimation. Figure 13 shows the current and voltage measured during a typical experiment. Note that the general form of the voltage response is consistent with the model shown in Fig. 7. Additionally, it is clear that the time constant R2C is much smaller in this battery than it was in
the 12V lead-acid. The primary reason for this is that the capacitance of the 18650 Li-ion cell is much smaller than the capacitance of its larger 12V lead-acid counterpart [10].
40 0.005 60 80 100 R1 ,Oh m State of Charge(SOC), %
Figure 12: Laboratory test setup for Li-ion battery diagnostics.
0 0.5 1 1.5 2 2.5 3 3.5 4 -0.5 0 0.5 1
Time (Sec)
C
urre
nt (A
)
0 0.5 1 1.5 2 2.5 3 3.5 4 3.4 3.6 3.8Time (Sec)
Bat
te
ry
Vo
ltag
e (
V
)
Figure 13: Top Trace: Current drawn by a 4.7 Ohm resistor connected across the terminals of the battery. Bottom
Experiments have been conducted using a single 18650 cell at a number different charge levels. The estimation process uses the same three steps described for the lead-acid case. Table 1 shows how the value of the estimated capacitance varies as a function of state-of-charge. This behavior matches expectations, as the capacitance is known to increase as the depth-of-discharge increases [5]. All tests were performed at 25 degrees C.
Table 1: Capacitance vs. State-of Charge in an example 18650-type Li-Ion Cell. All values were obtained at 25
degrees C. Capacitance Value (F) State-of-Charge (%) 1.46 20% 1.21 40% 0.78 60% 0.62 80%
Conclusion: Moving Towards a Robust Health-Monitoring Tool
The proposed method provides the basis for a robust on-line monitoring system for both lead-acid batteries and lithium-ion cells. One open question is how to deal with the effects of temperature, rate-of-discharge, and other factors. For instance, the capacitance in the Li-ion battery model depends on both the state-of-charge and the temperature. If the estimated value of the capacitance changes, one might wonder if this change has been caused by temperature fluctuations or by a true change in state-of-charge. The solution currently under investigation uses what are known as Bayesian belief networks (BBNs). These networks are commonly used to solve problems involving uncertainty, complexity, and probabilistic inference. BBNs are based on models that describe the complex inter-relationships between the various components in a system [11]. Their main use comes in situations that require statistical inference. For instance, if one knows that a particular event has occurred in a system, the BBN attempts to determine what unobserved events may result. These networks are now commonly used in diagnostic applications [11].
In the example of the Li-ion capacitance, one could build a network that models the interrelationship between capacitance, temperature, and state-of-charge. If one observes a change in capacitance, the BBN would decide if the change was more likely caused by change in charge level or a change in temperature. The successful application of this method will require extensive statistical modeling. The authors are currently in conversations with the National Renewable Energy Laboratory (NREL) to obtain the necessary data.
III. Future Work
The authors are interested in continuing work with the MIT AUV laboratory. Several tests are currently identified:
• On-line testing of battery parameter estimation on the full 96V battery pack • Modeling and diagnostic development for the AUV’s electromechanical loads With permission, the authors would like to perform these tests in the summer of 2010.
REFERENCES
[1] D. Linden and T. B Reddy, Handbook of Batteries, New York: McGraw-Hill, 2001.
[2] S. Pang, J. Farrell, J. Du, and M. Barth, “Battery state-of-charge estimation,” Proc. Amer. Control Conf., vol. 2, Jun. 2001, pp. 1644-1649.
[3] J. Chiasson, and B. Vairamohan, “Estimating the State of Charge of a Battery,” IEEE Transactions on Control Systems Technology, vol. 13, no. 3, May 2005.
[4] Z.M. Salameh, M.A. Casacca, and W.A. Lynch, “A mathematical model of lead-acid batteries,” IEEE Trans. Energy Conversion, vol. 7, no.1, pp. 442-446, Mar. 1992.
[5] J. S. Newman, Electrochemical Systems, 2nd ed. Englewood Cliffs, NJ: Prentice-Hall, 1991. [6] S. Barsali and M. Ceraolo, "Dynamical models of lead-acid batteries: implementation
issues," IEEE Transaction on Energy Conversion, vol. 17, pp. 16-23, 2002.
[7] M. Ceraolo, "New dynamical models of lead-acid batteries," IEEE Transactions on Power Systems, vol. 15, pp. 1184-1190, 2000.
[8] S. R. Shaw, and C. R. Laughman, “A method for nonlinear least squares with structured residuals,” IEEE Trans. on Automatic Control, vol. 51, no. 10, Oct. 2006, pp. 1704 - 1708. [9] W. B. Gu and C. Y. Wang, “Thermal-electrochemical modeling of battery systems,” Journal
Electrochem. Soc., vol. 147, no. 8, pp. 2910-2922.
[10] L. Gao, S. Liu, and R. A. Dougal, “Dynamic lithium-ion battery model for system simulation,” IEEE Trans. on Components and Packaging Technologies, vol. 25, no. 3, Sep. 2006, pp. 495-505.
[11] O. Pourret, Bayesian Belief Networks: A Practical Guide to Applications, New York: Wiley, 2008.