Publisher’s version / Version de l'éditeur:
Vous avez des questions? Nous pouvons vous aider. Pour communiquer directement avec un auteur, consultez la première page de la revue dans laquelle son article a été publié afin de trouver ses coordonnées. Si vous n’arrivez pas à les repérer, communiquez avec nous à [email protected].
Questions? Contact the NRC Publications Archive team at
[email protected]. If you wish to email the authors directly, please see the first page of the publication for their contact information.
https://publications-cnrc.canada.ca/fra/droits
L’accès à ce site Web et l’utilisation de son contenu sont assujettis aux conditions présentées dans le site LISEZ CES CONDITIONS ATTENTIVEMENT AVANT D’UTILISER CE SITE WEB.
Proceedings of Healthy Buildings 2006: Creating a Healthy Indoor Environment
for People, 2, pp. 93-98, 2006-06-01
READ THESE TERMS AND CONDITIONS CAREFULLY BEFORE USING THIS WEBSITE. https://nrc-publications.canada.ca/eng/copyright
NRC Publications Archive Record / Notice des Archives des publications du CNRC :
https://nrc-publications.canada.ca/eng/view/object/?id=a9025c14-94ed-44ea-a86e-293810271258 https://publications-cnrc.canada.ca/fra/voir/objet/?id=a9025c14-94ed-44ea-a86e-293810271258
NRC Publications Archive
Archives des publications du CNRC
This publication could be one of several versions: author’s original, accepted manuscript or the publisher’s version. / La version de cette publication peut être l’une des suivantes : la version prépublication de l’auteur, la version acceptée du manuscrit ou la version de l’éditeur.
Access and use of this website and the material on it are subject to the Terms and Conditions set forth at
Satisfaction with ventilation in open-plan offices: COPE field findings
http://irc.nrc-cnrc.gc.ca
Satisfaction with ventilation in open-plan offices: COPE field
findings
N R C C - 4 6 7 8 8
C h a r l e s , K . E . ; V e i t c h , J . A . ;
N e w s h a m , G . R . ; M a r q u a r d t ,
C . J . G . ; G e e r t s , J .
A version of this document is published in / Une version de ce
document se trouve dans:
Proceedings of Healthy Buildings 2006:
Creating a Healthy Indoor Environment for People, Lisboa, Portugal,
June 4-8, 2006, v. II, pp. 93-98
Satisfaction with Ventilation in Open-Plan Offices: COPE Field Findings
K.E. Charles, J.A. Veitch, G.R. Newsham, C.J.G. Marquardt, and J. Geerts
Institute for Research in Construction, National Research Council of Canada, Building M-24, 1200 Montreal Road, Ottawa, ON, K1A 0R6, Canada email: [email protected] http://irc.nrc-cnrc.gc.ca/ie/index_e.html
Summary: As part of the Cost-effective Open-Plan Environments (COPE) project, we conducted a field study to investigate how the open-plan office environment influenced occupant satisfaction. Physical and questionnaire data were collected simultaneously from 779 open-plan office workers and their workstations. Hierarchical regression analyses, controlling for age, gender and job status, indicated that ‘satisfaction with ventilation’ (a 3-item sub-scale assessing satisfaction with air quality, temperature and air movement) was influenced by workstation partition (panel) height, the presence of a window, air velocity, air temperature, and carbon dioxide concentration.
Keywords: satisfaction, ventilation, offices
Category: human responses to IAQ, occupant perception & work performance
1 Introduction
Over 60% of North American office workers occupy open-plan offices [1], but many do not enjoy the experience. As part of a large, interdisciplinary project (Cost-effective Open-Plan Environments, COPE: http://irc.nrc-cnrc.gc.ca/ie/cope/index_e.html) we conducted a field study to examine the relationships between the physical environment in open-plan offices and occupant satisfaction. This paper discusses findings related to occupants’ satisfaction with air quality and thermal conditions (collectively referred to as “satisfaction with ventilation”).
Some research suggests that open-plan office occupants experience less favourable indoor air quality and thermal conditions. One occupant survey, for example, found that 61% of open-plan office occupants perceived their office to be too stuffy, and 69% reported being either too hot or too cold [2]. Similarly, in a telephone survey, open-plan office workers were 1.5 times more likely to report poor air quality, and also to believe that this negatively affected their productivity, as compared to occupants working in enclosed offices [3]. In another study that compared completely open, open-plan (with partitions) and enclosed offices, the degree of enclosure was found to predict satisfaction with temperature, but not satisfaction with air quality [4]. One cited explanation for increased complaints in open-plan offices is that the workstation partitions (or panels) separating workers from each other block the effective flow of ventilation within the space. However, laboratory studies conducted to examine this possibility have typically found that partition height and the presence of a gap at the bottom of partitions had minimal effects on air distribution patterns, pollutant removal, and ventilation efficiency [5,6].
Dissatisfaction with air quality and thermal conditions in open-plan offices might also be due to a reduction in control over the physical environment (e.g. inability to close doors, open windows, or alter thermostat settings), from an increased density of occupants and furnishings in the space, or from the presence or absence of a window in the occupants’ workstation. However, there is scant available research on these issues.
One limitation of work in this area is that few studies have reported both the physical conditions and occupant reactions in sufficient detail to allow relationships between the physical environment and occupant satisfaction to be drawn. Most studies of occupants have focused on open-plan versus enclosed office comparisons, but have not examined more subtle differences between open-plan workstations of different sizes or with different partition heights. Those that have taken measurements of the ambient environment have not done so on an individual workstation basis, but rather report average conditions for the space overall. Relatively few studies of occupants’ reactions to open-plan offices appear to have taken place since the late 1980s, since the advent of personal computing.
Conversely, most experimental studies that have examined the physical environment of open-plan offices in detail have not included occupants in their studies.
Given that open-plan offices are likely to remain popular into the foreseeable future, the field study reported here was designed to fill a gap in the literature, by taking detailed measurements of both the physical conditions and occupant satisfaction in open-plan office environments. This paper examines how workstation characteristics (such as workstation size and partition height) and physical conditions (such as air temperature and carbon dioxide level) influence occupants’ satisfaction with air quality and
thermal conditions (collectively referred to as “satisfaction with ventilation”).
2 Method
2.1 Sites
Data were collected from nine buildings between spring 2000 and spring 2002. Five buildings were occupied by public sector Canadian organizations. The remaining four were occupied by private sector organizations in Canada and the U.S. All buildings, and the specific locations within them, were selected because they contained open-plan offices occupied by white-collar workers, and because their management was willing to host the visit.
The buildings’ floor plates ranged from 625 to 3,815m2, and all were mechanically ventilated and conditioned. One building allowed workers to personally control the direction of airflow from ceiling vents, while the remainder offered no control. Windows were non-operable in all but one of the buildings.
2.2 Participants
Participants were the occupants of floors visited by the research team. All occupants present on the visit day were eligible to participate, and approximately 95% of those invited agreed to take part. Participants ranged in age from 18 to 70 years, with a mean age of 36.2 years (SD=10.6). The sample was split relatively equally by gender (47.6% female, 51.5% male). Participants were employed in administrative (27.1%), technical (24.9%), professional (38.4%), and managerial (8.6%) level positions.
2.3 Procedure
Emails and memos were circulated prior to data collection, to inform employees of the purpose and intent of the research. Once on site, researchers introduced themselves to individual occupants in turn, while they were seated at their desks, and gave them the opportunity to participate in the study. If the occupant agreed to take part, he/she was taken to an adjacent workstation to complete the questionnaire on a palmtop computer. While the occupant was absent, researchers completed the physical data collection in the occupant’s workstation.
2.4 Questionnaire
The questionnaire comprised 27 items about occupants’ environmental satisfaction, job satisfaction, and demographic characteristics. Occupants were instructed to base their responses on the physical conditions that existed at the time they were asked to participate in the study, so that responses could be related to the physical data collected from the workstation. Full details of the questionnaire are reported elsewhere [7].
The items considered in this paper came from the 18-item environmental satisfaction measure used. This instrument asked participants to rate their satisfaction
with various aspects of the indoor environment (e.g. “the amount of lighting on the desktop”, “the overall air quality in your work area”). Occupants responded on a 7-point scale that ranged from “very unsatisfactory” to “very satisfactory”. These items were based on previous work by Stokols and Scharf [8].
Exploratory and confirmatory analyses determined that the 18 environmental satisfaction items could be reliably reduced to 3 subscales: satisfaction with lighting, satisfaction with privacy/acoustics, and satisfaction with ventilation [7,9]. The “satisfaction with ventilation” scale used in this paper was a three-item scale assessing participants’ satisfaction with the “overall air quality in your work area”, “temperature in your work area”, and “air movement in your work area”.
2.5 Physical data
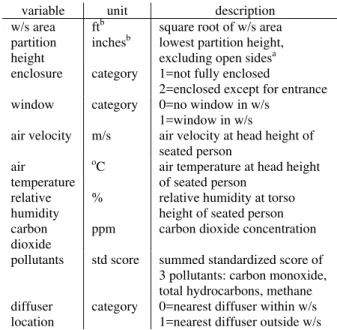
Researchers used a specially designed and constructed array of sensors, attached to a modified office chair, to take measurements of the physical conditions at the participant’s most usual seated location within the workstation. The researchers also collected additional information, such as the size of the workstation, distance from a window, and height of partitions surrounding the workstation. The physical data collected included workstation characteristics, lighting, acoustics, air quality, and thermal variables. The full details of physical data collected, and of the equipment used for collection, is reported elsewhere [7]. The physical data used in this paper are described in Table 1.
Table 1. Description of physical data
variable unit description
w/s area ftb square root of w/s area partition
height
inchesb lowest partition height, excluding open sidesa enclosure category 1=not fully enclosed
2=enclosed except for entrance window category 0=no window in w/s
1=window in w/s
air velocity m/s air velocity at head height of seated person
air temperature
o
C air temperature at head height of seated person
relative humidity
% relative humidity at torso height of seated person carbon
dioxide
ppm carbon dioxide concentration pollutants std score summed standardized score of
3 pollutants: carbon monoxide, total hydrocarbons, methane diffuser
location
category 0=nearest diffuser within w/s 1=nearest diffuser outside w/s
Notes: w/s = workstation; a = in practice, the lowest partition height was equal to the highest partition height in the majority of w/s; b = North American office design practice uses British units for size measurements, therefore it was most sensible to describe our measurements in this way. In the text we provide the metric equivalent.
Both air temperature and air velocity were measured at head, torso, and ankle heights during data collection. However, as the data collected from the three measurement locations were moderately to strongly correlated with each other, only one measurement location was used for analyses.
3 Results
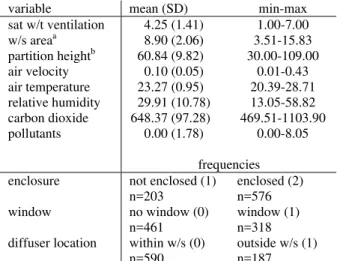
Table 2 shows the descriptive statistics for the satisfaction with ventilation scale and the physical data included in the present analyses.
Table 2. Descriptive statistics.
variable mean (SD) min-max
sat w/t ventilation 4.25 (1.41) 1.00-7.00 w/s areaa 8.90 (2.06) 3.51-15.83 partition heightb 60.84 (9.82) 30.00-109.00 air velocity 0.10 (0.05) 0.01-0.43 air temperature 23.27 (0.95) 20.39-28.71 relative humidity 29.91 (10.78) 13.05-58.82 carbon dioxide 648.37 (97.28) 469.51-1103.90 pollutants 0.00 (1.78) 0.00-8.05 frequencies enclosure not enclosed (1)
n=203 enclosed (2) n=576 window no window (0) n=461 window (1) n=318 diffuser location within w/s (0)
n=590
outside w/s (1) n=187
Note: n=779 for all variables, apart from sat w/t ventilation (n=775) and diffuser location (n=777); a=metric equivalents for workstation area, mean=2.71m, range 1.07-4.83m; b=metric equivalents for partition height, mean=1.55m, range 0.76-2.77m.
Approximately half of the bivariate correlations between the variables included in this analysis were significant, but small (r<±0.3). Moderate correlations were found between three variable pairings. Workstation area was significantly correlated to both partition height (r=0.61, p≤0.001) and enclosure (r=0.49, p≤0.001). In addition, relative humidity was significantly correlated to pollutants (r=0.58, p≤0.001). Overall, there was no evidence of multicollinearity, which would cause statistical problems during regression analyses [10].
For the main analyses, we used hierarchical linear regression, to examine the relationships between the physical data and satisfaction with ventilation. The approach taken follows generally accepted practices within the behvioural sciences [10,11]. The data were first examined for inconsistencies and errors, and were corrected where possible, leaving data as missing if there were any question. For the physical variables, there was very little missing data, and no evidence of any systematic missing data. We calculated the “satisfaction with ventilation” scale scores as the average of available data for the 3 items, provided there was valid data for at least 2 out of the
3 items. This criterion resulted in four missing cases for satisfaction with ventilation.
The variables were all tested for normality, univariate outliers and multivariate outliers, following accepted recommendations [12]. All variables included in the present paper were normally distributed. Univariate and multivariate outliers were excluded from analyses. The overall result of data cleaning and screening was a sample size of 721.
The regression models were hierarchically structured, with the variables being entered into the model in a series of steps. Demographic variables were entered on step 1, in order to control for the influence of these variables on satisfaction with ventilation. These comprised gender (0=male, 1=female), age, and job type. Job type had four categories and was entered into the regression model as three dummy codes: Administrative (1=administrative, 0=other), Professional (1=professional, 0=other), and Managerial (1=managerial, 0=other).
The order of entry of the other variables into the model were determined on theoretical considerations and guidance from existing literature. In step 2, we entered characteristics of the workstation: workstation area, partition height, enclosure, and window. We then entered the thermal variables (air velocity, air temperature, and relative humidity) as step 3. Step 4 comprised the diffuser location variable, and air quality variables (carbon dioxide and pollutants) were entered in the final step.
It should be noted that only linear effects were examined in this model, although it could be argued that satisfaction would be non-linearly related to some variables, in particular air velocity, air temperature and relative humidity. However, exploratory regression analyses of these variables indicated no evidence of quadratic relationships.
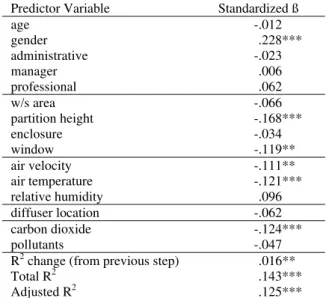
The model tested also included air temperature, air velocity and relative humidity as separate predictor variables, rather than combining them into thermal comfort indices. A separate hierarchical linear regression analyses, using derived PPD and Draught Index values, indicated that the thermal variables predicted satisfaction with ventilation better as separate variables than as combined indices [7]. Tables 3a to 3d show the results of the regression model following steps 2, 3, 4, and 5, respectively. Overall, the model explained 14.3% of the variance in satisfaction with ventilation (p≤.001), with each step of the analysis other than diffuser location (step 4) adding a significant amount to the variance explained. As can be seen in Table 3d, in the complete model six variables significantly predicted satisfaction with ventilation. Men were significantly more satisfied than were women. Amongst the workstation characteristics, occupants with lower partitions and without a window in their workstation were more satisfied with ventilation. Lower levels of both air velocity and air temperature were also associated with
greater satisfaction, over and above that attributable to workstation characteristics. Finally, higher levels of carbon dioxide concentration were associated with lower reports of satisfaction with ventilation.
Table 3a. Regression for sat w/ ventilation (step 2) Predictor Variable Standardized ß
age -.012 gender .191*** administrative .003 manager .041 professional .067 w/s area -.032 partition height -.161*** enclosure -.022 window -.096* R2 change (from previous step) .049***
Total R2 .096***
Adjusted R2 .084***
Notes: N=721; *p≤.05; **p ≤ .01; ***p≤ .001
Table 3b. Regression for sat w/ ventilation (step 3) Predictor Variable Standardized ß
age -.021 gender .220*** administrative -.023 manager .018 professional .055 w/s area -.055 partition height -.182*** enclosure -.032 window -.108** air velocity -.098** air temperature -.144** relative humidity .052
R2 change (from previous step) .029***
Total R2 .125***
Adjusted R2 .110***
Notes: N=721; *p≤.05; **p ≤ .01; ***p≤ .001
Table 3c. Regression for sat w/ ventilation (step 4) Predictor Variable Standardized ß
age -.021 gender .218*** administrative -.023 manager .025 professional .056 w/s area -.071 partition height -.192*** enclosure -.030 window -.111** air velocity -.103** air temperature -.139*** relative humidity .053 diffuser location -.057
R2 change (from previous step) .003
Total R2 .127***
Adjusted R2 .111***
Notes: N=721; *p≤.05; **p ≤ .01; ***p≤ .001
Table 3d. Regression for sat w/ ventilation (step 5) Predictor Variable Standardized ß
age -.012 gender .228*** administrative -.023 manager .006 professional .062 w/s area -.066 partition height -.168*** enclosure -.034 window -.119** air velocity -.111** air temperature -.121*** relative humidity .096 diffuser location -.062 carbon dioxide -.124*** pollutants -.047 R2 change (from previous step) .016**
Total R2 .143***
Adjusted R2 .125***
Notes: N=721; *p≤.05; **p ≤ .01; ***p≤ .001
4 Discussion
The results reported here provide support for the influence of physical variables on open-plan office occupants’ reports of satisfaction with ventilation. The regression analysis explained a total of 14.3% of the variance in satisfaction, bringing it into the range of a medium-sized effect.
As has been indicated by other researchers [13,14], women were significantly less satisfied with ventilation than were men. Several reasons for this difference have been advocated, such as differential thermal preferences (arising from differences in clothing, physiological sensitivity, or psychological expectations) and differential IAQ preferences (arising from differences in physiological sensitivity or psychological expectations of acceptability). However, the debate is still ongoing, and it remains unclear as to which processes dominate this effect. After controlling for demographic variables, two of the four workstation characteristics were significant predictors of satisfaction with ventilation. Lower partition heights were found to be associated with greater satisfaction. This is somewhat surprising, given the laboratory evidence that partition height has little effect on ambient conditions [5,6]. It could be the case that this effect is a function of occupants’ perceptions rather than the physical environment per
se, with occupants holding the belief that taller
partitions will impede acceptable airflow.
Occupants in workstations with windows were also less satisfied with ventilation, as compared to their windowless counterparts, and this effect remained significant even after ambient conditions – including temperature – were included in the regression model. Thus, although temperature at the time of measurement was controlled for in the regression, it seems likely that satisfaction ratings were influenced
by the overall experience of more variable temperatures for those located next to window. An alternative explanation could be that occupants seated next to windows experienced local thermal discomfort caused by radiant temperature differences [15].
Over and above workstation characteristics, the physical variables predicted satisfaction with ventilation. Lower air movement and air temperature were both associated with greater satisfaction, indicating that occupants wanted to be neither too hot nor experience high air movement. Within the range of these variables that we measured, these relationships are consistent with expectations [15]. We would expect both variables to show quadratic relationships with satisfaction, with an optimal mid-range point, but it appears that we did not sample a wide enough range of air temperatures or air velocities to demonstrate this.
Additionally, we found that open-plan occupants tended to be less satisfied with ventilation at higher carbon dioxide concentrations. As carbon dioxide concentrations can be an indirect indication of poor ventilation and contaminant build-up, this relationship is as expected, and supports findings on satisfaction, perceptions and physical health symptoms reported by others [16]. What is of interest here is that in our sample we detected evidence of declining satisfaction at concentrations lower than those typically recommended (e.g., 1,000ppm [17]); our measured concentrations ranged from 469 to 1104 ppm, and the median value in our sample was 639 ppm.
Overall, the results reported here provide modest evidence that the characteristics of workstations and the physical conditions within those workstations do influence open-plan office occupants’ satisfaction. These findings are important, as occupants who are more satisfied with their physical environment have been shown to be more satisfied with their jobs [9,18,19]. Furthermore, higher job satisfaction has been linked to outcomes of relevance for organizational productivity, such as absenteeism, turnover, customer satisfaction, commitment, and task performance [20,21,22].
One limitation of previous research on occupant satisfaction is the lack of detailed data for both physical and occupant measures. This has hindered the formation of specific design and operation recommendations to improve occupant satisfaction. This field study addresses this gap, and provides an important step forwards in developing constructive recommendations for the design and operation of open-plan offices.
Acknowledgements
The COPE project was supported by the National Research Council Canada, Public Works and Government Services Canada, the Building Technology Transfer Forum, Ontario Realty Corp.,
USG Corp., British Columbia Buildings Corp., Natural Resources Canada, and Steelcase, Inc. We also thank the management and employees in the nine buildings for their participation.
The authors are grateful to the following individuals: Chantal Arsenault, John Bradley, Marcel Brouzes, Natalie Brunette, Raymond Demers, Ryan Eccles, Tim Estabrookes, Brian Fitzpatrick, Ralston Jaekel, Judy Jennings, Roger Marchand, Emily Nichols, and Scott Norcross (data collection); Louise Legault (research design advice); Kelly Farley (data analysis); Gordon Bazana and Cara Duval (data management).
References
[1] International Facility Management Association.
Project Management Benchmarks (Research Report #23). (2002). International Facility Management
Association.
[2] A. Hedge. The open-plan office: A systematic investigation of employee reactions to their work environment. Environment and Behavior. 14(5) (1982) 519-542.
[3] J. E. Woods, G. M. Drewry and P. R. Morey. Office worker perceptions of indoor air quality effects on discomfort and performance. Proc. Indoor Air ’87:
4th Int. Conf. on Indoor Air Quality and Climate, pp.
464-468, 1987.
[4] M. J. O’Neill. Effects of workspace design and environmental control of office workers’ perceptions of air quality. Proc. 36th Annual Meeting of the Human Factors Society, pp. 890-894, 1992. Human
Factors Society.
[5] F. S. Bauman, P. E. Faulkner, E. A. Arens, W. J. Fisk, L. P. Johnston, P. J. McNeel, et al. Air movement, comfort and ventilation in a partitioned office space. ASHRAE Transactions: Symposia, 98(1) (1992) 756-780.
[6] C. Y. Shaw, R. A. MacDonald, A. D. Galasiu, J. T. Reardon and D. Y. Won. Experimental
investigation of ventilation performance in a mock up open-plan office ( IRC Research Report IRC-RR-177).
pp. 45, 2003. Institute for Research in Construction, National Research Council of Canada. http://irc.nrc-cnrc.gc.ca/fulltext/rr/rr177/
[7] J. A. Veitch, K. M. J. Farley and G. R. Newsham.
Environmental satisfaction in open-plan environments: 1. Scale validation and methods (IRC Research Report IRC-IR-844). pp. 52, 2002. Institute
for Research in Construction, National Research
Council of Canada.
http://irc.nrc-cnrc.gc.ca/fulltext/ir844/
[8] D. Stokols and F. Scharf. Developing standardised tools for assessing employees’ ratings of facility performance. In: G. Davis and F. T. Ventre (Eds.)
Performance of Buildings and Serviceability of Facilities, pp. 55-68, 1990. American Society for
[9] K. E. Charles, J. A. Veitch, K. M. J. Farley and G. R. Newsham. Environmental satisfaction in open-plan
environments: 3. Further scale validation (IRC Research Report IRC-RR-152). pp. 27, 2003. Institute
for Research in Construction, National Research
Council of Canada.
http://irc.nrc-cnrc.gc.ca/fulltext/rr/rr152/
[10] B. G. Tabachnick and L. S. Fidell. Using
Multivariate Statistics (4th ed.). 2001. Allyn and
Bacon.
[11] E. J. Pedhazur. Multiple Regression in
Behavioural Research: Explanation and Prediction (3rd ed.). 1997. Harcourt Brace.
[12] R. B. Kline. Principles and Practice of Structural
Equation Modeling. 1997. Guildford Press.
[13] A. Hedge, W. A. Erickson and G. Rubin. Effects of personal and occupational factors on sick building syndrome reports in air-conditioned offices. In: J. C. Quick, L. R. Murphy, and J. J. Hurrell (eds.) Work
and Well Being: Assessment and Interventions for Occupational Mental Health, pp. 286-298, 1992.
American Psychological Association
[14] L. Molhave, J. G. Jensen and S. Larsen. Subjective reactions to volatile organic compounds as air pollutants. Atmospheric Environment. 25A(7) (1991) 1283-1293.
[15] American Society of Heating Refrigerating and Air Conditioning Engineers (ASHRAE). Thermal
Environmental Conditions for Human Occupancy (ANSI/ASHRAE Standard 55-2004). American
Society of Heating, Refrigerating and Air Conditioning Engineers.
[16] O. A. Seppanen, W. J. Fisk and M. J. Mendell. Association of ventilation rates and carbon dioxide concentrations with health and other responses in commercial and institutional buildings. Indoor Air. 9(4) (1999) 226-252.
[17] American Society of Heating Refrigerating and Air Conditioning Engineers (ASHRAE). Ventilation
for Acceptable Indoor Air Quality (ANSI/ASHRAE Standard 62.1-2004). American Society of Heating,
Refrigerating and Air Conditioning Engineers.
[18] I. Donald and O. Siu. Moderating the stress impact of environmental conditions: The effect of organizational commitment in Hong Kong and China.
Journal of Environmental Psychology. 21(4) (2001)
353-368.
[19] R. Dillon & J. C. Vischer. Derivation of the
Tenant Questionnaire Survey Assessment Method: Office Buildings Occupant Survey Data Analysis.
1987. Architectural and Engineering Services, Public Works Canada.
[20] J. K. Harter, F. L. Schmidt, and T. L. Hayes. Business-unit-level relationship between employee satisfaction, employee engagement, and business outcomes: A meta-analysis. Journal of Applied
Psychology. 87(2) (2002) 268-279.
[21] C. M. Hellman. Job satisfaction and intent to leave. Journal of Social Psychology. 137 (1997) 677-689.
[22] D. J. Koys. The effects of employee satisfaction, organizational citizenship behaviour, and turnover on organizational effectiveness: A unit-level, longitudinal study. Personnel Psychology. 54(1) (2001) 101-114.