This paper is available online free of all access charges (see http://jxb.oxfordjournals.org/open_access.html for further details)
© The Author [2013]. Published by Oxford University Press on behalf of the Society for Experimental Biology.
This is an Open Access article distributed under the terms of the Creative Commons Attribution Non-Commercial License (http://creativecommons.org/licenses/by-nc/3.0/), which permits non-commercial re-use, distribution, and reproduction in any medium, provided the original work is properly cited. For commercial re-use, please contact journals.permissions@oup.com ReseaRch papeR
Association study of wheat grain protein composition reveals
that gliadin and glutenin composition are trans-regulated by
different chromosome regions
Anne Plessis1,2,*, Catherine Ravel1,2,*, Jacques Bordes1,2, François Balfourier1,2 and Pierre Martre1,2,†
1 INRA, UMR1095, Genetics, Diversity and Ecophysiology of Cereals, 5 Chemin de Beaulieu, F-63100 Clermont-Ferrand, France 2 Blaise Pascal University, UMR1095, Genetics, Diversity and Ecophysiology of Cereals, F-63170 Aubière, France
*These authors contributed equally to this manuscript.
† To whom correspondence should be addressed. E-mail: pierre.martre@clermont.inra.fr
Received 12 September 2012; Revised 27 May 2013; Accepted 30 May 2013
Abstract
Wheat grain storage protein (GSP) content and composition are the main determinants of the end-use value of bread wheat (Triticum aestivum L.) grain. The accumulation of glutenins and gliadins, the two main classes of GSP in wheat, is believed to be mainly controlled at the transcriptional level through a network of transcription factors. This regula-tion network could lead to stable cross-environment allometric scaling relaregula-tionships between the quantity of GSP classes/subunits and the total quantity of nitrogen per grain. This work conducted a genetic mapping study of GSP content and composition and allometric scaling parameters of grain N allocation using a bread wheat worldwide core collection grown in three environments. The core collection was genotyped with 873 markers for genome-wide association and 167 single nucleotide polymorphism markers in 51 candidate genes for candidate association. The candidate genes included 35 transcription factors (TFs) expressed in grain. This work identified 74 loci associated with 38 variables, of which 19 were candidate genes or were tightly linked with candidate genes. Besides structural GSP genes, several loci putatively trans-regulating GSP accumulation were identified. Seven candidate TFs, includ-ing four wheat orthologues of barley TFs that control hordein gene expression, were associated or in strong linkage disequilibrium with markers associated with the composition or quantity of glutenin or gliadin, or allometric grain N allocation parameters, confirming the importance of the transcriptional control of GSP accumulation. Genome-wide association results suggest that the genes regulating glutenin and gliadin compositions are mostly distinct from each other and operate differently.
Key words: Association study, bread wheat, ecophysiological model, grain composition, storage proteins, transcription factors,
Triticum aestivum.
Introduction
Bread wheat (Triticum aestivum L.) is the most important staple crop in the world, providing on average 20% of the total calories and 22% of the total protein in the human diet (FAOSTAT, 2011). Wheat grain has numerous food and non-food uses mainly based on the unique properties of the proteins it contains (Shewry, 2009). When mixed with water, wheat grain storage proteins (GSPs) form a network, called gluten, with distinctive cohesiveness and viscoelasticity
determined by both the total grain protein concentration (GPC) and the relative composition of the storage protein fractions (MacRitchie, 1999). For instance, flour used for breadmaking must contain enough proteins to ensure the dough has suitable functional properties. However, the high-yielding genotypes selected in wheat breeding programmes tend to have lower GPC (Oury and Godin, 2007; Aguirrezábal
et al., 2009). It is thus important to develop wheat cultivars
with well-balanced grain protein compositions to compensate for the low GPC of modern high-yielding accessions (Shewry, 2007; Aguirrezábal et al., 2009).
The major wheat GSPs are the glutenin and gliadin prolamins, which make up 60–80% of total grain proteins. Gliadins are monomeric proteins that fall into the four classes ω5-, ω1,2-, α/β-, and γ-gliadins (Wieser, 2007). Glutenins are composed of high-molecular-weight (HMW-GS) and low-molecular-weight (LMW-GS) subunits, which form very large macropolymers during grain desiccation (Don et al., 2006). It is generally accepted that glutenins have a prominent role in strengthening wheat dough by conferring elasticity, while gliadins contribute to the viscous properties of dough by conferring extensibility. The proportions of grain N allocated to each GSP fraction in a particular accession will therefore affect the properties and quality of the resultant flour. Wheat prolamins are encoded by several loci on the group one and six chromosomes (Shewry and Halford, 2003) and many studies have described the relationships between allelic vari-ability at these loci and the functional properties of dough (e.g. Metakovsky et al., 1997; Branlard et al., 2001; Eagles
et al., 2002). The major non-prolamin GSPs are α-amylase/ trypsin inhibitors and β-amylases (albumins), triticins (glob-ulins), and puroindolines (amphiphilic proteins). Albumin and globulin storage proteins have a limited effect on dough properties but each account for about 10% of the total pro-tein in mature grain (Singh et al., 1991). Puroindolines are responsible for most of the observed variation in grain hard-ness and account for 5–10% of total grain protein in mature grain (Morris, 2002).
Conserved cis-motifs have been identified on GSP pro-moters from wheat, maize (Zea mays L.), barley (Hordeum vulgare L.), and rice (Oryza sativa L.) (Colot et al., 1989;
Zheng et al., 1993) and several TFs interacting with these motifs have been isolated and characterized (Albani et al., 1997; Vicente-Carbajosa et al., 1997; Mena et al., 1998; Dong
et al., 2007). Full activation of GSP genes is achieved by the synergetic interaction of different combinations of these TFs with the cis-motifs in what resembles a regulatory network (Rubio-Somoza et al., 2006a, b; Yamamoto et al., 2006). It is also possible that other TFs are involved in the control of GSP gene expression, even without directly binding the cis-motifs on their promoters. The amounts of the different classes of GSP per grain have been found to scale allometri-cally with the total amount of N per grain independently of N availability and environmental conditions (Martre et al., 2003; Triboi et al., 2003). Such scaling relationships in biol-ogy are often based on regulatory networks (West et al., 1997;
Maritan, 2002; West and Brown, 2005). Therefore, if, as is generally accepted, GSP synthesis is mainly regulated at the transcriptional level (Verdier and Thompson, 2008; Weber
et al., 2010), it can be hypothesized that the allometric scal-ing of grain N allocation resides on a transcriptional network (Ravel et al., 2009).
Other mechanisms might affect the relative proportions of gliadin classes and glutenin subunits in grain without being directly involved in GSP gene regulation. Genes related to N assimilation, like those encoding glutamine synthase and
GOGAT enzymes, may affect the quantity of N per grain (Masclaux et al., 2001; Hirel et al., 2007; Habash et al., 2009;
Quraishi et al., 2011) and hence GPC and GSP composition. GSP accumulation can also be controlled at the translational level via the availability of the different amino acids (Weber
et al., 2010). Thus genes involved in grain metabolism, par-ticularly in N, S, and amino acid metabolism or genes coding for transporters, might have an effect on GSP composition (Galili and Höfgen, 2002; Tabe et al., 2002; Weichert et al., 2010). Genes known to control grain development and cell fate could indirectly affect GPC. For instance, barley and maize mutants of the supernumerary aleurone layer gene, SAL (Shen et al., 2003a), have impaired grain structures and an altered number of protein-rich aleurone layers.
As the molecular control of cereal GSP quantity, composi-tion, and allocation remains unclear, it is necessary to identify the factors controlling these important traits, particularly at the genetic level. Several quantitative trait loci (QTL) have been identified that are associated with GPC and GSP com-position in wheat (Charmet et al., 2005; Ravel et al., 2006;
Zhang et al., 2010) and while most of these colocalize with gliadin and glutenin structural loci, seven QTL are poten-tially involved in the trans-regulation of GSP synthesis. In parallel, gene expression analysis of ditelosomic lines of the spring wheat cultivar Chinese Spring showed that on average eight chromosomal regions were associated with changes in transcript levels of each of the four HMW-GS genes of this genotype (Storlie et al., 2009).
Association mapping has proven to be an efficient strategy to decipher the genetic basis of complex traits (Ingvarsson and Street, 2010). Here, association mapping was used to analyse and validate candidate genes and to scan the genome for new loci involved in the genetic control of cereal GSP composition. Associations with 38 variables related to GPC, GSP composition, and grain N allocation were calculated, including the scaling parameters of an ecophysiological model predicting the effect of the environment on GPC and GSP composition (Martre et al., 2003, 2006a). The current work discusses the respective contributions of cis and trans loci regulating GSP composition in wheat and compare the genetic control of gliadin and glutenin composition.
Materials and methods
Plant material and field experiments
A collection of 196 accessions (Supplementary Data S1, available at JXB online) was selected from the INRA worldwide bread wheat (Triticum aestivum L.) core collection of 372 accessions (Balfourier et al., 2007) using passport data (geographic origin and registra-tion date) and previous field evaluaregistra-tion data (Bordes et al., 2008) to maximize the geographical diversity represented and minimize the risk of crop failure due to lodging (accessions with crop heights between 0.5 and 1.3 m were selected). All seeds were obtained from the INRA Clermont-Ferrand Genetic Resources Centre for Small Grain Cereals (www4.clermont.inra.fr/umr1095_eng/crg). This panel has originally been grown in 12 environments (Bordes et al., 2011). Based on yield and grain protein concentration data, three extreme environments have been selected for this study. They comprise two very different growing seasons and sites and two con-trasted N treatments at one of the two sites.
The 196 accessions were grown in 2005–2006 at Clermont-Ferrand, France (CF, 45° 46’ N 03° 09’ E, 329 m above sea level) and in 2006– 2007 at Le Moulon, France (LM, 48° 10’ N 2° 36’ E, 165 m above sea level). In CF, crops were sown on 8 November 2005 at a density of 150 seed m–2. Experimental plots were nine rows wide (with 17 cm inter-row spacing) and 5 m long (plot area 7.65 m2). The weather conditions during the growing season were similar to the long-term average for this site, with conditions close to optimal. From sowing to harvest maturity, the crops received over 500 mm of rainfall. On 27 April 2006 and 12 May 2006, the crops received 6 and 7 g N m–2, respectively, in the form of ammonium nitrate. The accessions were randomized in two blocks of 121 genotypes for shorter and taller genotypes, respec-tively. In LM, all the accessions were sown on 26 October 2006 at a density of 220 seed m–2. The experimental design consisted of two main blocks corresponding to the low and high N treatments, and each block was divided into 6 subblocks in which 36 accessions were randomized. Plots were eight rows wide (with 20 cm inter-row spac-ing) and 5.5 m long (plot area 8.8 m2). The high N treatment of the LM+ plot was 6 g N m–2 applied on 22 March 2007 and 4 May 2007, while the low N treatment of the LM– plot was 4 g N m–2 on the same dates. All crop inputs, including pest, weed, and disease control and potassium and phosphate fertilizers, were applied at levels to mini-mize yield loss. The cultivation took place in good conditions and except for a short period of mild water deficit during stem extension, the plants received a good supply of water (adding to over 600 mm precipitation). All crops were combine-harvested when grain was ripe with a moisture content of 0.15 g H2O (g fresh matter)–1.
Grain milling and determining grain dry mass and protein concentration
Single grain dry mass and grain water content were determined by oven drying 10 g grain at 80 °C for 48 h and reweighing the sample at zero water content. Grain samples (30 g) were milled using a Cyclotec sample mill (Foss, Höganäs, Sweden) equipped with a 1-mm mesh screen. Wholemeal flour samples (1 g) were oven dried at 80 °C for 48 h, then 5 mg of dry flour were weighed in tin capsules and the total N concentration was determined with the Dumas combustion method (Association of Analytical Communities International approved method no. 992.23) using a FlashEA 1112 N/Protein Analyzer (Thermo Electron, Waltham, MA, USA). GPC was calculated by multiplying grain N concentration by 5.62 (Mossé et al., 1985).
Sequential extraction and quantification of the non-prolamin, gliadin, and glutenin protein fractions
The sequential extraction procedure of Osborne (1907) adapted by Triboi et al. (2003) was modified as follows. Each 2 ml tube con-tained one stainless steel bead (5 mm diameter) and samples were stirred by placing the tubes on a rotating wheel (40 rpm) during each extraction and washing step. The non-prolamin protein fraction was extracted for 30 min at 4 °C from 100 mg wholemeal flour with 1.5 ml of 50 mM phosphate buffer (pH 7.8) containing 0.1 M NaCl. After centrifugation for 10 min (18 000 g) at 4 °C, the supernatant was col-lected and the pellet was washed twice for 10 min each with 1.5 ml of the same buffer. After centrifugation in the same conditions, all supernatants were pooled. The same steps were used to extract the gliadin protein fraction from the previous pellet with 70% (v/v) etha-nol. Finally, the glutenin protein fraction was extracted in 50 mM borate buffer (pH 8.5) containing 2% SDS (w/v) and 1% dithi-othreitol (w/v). The supernatants (80 μl) of each protein fraction were oven dried overnight at 60 °C in tin capsules and their total N concentration was determined with the Dumas combustion method as described above. Protein fractions from samples of the same flour from cultivar Récital were extracted, analysed as a control in each of the 21 sets of extractions and used to determine the coefficient of variation for each of the protein fractions, which were 3.48, 5.10, 2.19, 2.61, and 1.96% for the non-prolamin, gliadin, and glutenin protein fractions, storage proteins, and total proteins, respectively.
Separation and quantification of the gliadin protein classes
Gliadin classes were separated and quantified by HPLC using an Agilent 1290 Infinity LC system (Agilent Technologies, Santa Clara, CA, USA). The gliadin extracts (1 ml) were filtered through regen-erated cellulose syringe filters (0.45 μm pore diameter, UptiDisc, Interchim, Montluçon, France) and 4 μl were injected onto a C8 reversed-phase Zorbax 300 StableBound column (2.1 × 100 mm, 3.5 μm, 300 Å, Agilent Technologies) maintained at 50 °C. Solvent A was 0.1% trifluoroacetic acid in ultra-pure water and solvent B was 0.09% trifluoroacetic acid in acetonitrile. Gliadin classes were sepa-rated by using a linear gradient from 24 to 50% solvent B in 13 min at a 1 ml min–1 flow rate. Proteins were detected by UV absorbance at 214 nm. After the gradient, the column was washed with 80% sol-vent B for 2 min and then equilibrated at 24% solsol-vent B for 2 min, at the same flow rate. Chromatograms were processed with Agilent Technologies ChemStation software. The signal obtained from a blank injection (4 μl) of 70% (v/v) ethanol was subtracted from the chromatograms before integrating the data. The HPLC peaks cor-responding to each of the four gliadin classes were identified as in Wieser et al. (1998). The quantity of each gliadin class as a percent-age of total gliadin was calculated by dividing the areas under each HPLC peak by the total area under the chromatogram trace. The quantity of each gliadin class per grain was calculated by multiply-ing the proportion of each gliadin class in total gliadin by the total quantity of gliadin per grain as quantified by Dumas analysis.
Separation and quantification of glutenin subunits
Glutenins were extracted following the method of Fu and Sapirstein (Fu and Kovacs, 1999) modified as follows. Wholemeal flour sam-ples (30 mg) were stirred for 15 min at room temperature with 1 ml of 80 mM Tris-HCl buffer (pH 7.5) containing 50% (v/v) propan-1-ol. After centrifugation (15,900 g) for 10 min at 15 °C, the supernatant was discarded and the pellet was dispersed by sonication (model 75038, Ultrasonic Processor, Sonics and Materials, Newtown, CT, USA) for 15 s at 30% maximum power in 600 μl of Tris-HCl buffer containing 2% (w/v) SDS and 1% (w/v) DTT. The mixture was incubated at 60 °C for 30 min then centrifuged for 10 min (12,500 g) at 20 °C. High- and low-molecular-weight glutenin subunits were then separated and quantified on a protein microfluidics chip using a LabChip 90 System (Caliper Lifer Science, Hopkinton, MA, USA) as described previously (Rhazi et al., 2009). The HMW-GS to LMW-GS ratio (HMW/LMW) was calculated as the ratio of the fluorescence intensities of the two types of subunits. The quantities of LMW-GS and HMW-GS per grain were calculated by dividing the total quantity of glutenin per grain as determined by Dumas analysis by (1 + HMW/LMW) and (1 + LMW/HMW), respectively.
Phenotypic data analysis
All statistical and regression analysis was done using R 2.12.2 for Windows (R Development Core Team, 2007). Environmental and genetic differences in grain dry mass (GDM), total quantity of grain nitrogen (Ntot), GPC, and grain protein composition were analysed using Kruskal–Wallis nonparametric rank test (α = 0.01) followed by a Behrens-Fisher multiple comparison test.
Allometric scaling parameters for grain protein allocation were determined by fitting data to a power function equation:
Fi= ×α Nβ
where Fi is the quantity of N per grain of the protein fraction con-sidered (mg grain–1), N is the total quantity of N or GSP per grain (mg grain–1), α is the scaling coefficient (mg grain–1), and β is the scaling exponent (dimensionless). For gliadins, glutenins, and GSPs, the allocation scaling parameters were computed from Ntot, whereas for the glutenin subunits and gliadin classes they were computed from the total quantity of GSPs per grain. The power function
equation was fitted either to the 196 accessions independently for each of the three environments or for each accession across the three environments, using log-transformed data and standard major axis regression (Warton et al., 2006) with the R package smatr (Warton et al., 2012). The residuals to the regression lines (Ri) were computed as: Ri = 0.5 × (log(Fi) – β × log(N) – α) × √(1 + 1/β2).
Genotyping wheat accessions
Genotype data for the 196 accessions used in this study were already available for 578 diversity array technology (DArT, Triticarte, Canberra, Australia; www.triticarte.com.au), 282 single-sequence repeat, and 13 single-nucleotide polymorphism (SNP) markers (Bordes et al., 2011). The current work developed 193 additional SNP markers in 60 candidate genes: 13 genes involved in N or S assimilation/metabolism, six genes that control grain development and are likely to regulate the expression of GSP genes in both cere-als and dicots (Verdier and Thompson, 2008), three genes modify-ing grain hardness, five HMW-GS genes, one LMW-GS gene, 13 wheat orthologues of TFs known to control barley hordein expres-sion (Rubio-Somoza et al., 2006a; Moreno-Risueno et al., 2008) or Arabidopsis thaliana seed storage globulins (Verdier and Thompson, 2008), and 19 putative TFs with expression patterns during grain development that resemble GSP gene expression (Romeuf, 2010).
For each accession, genomic DNA was extracted from leaves har-vested from a pool of six 3-week-old seedlings using the BioSprint 96 DNA Plant kit (Qiagen, Hilden, Germany). Out of 193 additional SNP markers (Supplementary Data S1), 149 were included in a set of 384 SNPs typed in the GoldenGate assay (Illumina, Cambridge, UK) according to the manufacturer’s recommendations. The 44 remaining markers could not be typed with this assay for techni-cal reasons, for instance because of the presence of polymorphisms within flanking sequences. To type them, either simplex technologies based on an allele-specific primer were used or a few gene fragments with a high level of polymorphism were directly sequenced.
Genetic map and association analysis
The map used as reference was the consensus map described by Bordes et al. (2011) built with MetaQTL software (Veyrieras et al., 2007) using published data and the reference map of Somers et al. (2004). All the novel SNP markers developed during this study were mapped based on their linkage disequilibrium calculated as r2 values (Weir, 1996) with tassel version 2.1 software (Bradbury et al., 2007). They were placed close to the DArT or single-sequence repeat mark-ers with which the linkage disequilibrium was the highest.
The 578 DArT markers were used to investigate the population structure of the entire core collection with the STRUCTURE soft-ware program (Pritchard et al., 2000). For association analyses, rare alleles (<2.5% of all alleles at a locus) were considered as missing data. Like the core collection, the panel of 196 accessions was also structured into five groups corresponding to the ancestral geographi-cal groups, so the results from the core collection structure were used in the analysis. Associations between markers and phenotypic traits were tested as by Bordes et al. (2011) using the general linear model (GLM) implemented in tassel version 2.0.1. The Q matrix, which gives the contribution of a genotype to each of the five inferred ancestor groups, was introduced in the model as covariate to con-trol for the structure of the collection used and avoid false negatives (GLM–Q model). Two main effects, marker and environment, and their interaction were included in the model. An association was con-sidered significant when the genotype × environment interaction was not significant (P > 0.05) and the P-value of the marker effect was <0.001. This analysis was extended by analysing each of the three environments using the GLM–Q model including only the marker effect. In this case, associations were considered as statistically signifi-cant when the P-value of the genotype effect was <0.001 for at least two environments. Maps and associated regions were represented with the MapChart version 2.1 software program (Voorrips, 2002).
Results
To investigate the association between accession genotypes and wheat storage protein phenotypes, 196 accessions were selected from the INRA worldwide wheat core collection (Balfourier et al., 2007). The resulting subcore collection consisted of accessions originating from 38 different coun-tries and included landraces and old cultivars dating from the nineteenth century and the first half of the twentieth century and modern varieties bred after 1960. These acces-sions were grown in three different environments in the field at Clermont-Ferrand in 2006 under high N conditions (CF+) and at Le Moulon in 2007 under high (LM+) and low (LM–) N conditions. Single GDM and GPC were determined and Ntot was calculated for each accession in each environment. The gliadin and glutenin protein fractions were extracted sequentially and then quantified by elemental analysis. ω5-, ω1,2-, α/β-, and γ-gliadins were separated by reversed-phase HPLC, and LMW-GS and HMW-GS were separated by microfluidics electrophoresis.
Environmental and genetic deviations from allometric grain nitrogen allocation relationships
Overall the GDM, Ntot, and GPC of the accessions were sig-nificantly different between the three environments, and for a given environment they were different between accessions (Table 1). Under high N conditions, median GPC was 10% higher for CF+ than for LM+, but Ntot was similar, so the observed variations of GPC between these two environments were mainly due to variations in GDM. In Le Moulon, all the accessions were grown under both high and low N con-ditions and median GPC was 10% lower for LM– than for LM+ reflecting the lower (–22%) Ntot for LM–. The genetic variability for GDM, Ntot, and GPC was much higher for LM– than for LM+.
The quantities of GSP, gliadin, and glutenin per grain showed very significant environmental and genetic variations (Table 2). The percentages of gliadin and glutenin contribut-ing to Ntot and the gliadin to glutenin ratios were similar in the three environments, but showed very significant genetic variations. The observed data were then fitted to a power model, which described the allometric scaling relationship between total grain N and how much N is allocated to an individual protein fraction. For gliadins, glutenins, and GSPs, the scaling allocation parameters (i.e. the scaling coefficient and the scaling exponent) were computed with respect to Ntot. However, as distinct pools of N are allocated to non-prol-amin proteins and GSPs during grain filling (Martre et al., 2003), it was thought more pertinent to compute the scaling allocation parameters for the glutenin subunits and gliadin classes from the total quantity of GSP per grain.
The genetic variations in the quantity of GSP, gliadin, and glutenin per grain were well explained by the variations in Ntot (Fig. 1) and the power function equation explained 75–94% of the observed variation (Supplementary Table S1). For these three protein fractions, the scaling exponents of the power relationships were not different across the
environments, but there was a shift along the common slope reflecting the differences in Ntot between the environments. By contrast, only the scaling coefficients for gliadins were different between environments (Supplementary Table S1). For glutenins, the scaling exponent was not significantly dif-ferent from 1 (i.e. the amount of glutenin varied in direct proportion to Ntot). In contrast, for gliadins, the scaling expo-nent was 1.37 ± 0.013, indicating that the amount of gliadin increased disproportionally with Ntot. The difference in the scaling exponent between gliadins and glutenins is consistent with values reported previously for the cultivar Thésée stud-ied in a wide range of environments (Martre et al., 2006b).
The genetic variability of the scaling exponents and coeffi-cients of the allometric allocation of grain N to GSPs, gliadins, and glutenins were determined by fitting the power model for each accession across the three environments (Fig. 2). A large genetic variability was found for the scaling exponents for the three protein fractions, while the scaling coefficients were not statistically different among the accessions (Table 3). The scaling coefficients correlated with the percentages of GSP, gliadin, and glutenin in Ntot (Supplementary Table S2 and
Supplementary Data S1). In contrast, the scaling exponents did not correlate with the quantities or proportions of the different protein fractions. The gliadin and glutenin scaling exponents
only correlated with the GSP scaling exponent (r = 0.7). The proportions of glutenin subunits and gliadin classes in total GSP were different in the three environments (Table 4). The percentages of each gliadin class making up the total glia-din fraction, the gliaglia-din to glutenin ratios, and the HMW-GS to LMW-GS ratios were all highly correlated (|r| > 0.75) to the percentage of the corresponding fractions in Ntot or GSP (Supplementary Table S3 and Supplementary Data S1). The proportion of γ-gliadin in either total GSP or total gliadin, the percentage of HMW-GS in total GSP and the HMW-GS to LMW-GS ratio were not statistically different among the accessions (Table 4).
The allometric model explained 61–72% of the genetic var-iability in the quantity of α/β- and γ-gliadins per grain with respect to GSP (Fig. 3 and Supplementary Table S4). For these gliadin classes, the scaling exponents were similar across environments, but the scaling coefficients were modified by the environment. The genetic variability of ω5-gliadins, which accounted for only 1–6% of the gliadin protein fraction (Table 4), was poorly explained by the quantity of GSP per grain (r2 ≈ 0.15, Supplementary Table S3). For HMW-GS and LMW-GS, the scaling exponents were different across the three environments and for LMW-GS the scaling exponent was higher for LM+ than for LM–.
Table 1. Single grain dry mass, quantity of N per grain (Ntot), and grain protein concentration (GPC) for 196 accessions of the INRA
worldwide wheat core collection grown in the field in 2006 at Clermont-Ferrand under high N condition and in 2007 at Le Moulon under high and low N conditions
Values are median (5–95% quantile range). GDM, grain dry mass; GPC, grain protein concentration; CF, Clermont-Ferrand; LM, Le Moulon; +, high N condition; –, low N condition. P-values from the Kruskal–Wallis rank sum test are given for the environment and genetic effects. Different letters within a column indicate significantly different values (P < 0.01) in the Behrens–Fisher post-hoc test.
Environment GDM (mg grain–1) N
tot (mg grain–1) GPC (% of GDM)
CF+ 37.4 (30.4–42.8)a 1.033 (0.74–1.32)a 15.7 (12.9–19.1)a LM+ 43.8 (35.4–52.3)b 1.06 (0.82–1.36)a 14.1 (11.5–16.9)b LM– 37.9 (27.0–46.9)a 0.83 (0.61–1.16)b 12.7 (10.2–15.9)c P-values Environment 3.9 × 10–36 2.7 × 10⁻³⁴ 1.2 × 10–37 Genotype 2.3 × 10⁻⁸ 5.9 × 10⁻⁹ 4.9 × 10⁻⁹
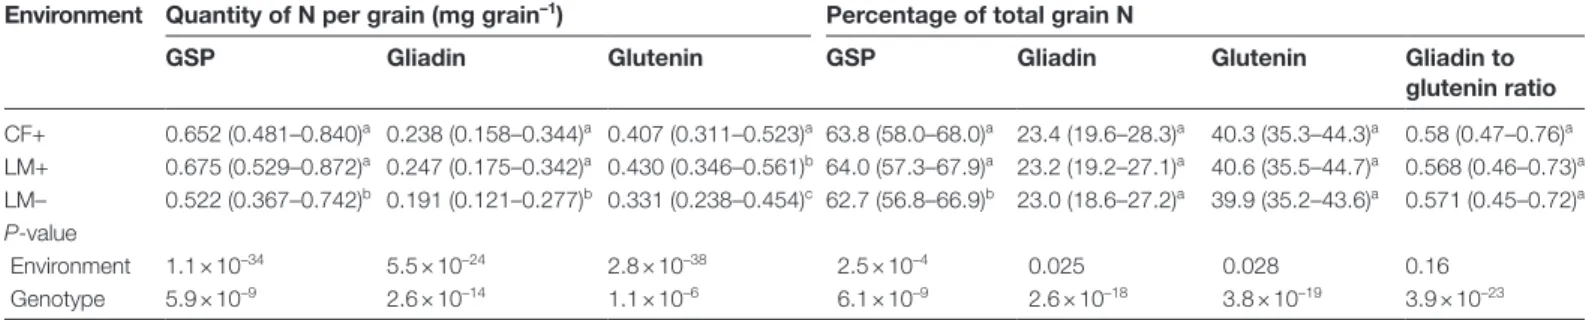
Table 2. Grain storage protein, gliadin, and glutenin as quantity per grain and percentage of total grain N and the gliadin to glutenin ratio for 196 wheat accessions grown in the field in 2006 at Clermont-Ferrand under high N condition and in 2007 at Le Moulon under high and low N conditions
Values are median (5–95% quantile range). GSP, grain storage protein; CF, Clermont-Ferrand; LM, Le Moulon; +, high N condition; –, low N condition. P-values from the Kruskal–Wallis rank sum test are given for the environment and genetic effects. Different letters within a column indicate significantly different values (P < 0.01) in the Behrens–Fisher post-hoc test.
Environment Quantity of N per grain (mg grain–1) Percentage of total grain N
GSP Gliadin Glutenin GSP Gliadin Glutenin Gliadin to
glutenin ratio CF+ 0.652 (0.481–0.840)a 0.238 (0.158–0.344)a 0.407 (0.311–0.523)a 63.8 (58.0–68.0)a 23.4 (19.6–28.3)a 40.3 (35.3–44.3)a 0.58 (0.47–0.76)a LM+ 0.675 (0.529–0.872)a 0.247 (0.175–0.342)a 0.430 (0.346–0.561)b 64.0 (57.3–67.9)a 23.2 (19.2–27.1)a 40.6 (35.5–44.7)a 0.568 (0.46–0.73)a LM– 0.522 (0.367–0.742)b 0.191 (0.121–0.277)b 0.331 (0.238–0.454)c 62.7 (56.8–66.9)b 23.0 (18.6–27.2)a 39.9 (35.2–43.6)a 0.571 (0.45–0.72)a P-value Environment 1.1 × 10⁻³⁴ 5.5 × 10⁻²⁴ 2.8 × 10–38 2.5 × 10⁻⁴ 0.025 0.028 0.16 Genotype 5.9 × 10⁻⁹ 2.6 × 10⁻¹⁴ 1.1 × 10⁻⁶ 6.1 × 10⁻⁹ 2.6 × 10⁻¹⁸ 3.8 × 10⁻¹⁹ 3.9 × 10⁻²³
The residuals to the scaling allocation relationships were calculated for the protein fractions for which r2 > 0.6 (i.e. GSPs, glutenins, gliadins, and α/β- and γ-gliadins). For each accession, these residuals quantified the difference between the actual quantity of N allocated to a given protein frac-tion and that predicted from Ntot or GSP values alone. For
the different protein fractions, the correlations of the residu-als among the environments (r 0.38–0.81) suggested that they are under genetic control. Thus, although the residuals were strongly correlated (r > 0.81) with the amount of a given pro-tein fraction as a percentage of Ntot or GSP (Supplementary
Fig. 1. Quantities of grain storage protein (GSP, A), gliadin (B), and glutenin (C) per grain versus the total quantity of N per grain (Ntot) for 196 accessions of the INRA worldwide wheat core collection grown in the field in 2006 in Clermont-Ferrand under high N conditions (CF+; black symbols and continuous line) and in 2007 in Le Moulon under high (LM+; red triangle and dot-dashed line) and low (LM–; blue squares and dashed line) N conditions. Lines are standard major axis regressions of log-transformed data (power function equation). Statistics of the regressions are given in Supplementary Table S1.
Fig. 2. Allometric relationships between the quantities of grain storage protein (GSP, A), gliadin (B), and glutenin (C) per grain versus the total quantity of N per grain (Ntot) for 163 (A), 143 (B), and 172 (C) accessions of the INRA worldwide wheat core collection. Only accessions for which the P-value of the allometric relationship was <0.3 and the range of variation of the protein fractions across the three environments was >3 × the coefficient of variation (or >1.5 × for gliadins) are plotted. Lines were fitted to log-transformed data (power function equation) using standard major axis regressions. Medians and quantiles of the scaling coefficients and exponents are given in Table 3.
Table S5 and Supplementary Data S1), they were used as variable traits in the association study.
Genome wide association of GSP parameters
All of the 38 variables described above were included in the association analysis. The population structure explained 2–14% of the phenotypic variability, depending on the variable, although for GPC it explained as much as 25% of the variability. Because most of the variables were cor-related with each other, they were grouped together, giving 11 groups of variables (Fig. 4 and Supplementary Data S1).
The GDM, GPC, and Ntot groups each consisted of only one variable. The qFRA group consisted of the quantities per grain of GSP, gliadin, and glutenin, qGli the quantities per grain of the four gliadin classes, and qGlt the quantities per grain of the two types of glutenin subunits. In SPC, the pro-portions of GSP, gliadin, and glutenin in Ntot, the gliadin to glutenin ratio, and the residuals to the allocation relation-ships for these fractions were groups. cGli consisted of the proportions of gliadin classes in total GSP and total glia-din and the residuals to the allocation relationships for α/β- and γ-gliadins and cGlt the proportion of glutenin subunits in total GSP and the glutenin fraction. The ASC and ASE
Table 4. Glutenin and gliadin composition for 196 wheat accessions grown in the field in 2006 at Clermont-Ferrand under high N condition and in 2007 at Le Moulon under high and low N conditions
Values are median (5–95% quantile range). LMW-GS, low-molecular-weight glutenin subunits; HMW-GS, high-molecular-weight glutenin subunits, GSP, grain storage protein; CF, Clermont-Ferrand; LM, Le Moulon; +, high N condition; –, low N condition. P-values from the Kruskal– Wallis rank sum test are given for the environment and genetic effects. Different letters within a column indicate significantly different values (P < 0.01) in the Behrens–Fisher post-hoc test.
Environment LMW-GS HMW-GS ω5-Gliadin ω1,2-Gliadin α/β-Gliadin γ-Gliadin
Quantity of N per grain (mg N grain–1)
CF+ 0.209 (0.149–0.317)a 0.187 (0.135–0.264)a 0.008 (0.002–0.017)a 0.022 (0.011–0.043)a 0.120 (0.076–0.183)a 0.084 (0.060–0.119)a LM+ 0.264 (0.182–0.377)b 0.165 (0.107–0.231)b 0.006 (0.002–0.012)b 0.019 (0.010–0.035)b 0.110 (0.074–0.164)a 0.111 (0.077–0.146)b LM– 0.200 (0.126–0.285)a 0.133 (0.083–0.197)c 0.004 (0.001–0.010)c 0.012 (0.005–0.026)c 0.081 (0.050–0.125)b 0.092 (0.058–0.131)a P-value Environment 7.3 × 10⁻³⁰ 1.5 × 10⁻³² 4.6 × 10⁻²² 4.2 × 10⁻³³ 2.5 × 10⁻³⁴ 1.2 × 10⁻²³ Genotype 5.3 × 10⁻⁷ 0.056 9.6 × 10⁻¹³ 2.5 × 10⁻¹² 4.4 × 10⁻¹¹ 8.8 × 10⁻¹⁶
Percentage of total grain storage protein (% GSP)
CF+ 33.8 (25.6–41.9)a 29.5 (20.6–36.8)a 1.2 (0.3–2.4)a 3.4 (1.9–5.8)a 18.8 (14.6–23.7)a 13.1 (10.8–16.7)a LM+ 39.5 (29.6–47.8)b 24.1 (15.7–33.7)b 0.9 (0.3–1.7)b 2.8 (1.7–4.7)b 16.5 (12.5–21.0)b 15.9 (13.4–18.7)b LM– 37.8 (29.4–48.1)b 25.6 (17.1–34.1)b 0.8 (0.3–1.8)b 2.25 (1.3–4.1)c 15.5 (12.0–20.3)c 17.2 (14.5–20.3)c P-value Environment 3.5 × 10⁻²² 5.8 × 10⁻²⁰ 3.8 × 10⁻¹⁴ 1.1 × 10⁻²³ 4.8 × 10⁻²⁵ 9.3 × 10–63 Genotype 9.0 × 10⁻⁴ 0.014 1.8 × 10⁻¹⁶ 1.3 × 10⁻¹⁸ 1.5 × 10⁻¹⁷ 0.076
Ratio of HMW-GS to LMW-GS ω5-Gliadin (% of total gliadin) ω1,2-Gliadin (% of total gliadin) α/β-Gliadin (% of total gliadin) γ-Gliadin (% of total gliadin) CF+ 0.88 (0.51–1.44)a 3.10 (0.83–6.44)a 9.1 (5.9–15.8)a 51.3 (41.2–58.1)a 35.8 (28.8–43.2)a LM+ 0.60 (0.35–1.15)b 2.45 (0.71–4.86)b 7.5 (4.9–12.7)b 45.7 (36.0–52.1)b 44.1 (37.6–50.4)b LM– 0.68 (0.37–1.10)b 2.12 (0.77–4.78)b 6.3 (3.9–10.7)c 43.4 (35.1–50.1)c 47.8 (41.2–54.3)c P-value Environment 1.5 × 10⁻²³ 2.6 × 10⁻¹² 3.6 × 10⁻²⁶ 2.9 × 10–40 3.2 × 10–74 Genotype 0.042 3.3 × 10⁻¹⁹ 1.0 × 10⁻¹⁷ 1.1 × 10⁻¹¹ 0.35
Table 3. Scaling exponents and coefficients of the allometric relationships between the quantity of grain storage protein, gliadin, and glutenin as quantity per grain and percentage of total grain N
Values are median (5–95% quantile range) for 163, 143, and 172 wheat accessions for GSPs, gliadins, and glutenins, respectively. GSP, grain storage protein; Ntot, percentage of total grain N. In calculating the mean and quantiles, accessions were only included if the P-value of
the allometric relationship was <0.3 and the range of variation of the protein fractions across the three environments was >3 × (or >1.5 × for gliadins) the coefficient of variation. For each accession, standard major axis regressions were fitted across the three environments on log-transformed data. The probabilities (P-values) that the scaling exponents or coefficients are not significantly different among the accessions are given. Fitted regressions are shown in Fig. 3.
Scaling exponent (dimensionless) Scaling coefficient (mg grain–1)
GSP vs. Ntot Gliadin vs. Ntot Glutenin vs. Ntot GSP vs. Ntot Gliadin vs. Ntot Glutenin vs. Ntot
1.08 (0.81–1.40) 1.20 (0.66–1.78) 1.05 (0.75–1.53) 0.637 (0.573–0.675) 0.233 (0.202–0.269) 0.403 (0.353–0.444)
P-value 0.98 0.33 0.99 <0.001 <0.001 <0.001
groups consisted of the allometric scaling coefficients and exponents, respectively, for GSPs, gliadins, and glutenins. The 196 accessions were genotyped using 873 genetic mark-ers genome wide (Bordes et al., 2011).
Two associated markers were considered as belonging to the same associated locus/region when they were less than 1 cM apart or shared at least one associated group and were less than 3 cM apart. Altogether, 74 loci associated with one or more groups of variables were identified throughout
the genome (Fig. 4 and Supplementary Data S1). Forty-four chromosomal regions modified the proportions or allocation coefficients of the gliadins or glutenins and their respective classes or subunits. Among these regions, eight were specifically associated with glutenin composition and seven with gliadin composition, while only five regions, including the 1RS.1BL translocation region (to be dis-cussed further), were associated with both gliadin and glu-tenin composition. Three regions on chromosomes 3AL,
Fig. 3. Quantities of high- (HMW-GS, A) and low- (LMW-GS, B) molecular-weight glutenin subunits, and ω5- (C), ω1,2- (D), α/β- (E), and γ-gliadins (F) per grain versus the quantity of grain storage protein (GSP) per grain for 196 accessions of the INRA worldwide wheat core collection grown in the field in 2006 at Clermont-Ferrand under high N conditions (CF+; black symbols and continuous line) and in 2007 at Le Moulon under high (LM+; red triangle and dot-dashed line) and low (LM–; blue squares and dashed line) N conditions. In C and D, insets show the data with expanded x and y axes. Lines are standard major axis regressions fitted to log-transformed data (power function equation). Statistics of the regressions are given in Supplementary Table S2.
5BS, and 7BL were associated with the scaling exponent group, but not with any other group of variables. These regions were only associated with the scaling exponent of the glutenin–Ntot relationship. Nine regions were associ-ated with the scaling coefficients, but only two regions on 3BS and 7BS were specifically associated with this group of variables.
As illustrated for the regions shown in Table 5, gliadin and glutenin compositions appeared to be regulated differently.
For glutenins, the loci on 3DL and 7DS that strongly affected the LMW-GS to HMW-GS ratio also had an effect on the percentages of GSP and glutenin in Ntot, and the scaling coef-ficient of the glutenin–Ntot relationship. In contrast, the loci strongly associated with the proportions of gliadin classes in total GSP or gliadin, for example, markers wPt8412 and wPt5408 on 6BS, were distinct from those affecting the pro-portion of total gliadin in Ntot, in particular marker cfd43 on 2DS.
Fig. 4. Results of genetic mapping in 196 accessions of the INRA worldwide wheat core collection with 883 polymorphic markers for genome-wide screening and 195 polymorphic markers in 51 candidate genes for candidate gene association, 6 glutenin genes and 3 grain hardness genes for 38 variables in 11 groups related to grain protein composition. Approximate genetic distances (cM) are shown on the left of the chromosomes and the names of the markers on the right. Vertical bars on the left of the marker names indicate markers that were mapped at the same position. The positions of centromeres on chromosomes are indicated in red. GSP loci are indicated on the right of group 1 and 6 chromosomes. For clarity, in high-marker density regions some markers are not shown on the map. Chromosome 6D is not shown as no association was found for this chromosome. Groups of variables are: GDM, single grain dry mass; GPC, grain protein concentration; Ntot, total quantity of N per grain; qFRA, quantities of GSP, gliadin, or glutenin fractions per grain; qGli, quantities of each gliadin class per grain; qGlu, quantities of each glutenin subunit per grain; SPC, quantities of GSP, gliadin, or glutenin as percentages of Ntot, gliadin to glutenin ratio, and residuals to the relationships between the quantities of GSP, gliadin, or glutenin per grain and Ntot; cGli, quantities of each gliadin class as percentages of GSP or total gliadin, and residuals to allometric relationships between the quantities of α/β-gliadin or γ-gliadin per grain and the quantity of GSP per grain; cGlt, percentages of each glutenin subunit in GSP and HMW-GS to LMW-GS ratio; ASC, allometric scaling coefficients of the relationships between the quantities of GSP, gliadin, or glutenin per grain and Ntot; ASE, allometric scaling exponent of the relationships between the quantity of GSP, gliadin, or glutenin per grain and Ntot. Association maps including all the markers and the associated variables are given in Supplementary Data S1.
Association with grain storage protein loci and genes Gliadin and glutenin genes occur in several tightly linked gene clusters, termed blocks, on the homologous groups one and six chromosomes, with intrablock recombination being rare (Fig. 4) (Shewry and Halford, 2003). HMW-GS genes are encoded at the three homeologous Glu-1 loci, while genes encoding most of the LMW-GS and gliadins are tightly clustered at the three homeologous Glu-3 and Gli-1 loci, respectively. On chromosome 1AS, six markers mapping near Gli-A1 and Glu-A3 loci were associated with GPC, GSP quantity, composition, and allocation, and one marker near Gli-A3 was associated with GPC. Several mark-ers on 1BS were associated with GSP composition with r2 values up to 35%. These markers defined three zones: an interval between markers wPt7094 and wPt3753 encom-passing the Gli-B1 and Glu-B3 loci; an approximately 1.5-cM region between wPt1911 and wPt1684 encompassing the Gli-B3 locus; and a zone between gwm413 and cfd65.
Eighteen accessions from the panel bear a 1RS.1BL translo-cation (Bordes et al., 2011), where the whole or part of the wheat chromosome 1BS is replaced by the whole or part of the rye (Secale cereale L.) chromosome 1RS. None of the associations in the latter two zones or with markers wPt0328 and wPt3753 in the former zone were significant when the accessions bearing the 1RS.1BL translocation were removed from the analysis. On group six chromosomes, two markers associated with gliadin composition were mapped near Gli-A2 and Gli-B2.
This work developed SNP markers in five HMW-GS and one LMW-GS genes. The HMW-GS genes Glu-B.1.1 and Glu-B1.2 were associated with the HMW-GS to LMW-GS ratio and the percentage of HMW-GS in total GSP. Glu-D1.2 was associated with GPC and the percentage of gliadin in Ntot. A marker mapped in the vicinity of Glu-D1.2 and the TF gene SPA-D was associated with GPC, the quantity of GSP, gliadin, glutenin, and LMW-GS per grain, the percentage of
Table 5. Percentage of variance explained and P-values for the genetic associations between grain protein composition variables and the markers cfd43, wPt5506, wPt8412/wPt5408, and wPt5765 on chromosomes 2D, 3D, 6B, and 7D, respectively
Associations were calculated using multilocal data analysed with a general linear model including genotype and environment effects and their interactions. GSP, grain storage proteins; HMW-GS, high-molecular-weight glutenin subunit; LMW-GS, low-molecular-weight glutenin subunit. GDM, single grain dry mass; GPC, grain protein concentration; ASC, allometric scaling coefficient; Ntot, total quantity of N per grain;
SPC, quantities of GSP, gliadin, or glutenin as percentages of Ntot, gliadin to glutenin ratio, and residuals to the relationships between the
quantities of GSP, gliadin, or glutenin per grain and Ntot; cGli, quantities of each gliadin class as percentages of GSP or total gliadin, and
residuals to allometric relationships between the quantities of α/β-gliadin or γ-gliadin per grain and the quantity of GSP per grain; cGlt, percentages of each glutenin subunit in GSP and HMW-GS to LMW-GS ratio; qGlt, total quantity of glutenin per grain. Only associations with
P < 0.001 are shown.
Chromosome Marker Group of variables
Variable P-value Percentage of variance
explained (r2, %)
2DS cfd43 SPC Gliadin to glutenin ratio 2.9 × 10⁻⁴ 9.7
Gliadin (% of Ntot) 2.5 × 10⁻⁵ 10.5
3DL wPt5506 SPC GSP (% of Ntot) 1.9 × 10⁻¹² 13.6
Residuals of GSP vs. Ntot (mg N grain–1) 6.4 × 10⁻¹¹ 11.6
Glutenin (% of Ntot) 2.0 × 10⁻⁷ 9.4
Residuals of glutenin vs. Ntot (mg N grain–1) 2.4 × 10⁻⁸ 7.7
cGlt HMW-GS to LMW-GS ratio 5.0 × 10⁻¹¹ 8.9
LMW-GS (mg N grain–1) 1.2 × 10⁻⁶ 6.2
LMW-GS (% of GSP) 7.9 × 10⁻⁹ 6.7
HMW-GS (% of GSP) 7.7 × 10⁻⁷ 5.3
cGli Residuals of α/β-gliadin vs. GSP (mg N grain–1) 2.9 × 10⁻⁴ 5.4
ASC Scaling coefficient of GSP vs. Ntot (mg N grain–1) 5.4 × 10⁻⁹ 19.3
Scaling coefficient of glutenin vs. Ntot (mg N grain–1) 8.1 × 10⁻⁵ 8.4
6BS wPt8412/wPt5408 cGli ω1,2-gliadin (% of GSP) 5.5 × 10⁻⁴ 4.2
ω1.2-gliadin (% of gliadin) 1.7 × 10⁻⁵ 6.6
α/β-gliadin (% of GSP) 2.6 × 10⁻⁶ 7.2
α/β-gliadin (% of gliadin) 7.4 × 10⁻⁸ 8.8
Residuals of α/β-gliadin vs. GSP (mg N grain–1) 2.6 × 10⁻⁶ 7.2
γ-gliadin (% of gliadin) 7.7 × 10⁻⁵ 2.8
7DS wPt5765 SPC GSP (% of Ntot) 4.4 × 10⁻¹¹ 12.6
Glutenin (% of Ntot) 5.0 × 10⁻⁷ 9.1
Residuals of glutenin vs. Ntot (mg N grain–1) 4.9 × 10⁻⁶ 7.4
qGlt LMW-GS (mg N grain–1) 4.0 × 10⁻⁴ 3.5
cGlt HMW-GS to LMW-GS ratio 1.4 × 10⁻⁸ 7.1
LMW-GS (% of GSP) 3.4 × 10⁻⁶ 4.7
HMW-GS (% of GSP) 1.2 × 10⁻⁴ 3.5
ASC Scaling coefficient of GSP vs. Ntot (mg N grain–1) 1.8 × 10⁻⁵ 11.0
Scaling coefficient of glutenin vs. Ntot (mg N grain–1) 2.9 × 10⁻⁴ 7.2
HMW-GS in GSP, and the HMW-GS to LMW-GS ratio. The LMW-GS gene Glu-A3 was associated with the percentage of glutenin in Ntot, the scaling coefficient of the glutenin– Ntot allometric relationship was calculated for each accession across environments, and the residual to this relationship was calculated for all accessions.
Candidate gene association for grain storage protein composition
For candidate gene association, this work used 167 SNPs in 51 candidate genes: 13 wheat orthologues of the barley TFs controlling GSP gene expression, 19 TF genes whose expres-sion reaches a maximum at the same time as GSP genes, six genes controlling grain development, and 13 genes encoding N and S assimilation or metabolism enzymes (Supplementary Table S6). Eleven of these candidate genes were associated with at least one group of variables. In addition, six loci that did not include a candidate gene were in strong linkage dis-equilibrium with a candidate gene.
Six associated loci were strongly linked with six of the 13 wheat orthologues of the barley GSP transcrip-tion regulatranscrip-tion network (Rubio-Somoza et al., 2006a, b;
Moreno-Risueno et al., 2008) for which polymorphic SNPs were found (Supplementary Table S6). MCB1-B on 1BL was associated with the quantity of LMW-GS per grain (Fig. 4). MCB1-A on 1AL and GAMYB-D on 3DL were associated with the HMW-GS to LMW-GS ratio and the percentage of HMW-GS in GSP. MCB1-A was also associ-ated with Ntot and the quantity of GSP and γ-gliadin per grain. SPA-B was strongly associated (r2 > 17%, P < 4 × 10– 5) with the quantity of ω5-gliadin per grain in all environ-ments and with the proportion of ω5-gliadin in GSP in two environments (Supplementary Data S1). Moreover, when N was limiting (LM–), SPA-B was also strongly associated (r2 = 18.7%, P = 8 × 10⁻⁵) with the HMW-GS to LMW-GS ratio and the quantity of LMW-GS per grain and as a percentage of GSP. A marker associated with GPC, Ntot, and the quantities of GSP, total gliadin, γ-gliadin, and LMW-GS per grain was mapped on 5BL in the vicinity of PBF-B (Fig. 4). SAD-A on 6AL was strongly linked with markers associated with GPC and the percentage of GSP in Ntot.
Based on their expression pattern during grain develop-ment (Romeuf, 2010), 19 putative candidate TFs and his-tone- and chromatin-modifying genes were also studied (Supplementary Table S6). DOF19-B on 1BL was associated with Ntot and the quantity of GSP per grain. DREB1-B on 3BS was specifically associated with the scaling coefficient of the gliadin–Ntot relationship (Supplementary Data S1). Moreover, in LM+, DREB1-B was also associated with the percentage of GSP in Ntot (r2 = 7.6%, P = 6 × 10⁻⁵) and the residuals of the GSP–Ntot (r2 = 6.8%, P = 2 × 10⁻⁴) and glia-din–Ntot (r2 = 9.9%, P = 8 × 10⁻⁶) relationships (Supplementary
Data S1). On 4BL PcG3-B was associated with the quantity of γ-gliadin per grain. Finally, NAC22-B and NAC27-B on 7BL and 5BS, respectively, were in strong linkage disequilib-rium with two markers associated with the scaling exponent
of the glutenin–Ntot relationship. Under low N conditions in LM–, NAC22-B was also associated with the residuals to the glutenin–Ntot relationship and the gliadin to glutenin ratio (Supplementary Data S1). The region on 3BS that was very significantly associated with glutenin composition (Table 5) was in strong linkage disequilibrium with both Dr1-D and GAMYB-D.
Six key genes controlling grain development were also analysed, among which only SAL-B showed significant asso-ciations with Ntot and the quantity of GSP, gliadin, glutenin, α/β- and γ-gliadins, and LMW-GS per grain. Of the 13 N and S assimilation/metabolism genes analysed, only FdGOGAT-B (Fig. 4), DeK-A, and DeK-B (Fig. 4) showed significant and consistent cross-environment associations. They were all associated with GPC. FdGOGAT-B was also associated with Ntot and the quantities of GSP, gliadin, glutenin, and α/β- and γ-gliadins per grain. NAM-B1-B, which has been demon-strated to play a key role in determining GPC in wheat (Uauy
et al., 2006), was associated with neither GPC nor with any of the other variables analysed here. But, the association with the marker in this gene, which discriminates between func-tional and non-funcfunc-tional alleles (Hagenblad et al., 2012), could not be tested as the frequency of functional allele was only 0.01. However, a marker not far from NAM-B1-B was strongly associated with GPC (r2 > 8.1%, P = 4 × 10⁻⁴) and Ntot (r2 > 17%, P = 8 × 10⁻⁵). GDH2-D on 3DL was in linkage disequilibrium with a marker associated with GPC. On chro-mosome 3BS, GAD1-B was in strong linkage disequilibrium with a marker associated with GDM and Ntot, the quantity of α/β-gliadin per grain, and the scaling coefficient of the glu-tenin–Ntot allometric relationship.
Discussion
Wheat GPC and GSP composition are the main determinants of dough functional properties (MacRitchie, 1999). While much work has been done to find genetic factors affecting these properties, very few studies have directly investigated the genetic control of the different proteins responsible for dough quality (Guillaumie et al., 2004; Charmet et al., 2005; Zhang
et al., 2010). The current work used association mapping to analyse the genetics of wheat GPC combining genome-wide association with 873 genetic markers and candidate gene association with 51 candidates, including genes encoding 36 TFs and histone and chromatin modifying proteins. Overall, this allowed the identification of 44 loci associated with GSP composition and allocation. Of these, four included candi-date genes and five were in strong linkage disequilibrium with candidate genes.
Loci associated with dough characteristics as measured by mixograph tests have previously been identified using the INRA worldwide wheat core collection (Bordes et al., 2011), which includes the 196 accessions used in this study. Loci on chromosomes 3DL and 7DS that were the most strongly associated with glutenin composition in this study were also strongly associated with dough characteristics in Bordes et al. (2011). Most of the other genomic regions that were strongly
associated with dough characteristics were also associated or in linkage disequilibrium with markers associated with GSP composition in the current work. Several genomic regions controlling GSP synthesis were newly discovered. Somewhat unexpectedly, the results indicate that gliadin and glutenin compositions are genetically controlled by distinct loci and processes. The candidate TF genes were preferentially asso-ciated with GSP composition and grain N allocation traits, while N and S assimilation/metabolism genes were preferen-tially associated with GPC and/or Ntot.
Gliadin and glutenin compositions are controlled by distinct loci
The proportion of gliadin and glutenin in Ntot and the gliadin to glutenin ratio were not modified by the environment, while the proportions of gliadin classes and glutenin subunits in total GSP or respectively in total gliadins or total glutenins showed large environmental variations. Therefore, the regu-lation of GSP composition in response to the environment differs according to whether the allocation considered is of grain N between glutenin and gliadin or of GSP between glu-tenin subunits and gliadin classes. In this context it is there-fore relevant to analyse independently the SPC, cGli and cGlt groups of variables. This work hypothesized that the genetic control of the residuals to the scaling relationships were partly independent from that of the fraction proportion. This was confirmed for some fractions by the fact that associations were found with the residual independently of the fraction proportion.
Gliadin (group cGli) and glutenin (group cGlt) compo-sitions were associated with 14 and 18 loci, respectively. Gliadin and glutenin promoters share several cis-motifs known to interact with conserved TFs controlling GSPs in cereals and dicots (van Herpen et al., 2008; Verdier and Thompson, 2008; Fauteux and Stromvik, 2009; Pistón et al., 2009). Furthermore, van Herpen et al. (2008) showed that a α-gliadin gene promoter had the same expression pattern as an LMW-GS gene promoter. However, this work found that the only loci associated with both gliadin and glutenin com-positions were on 1AS and 1BS, where several gliadin and glu-tenin genes are located, and to a lesser extent the 3DL locus, which was strongly associated with glutenin composition and weakly associated with the residuals to the α/β-gliadin-GSP allometric relationship. Thus, the trans-regulation of gliadin classes and glutenin subunits appears to be controlled by dif-ferent loci. In good agreement with these results, nucleotide polymorphisms in the promoter region of SPA-A were shown to modify the scaling coefficient of the gliadin–Ntot relation-ship, while the scaling parameters of the glutenin–Ntot rela-tionship was not modified (Ravel et al., 2009).
The processes regulating gliadin and glutenin compositions also seem to operate differently as the loci that affected glu-tenin composition the most were also associated with the pro-portion of total glutenin in Ntot, but only one locus (on 1BS close to Gli-B1) was associated with both gliadin composition and the proportion of gliadin in Ntot. These results suggest that the mechanisms regulating HMW-GS and LMW-GS are
more independent of each other than those regulating the dif-ferent gliadin classes. In the promoter region of the wheat HMW-GS gene that has been analysed, the endosperm box has a structure different from those found in wheat LMW-GS and gliadin genes and in other cereal GSP genes (Norre et al., 2002). Such differences might explain why there is a smaller degree of co-regulation of LMW-GS and HMW-GS than of the gliadin classes. Altogether, these results strongly suggest that the genes regulating glutenin and gliadin compositions are mostly distinct and operate differently.
Parameters of the ecophysiological model of grain nitrogen allocation were associated with several candidate transcription factors
A previous genetic analysis showed that two of the three QTL for the quantity of gliadin classes per grain and four of the six QTL for the quantity of glutenin subunits per grain colocated with QTL for the rate of grain N accumulation (Charmet
et al., 2005). GSP composition can be predicted from scaling laws of grain N allocation (Martre et al., 2003, 2006b), which integrate the effects of the rate and duration of N accumula-tion on GSP composiaccumula-tion (Triboi et al., 2003). The exponent of the scaling relationship represents the relative variation of a protein fraction with Ntot changes across different environ-ments, while the multiplicative coefficient can be interpreted as the proportion of the fraction in Ntot if it varied propor-tionally to Ntot. By construction, these parameters integrate the response of GSP genes to the environment (Aguirrezábal
et al., 2009), which means they might be solely genetically controlled. The picture that emerges is that the gene regula-tory network involved in the control of the synthesis of GSPs is coordinated such that the grain reacts to the environment in a predictable manner, yielding a meta-mechanism as defined by Tardieu (2003) at the grain level. Analysing the genetic determinants of the parameters of these relationships should improve the understanding of how cereal GSP accumulation is regulated in response to the environment.
The scaling exponents for the allocation of Ntot to gliadins and glutenins were similar across environments, but showed a large genetic variability. Only for gliadins was the scaling coefficient modified by the environment, and the scaling coefficients of gliadins and glutenins showed no significant genetic variability. None of the scaling coefficients and expo-nents were associated with the same loci, suggesting that their genetic control is different.
The scaling coefficients were strongly correlated (r > 0.75) with the proportions of the corresponding protein fractions in Ntot and, as a consequence, of the 12 loci associated with the scaling coefficients, eight were associated with both these types of variables. Of the four remaining loci, two were asso-ciated only with the scaling coefficients. Interestingly, one of the latter markers was in the candidate TF gene DREB1-B, which was associated with the scaling parameters of the gliadin–Ntot relationship. Although its role in abiotic stress responses in wheat is not clear yet, DREB1 is a putative dehy-dration response element-binding TF induced by cold, salin-ity, and drought (Shen et al., 2003b).
In contrast with the scaling coefficients, the scaling expo-nents were not correlated with any other variable, correlat-ing only among themselves. They were always associated with loci independently of other variables. Only three loci were found to be associated with this model parameter, and all with the glutenin–Ntot relationship parameter. The NAC22-B gene was mapped on chromosome 7BL at the same position as one marker associated with this parameter and a second locus associated with this parameter was close to another NAC TF gene (NAC27-B) on chromosome 5BS. In silico inference of transcription regulation networks based on expression data has shown that two NAC TF (NAC27 and NAC18) are highly connected to the TF network that controls GSP gene expression (Vincent et al., 2011). blastx results indicated that NAC22-B and NAC27-B have >48% sequence identity and >97% sequence coverage with rice LOC_Os01g29840 and LOC_Os01g01470, respectively. The same analysis on Arabidopsis thaliana sequences showed >65% sequence identity and >45% sequence coverage with ANAC058 and ANAC087, respectively. The function of these NAC TFs is not known yet, but in all three species they are highly expressed in the grain during the phase of GSP accumulation (Ooka et al., 2003; Romeuf, 2010).
Two loci associated with scaling coefficients and all the markers associated with scaling exponents were not asso-ciated with any other variable. This means that using the parameters of a model that are independent of the environ-ment allowed this work to identify a level of genetic regu-lation of GSP synthesis that could not be detected through basic composition data.
cis- and trans-regulating loci for GSP composition
Differences in GSP composition among accessions can be caused by natural variability in the number of GSP genes at each locus (Dong et al., 2010) or by sequence polymor-phisms in their promoters (van Herpen et al., 2008; Pistón
et al., 2009), which are cis-determinants of GSP composition. Genetic variability in TF genes trans-regulating GSP gene expression (Ravel et al., 2009) or controlling grain develop-ment (Verdier and Thompson, 2008) or in enzymes control-ling N and S assimilation/metabolism (Galili and Höfgen, 2002) can also explain changes in GSP composition.
Loci in strong linkage disequilibrium with some of the genes coding for GSPs or including the genes themselves were associated with GSP quantity, composition, and allocation. For some of the GSP loci, no association was detected, most likely because of the lack of suitable polymorphism mark-ers. Other studies have demonstrated that genetic variability in the structural GSP genes has an effect on the quantity and composition of GSPs. In particular, Charmet et al. (2005)
found that a region encompassing the Glu-B1 locus was asso-ciated with the quantity of Glu-A1, Glu-D1x-y, and Glu-B1x per grain, and Zhang et al. (2010) showed that the Glu-A3, Glu-B1, and Glu-D1 loci were associated with the proportion of glutenin in flour. However, in all these studies, cis-regulat-ing loci explained only part of the variability in GSP compo-sition. Several of the loci associated with GSP composition
are not linked to structural GSP genes which suggests that trans-regulation mechanisms also play an important role in controlling GSP composition.
There is currently a consensus on the predominant role of transcriptional regulation in controlling GSP accumulation in both cereals and dicots (Verdier and Thompson, 2008;
Weber et al., 2010), so this work included 32 TF genes in the candidate gene association approach. Among the 13 wheat orthologues of barley TFs that control GSP gene expres-sion (Rubio-Somoza et al., 2006a, b), SPA-B, MCB1-A, and GAMYB-D were associated with either glutenin or gliadin composition and MCB1-B was associated with the quanti-ties of glutenin and gliadin. SPA-B was associated with the proportions and quantities of gliadin classes which is in agreement with previous reports of SPA-A and SPA-B hap-lotypes being associated with dough viscoelasticity (Ravel
et al., 2009). Genetic mapping in barley has shown that PBF is associated with GPC (Haseneyer et al., 2010), and in the current work PBF-B was in strong linkage disequilibrium with a marker associated with GPC. Among the 19 TFs that reach maximal expression at the same time as GSP genes, DREB1-B was associated with the scaling coefficient of the gliadin–Ntot relationship and NAC-22-B and NAC-27-B were in strong linkage disequilibrium with markers associated with the scaling exponent of the glutenin–Ntot relationship. It is interesting to note that TFs known to control GSP expression in cereals by binding GSP gene promoters were associated with GSP composition, while TFs with unknown functions were associated with the grain N allocation parameters, indic-ative of both direct and indirect transcriptional regulation for GSP composition and allocation.
This study investigated the possible regulation of GSPs by assimilate availability. Of 13 candidate genes coding for enzymes involved in the assimilation or metabolism of N and S, Fd-GOGAT, DeK-A, and DeK-B were associated, and GDH2-D and GAD1-B were in strong linkage disequilibrium with a marker associated, with GPC and/or Ntot. This may suggest that enzymes involved in N and S assimilation and metabolism mainly affect GSP quantity, but not relative pro-portions of GSP. However, GAD1-B was also in strong link-age disequilibrium with a marker associated with the scaling coefficient of the glutenin– Ntot allometric relationship. Identification of potential functional clusters
Part of the preliminary work of this study was to identify SNPs in candidate genes and map these genes on the 21 chro-mosomes of the wheat genome. This led to the mapping of 35 candidate TF genes by linkage disequilibrium. NAM-B1-B was mapped on chromosome 6BL, although previous stud-ies have shown that in the tetraploid specstud-ies Triticum tur-gidum ssp. durum it is located at a centromeric position on 6BS (Uauy et al., 2006). Similarly, the SNP marker within DREB1-B has been previously mapped on chromosome 3BL close to marker gwm566 (Wei et al., 2009). In the current work using Chinese Spring ditelosomic lines, these two mark-ers were mapped close together on 3BS (data not shown), so the three homeologous copies of DREB1 were assigned