Bmi1 Promotes Erythroid Development
Through Regulating Ribosome Biogenesis
The MIT Faculty has made this article openly available.
Please share
how this access benefits you. Your story matters.
Citation
Gao, Rui, Sisi Chen, Michihiro Kobayashi, Hao Yu, Yingchi Zhang,
Yang Wan, Sara K. Young, et al. “Bmi1 Promotes Erythroid
Development Through Regulating Ribosome Biogenesis.” Stem
Cells 33, no. 3 (February 17, 2015): 925–938.
As Published
http://dx.doi.org/10.1002/stem.1896
Publisher
Wiley Blackwell
Version
Author's final manuscript
Citable link
http://hdl.handle.net/1721.1/99372
Terms of Use
Creative Commons Attribution-Noncommercial-Share Alike
Bmi1 promotes erythroid development through regulating
ribosome biogenesis
Rui Gaoa, Sisi Chenb, Michihiro Kobayashia, Hao Yua, Yingchi Zhangc, Yang Wanc, Sara K. Youngb, Anthony Soltisd, Ming Yue, Sasidhar Vemulaa, Ernest Fraenkeld, Alan Cantore, Yevgeniy Antipinf, Yang Xug, Mervin C. Yodera, Ronald C. Wekb, Steven R. Ellish, Reuben Kapura, Xiaofan Zhuc, and Yan Liua,b,*
aDepartment of Pediatrics, Herman B Wells Center for Pediatric Research, Indiana University School of Medicine, Indianapolis, Indiana 46202
bDepartment of Biochemistry and Molecular Biology, Indiana University School of Medicine, Indianapolis, Indiana 46202
cState Key Laboratory of Experimental Hematology, Institute of Hematology & Blood Disease Hospital, Chinese Academy of Medical Sciences & Peking Union Medical College, Tianjin, China dDepartment of Biological Engineering, Massachusetts Institute of Technology, Cambridge, MA 02139
eChildren’s Hospital Boston and Dana-Farber Cancer Institute, Harvard Medical School, Boston, MA 02115
fMemorial-Sloan Kettering Cancer Center, New York, NY 10065
gDivision of Biological Sciences, University of California at San Diego, San Diego, CA 92093 hDepartment of Biochemistry and Molecular Biology, University of Louisville, Louisville, KY 40292
Abstract
While Polycomb group protein Bmi1 is important for stem cell maintenance, its role in lineage commitment is largely unknown. We have identified Bmi1 as a novel regulator of erythroid development. Bmi1 is highly expressed in mouse erythroid progenitor cells and its deficiency impairs erythroid differentiation. BMI1 is also important for human erythroid development. Furthermore, we discovered that loss of Bmi1 in erythroid progenitor cells results in down-regulation of transcription of multiple ribosomal protein genes and impaired ribosome biogenesis. Bmi1 deficiency stabilizes p53 protein, leading to upregulation of p21 expression and subsequent G0/G1 cell cycle arrest. Genetic inhibition of p53 activity rescues the erythroid defects seen in the Bmi1 null mice, demonstrating that a p53-dependent mechanism underlies the pathophysiology of the anemia. Mechanistically, Bmi1 is associated with multiple ribosomal protein genes and may
*Correspondence: Yan Liu, Department of Pediatrics, Herman B Wells Center for Pediatric Research, Indiana University School of
Medicine, Indianapolis, Indiana 46202; [email protected].
Author contributions: R.G., S.C. and Y.L. contributed to design, experimental performance, interpretation and writing; M.K., H.Y.,
Y. Z., Y.W., S.Y., A.S., M.Y., and S. V. contribute to experimental performance; E. F., A.C., Y.X., M.C., Y.A., R. K., R. W., S. R.,
HHS Public Access
Author manuscript
Stem Cells. Author manuscript; available in PMC 2015 March 31.
Published in final edited form as:
Stem Cells. 2015 March ; 33(3): 925–938. doi:10.1002/stem.1896.
Author Manuscript
Author Manuscript
Author Manuscript
positively regulate their expression in erythroid progenitor cells. Thus, Bmi1 promotes erythroid development, at least in part through regulating ribosome biogenesis. Ribosomopathies are human disorders of ribosome dysfunction, including diamond blackfan anemia (DBA) and 5q- syndrome, in which genetic abnormalities cause impaired ribosome biogenesis, resulting in specific clinical phenotypes. We observed that BMI1 expression in human hematopoietic stem and progenitor cells (HSPCs) from patients with DBA is correlated with the expression of some ribosomal protein genes, suggesting that BMI1 deficiency may play a pathological role in DBA and other ribosomopathies.
Keywords
Bmi1; ribosome biogenesis; erythroid differentiation; p53; ribosomopathies
Introduction
Polycomb group proteins (PcGs) are epigenetic chromatin modifiers involved in stem cell maintenance and cancer development [1-3]. Biological and genetic studies indicate that PcG proteins exist in at least two separate protein complexes, Polycomb repressive complex 2 (PRC2) and Polycomb repressive complex 1 (PRC1), that act in concert to promote and maintain gene repression [2]. EZH2, the catalytically active component of PRC2, di- and trimethylates Lys27 of histone H3, a histone mark recognized by the PRC1 complex through the chromodomain of Polycomb that triggers ubiquitination of histone H2A at Lys119 by the E3 ubiquitin ligase Ring1B in PRC1 [4-6]. Polycomb group proteins (PcGs) regulate lineage choices during development and differentiation through binding and repressing the
promoters of hundreds of genes encoding proteins with roles in cell fate determination [1-3]. However, it is unclear how PcG proteins are displaced and recruited to different subsets of target genes during lineage commitment [3].
PcG proteins are key regulators of both hematopoietic stem cell maintenance and terminal differentiation [7-9]. The PRC2 complex regulates normal hematopoietic stem cell function in a developmental-stage-specific manner [10]. While Ezh2 is important for fetal
hematopoiesis [11], Ezh1 maintains the adult hematopoietic stem cell pool [12]. Polycomb group protein Bmi1 plays important roles in regulating hematopoietic stem cell self-renewal [13-14] and we showed that Bmi1 is a critical down-stream target of Akt signaling and Akt-mediated phosphorylation of Bmi1 inhibits HSC self-renewal [15]. Bmi1 is also important for lymphoid development [16]. Epigenetic changes have been implicated in regulating the induction of erythroid-specific genes during terminal erythropoiesis [17]. Ezh2-deficient embryos died of anemia because of insufficient expansion of hematopoietic stem and progenitor cells (HSPCs) and defective erythropoiesis in fetal liver [11]. However, the role of Bmi1 in mammalian erythroid development is largely unknown.
Ribosome biogenesis is important for erythroid development and impaired ribosomal function has been implicated in ribosomopathies [18], including Diamond-Blackfan anemia (DBA), a congenital bone marrow failure syndrome [19], and the 5q- syndrome, a subtype of myelodysplastic syndrome (MDS) [20]. In these disorders, genetic lesions in ribosomal
Author Manuscript
Author Manuscript
Author Manuscript
protein genes impair ribosome biogenesis, resulting in activation of the p53 tumor suppressor pathway, cell cycle arrest and defective erythropoiesis [19, 21]. While the developing erythrocytes are highly sensitive to suboptimal levels of ribosomal proteins [19], how ribosome biogenesis is regulated in erythroid precursors remains elusive. In this study, we have identified a critical role of Bmi1 in regulating erythropoiesis and ribosome biogenesis. Bmi1 deficiency down regulates multiple ribosomal protein genes, activates the p53 pathway and blocks erythroid differentiation. In addition, we demonstrated that Bmi1 associates with the promoter of some ribosomal protein genes and enhances their expression in erythroid precursors. Furthermore, we observed that BMI1 expression in human CD34+ cells from patients with DBA correlate with the expression of some ribosomal protein genes, suggesting that Bmi1 deficiency may play a pathological role in DBA and other
ribosomopathies.
Materials and methods
Mice
Bmi1-deficient mice were provided by Martin van Lohuizen (The Netherlands Cancer Institute, the Netherlands). The generation of p53R248W mice has been described previously
[22]. Wild type C57BL/6 (CD45.2) mice were purchased from the Jackson Laboratories. All mice were maintained in the Indiana University Animal Facility according to IACUC-approved protocols, and kept in Thorensten units with filtered germ-free air.
Human DBA patient samples
Bone marrow (BM) samples were collected after informed consent from healthy donors and patients with DBA using a protocol approved by the Institute of Hematology & Hospital of Blood Diseases Ethics Committee at the Chinese Academy of Medical Sciences & Peking Union Medical College.
Colony-forming unit (CFU) assays
Mononuclear cells obtained from mouse bone marrow were used for CFU-E and BFU-E assays. MethoCult 3234 (StemCell Technologies) containing 3U/mL rhEPO or containing 3U/mL rhEPO, 20 ng/mL rmIL-3, and 50 ng/mL rmSCF, (PeproTech) were used for CFU-E and BFU-E assays respectively. CFU-E colonies were scored on day 3 and BFU-E colonies were scored on day 8-10. For BFU-E assay of human CD34+ cells, infected cells were plated
in MethoCult H4435 medium (StemCell Technologies) and colonies were scored after 2 weeks.
Overexpression assays
Retroviral vectors were produced by transfection of Phoenix E cells with the MIGR1 control or MIGR1 full-length Bmi1 c-DNA plasmids, according to standard protocols. Mouse hematopoietic progenitor cells were infected with high-titer retroviral suspensions in the presence of 8 μg/mL polybrene (Sigma-Aldrich). Twenty-four hours after infection, the GFP-positive cells were sorted by FACS.
Author Manuscript
Author Manuscript
Author Manuscript
Generation of lentiviruses and infection of primary hematopoietic CD34+ cells
Normal human CB samples were collected with institutional approval. Lentiviral vectors expressing short hairpins against human BMI1 (CS-H1-shRNA-EF-1α-EGFP) and luciferase gene as a control were provided by Dr. Iwama at the Chiba University. Lentiviral particles were produced by transfection of 293T cells, according to standard protocols. After 24 hours of growth, CD34+ cells were transduced on retronectin (Takara)-coated non-tissue culture
plates with high-titer lentiviral concentrated suspensions in the presence of 8 μg/mL polybrene (Sigma-Aldrich). To induce erythroid differentiation, infected CD34+ cells were
maintained at 2 × 10⁵/mL in StemSpan SFEM containing EPO (6 IU/mL) and SCF (100
ng/mL) for 7 days. Then cells were harvested for flow cytometry and qPCR analysis.
Gene expression and Pathways Analyses
Transcript profiling of Pro-E cells and MEPs from WT and Bmi1-/- mice were analyzed by
Agilent Whole Mouse Genome Oligo Microarrays. Raw data will be available for download from Gene Expression Omnibus (http://ncbi.nlm.nih.gov/geo/, accession number x). Genes whose expressions are increased or decreased more than 2-fold in Bmi1-/- cells compared to wild-type cells are shown. The Microarray data were analyzed using the Ingenuity Pathways Analysis program (Ingenuity Systems, www.ingenuity.com); to identify the pathways that met the < or > 2-fold change cutoff and were associated with a canonical pathway in the Ingenuity Pathways Knowledge base were considered for the analysis [23]. The significance of the association between the data set and the identified canonical pathway was measured in 2 ways: (1) A ratio of the number of genes from the data set that map to the pathway divided by the total number of genes from the data set that map to the canonical pathway and (2) Fischer’s exact test, to calculate a p value determining the probability that the association between the genes in the data set and the canonical pathway is explained by chance alone.
ChIP assays
For ChIP assays, K562 cells were fixed with 1% (vol/vol) formaldehyde for 10 min at room temperature. ChIP assays were performed using the EZ-Magna ChIP A/G Kit (Millipore). Anti-Bmi1 antibody (Active Motif, AF27), Anti-Ring1b antibody (MBL International, D139-3), Anti-H3K9Ac antibody (Millipore, 07-942), Anti-H3K4me3 antibody (Millipore, 07-473), anti-H3K27me3 antibody (Millipore, 07-449), Anti-H2AK119ub1 antibody (Cell Signaling, D27C4) and normal mouse IgG were used for immunoprecipitation. ChIP DNA was then subjected to real-time PCR analysis using primers targeting different region of ribosomal protein gene promoters [23-24].
Polysome Analysis
Polysome analysis was performed as previous described [25-26]. Equal numbers of control shRNA or BMI1 shRNA virus-infected K562 cells were used.
Author Manuscript
Author Manuscript
Author Manuscript
Statistical analyses
Results from multiple experiments are expressed as the mean ± standard deviation (SD). Statistical significance (*P < 0.05, **P < 0.01, ***P < 0.001; NS, not significant) was determined by Student’s t test, one-way ANOVA or two-way ANOVA.
Results
Bmi1 regulates mouse erythroid differentiation
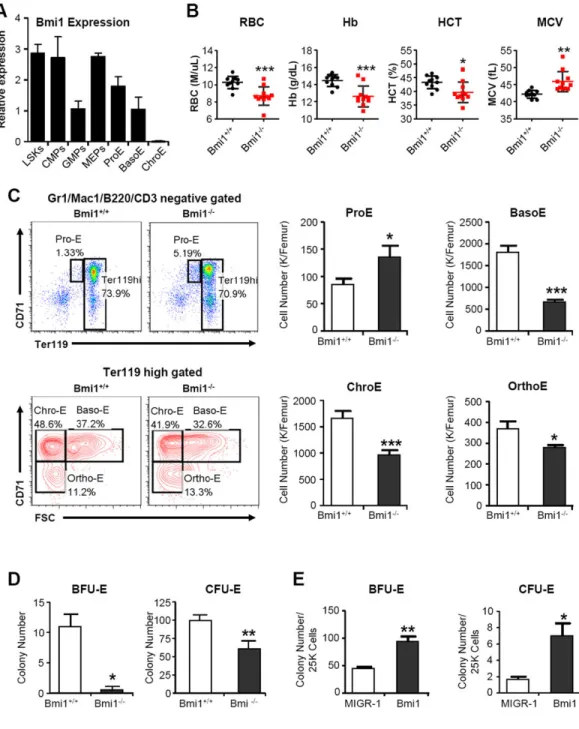
We first assessed mouse Bmi1 gene expression in purified hematopoietic stem and progenitor cells (LSKs), common myeloid progenitors (CMPs), granulocyte-macrophage progenitors (GMPs), Megakaryocyte-erythrocyte progenitors (MEPs), proerythroblasts (Pro-E), basophilic erythroblasts (Baso-(Pro-E), and chromatophilic erythroblasts (Chro-E) by quantitative real-time PCR. The LSKs, CMPs and MEPs, as well as proerythroblasts (Pro-E), had high Bmi1 expression. In contrast, GMPs and basophilic erythroblasts (Baso-E) had low Bmi1 expression, whereas Bmi1 transcripts were undetectable in the chromatophilic erythroblasts (Chro-E) committed to the erythroid lineage (Figure 1A), indicating that Bmi1 may play a pivotal role in erythropoiesis. We next examined the peripheral blood of 10 to 12 weeks old Bmi1 null mice and observed significantly decreased circulating red blood cell (RBC) in Bmi1 null mice as compared to wild type (WT) control. In addition, hemoglobin (Hb) concentrations were significantly decreased in Bmi1 null mice. Peripheral blood RBCs in Bmi1 null mice were larger than that in the WT mice, as assessed by mean corpuscular volume (MCV) [Figure 1B].
Erythroid differentiation normally progresses from CD71highTer119low proerythroblasts (Pro-Es) via CD71highTer119high basophilic erythroblasts (Baso-Es), CD71+Ter119high chromatophilic erythroblasts (Chro-Es) and CD71-Ter119high orthochromatophilic erythroblasts (Ortho-Es) [27]. Analysis of erythroid development revealed ineffective erythropoiesis in the bone marrow of Bmi1-/- mice characterized by a higher number of proerythroblast (Pro-E) and lower number of basophilic erythroblast (Baso-E),
chromatophilic erythroblast (Chro-E) and orthochromatophilic erythroblast (Ortho-E) as compared to that of the wild type mice (Figure 1C), indicating that loss of Bmi1 impairs erythroid differentiation. We also found that Bmi1 null bone marrow cells form strikingly less BFU-E and CFU-E colonies (Figure 1D). To demonstrate that this effect is directly linked to the absence of Bmi1, we introduced Bmi1 into Bmi1 null bone marrow cells using retroviruses that express Bmi1-IRES-GFP (MIGR1-Bmi1) or the empty IRES-GFP vector (MIGR1) and plated GFP-positive cells in methylcellulose medium. Introduction of Bmi1 increased both BFU-E and CFU-E colony formation of Bmi1 null cells compared with vector transduced cells (Figure 1E).
It has been shown that Bmi1 null mice show defective HSC self-renewal and lymphoid differentiation [13]. To evaluate the effect of Bmi1 loss on erythromyeloid differentiation, we performed CFU assays and observed that loss of Bmi1 decreased the colony formation of both GEMM and BFU-E (Figure S1A), suggesting that more immature progenitors
committed to the erythroid lineage may be affected. While the frequency of HSCs was dramatically decreased in Bmi1 null mice, the frequency of MPPs in the Bmi1-/- bone
Author Manuscript
Author Manuscript
Author Manuscript
marrow was similar to that of WT mice [13]. We found that Bmi1 deficiency did not alter the frequency of CMP, GMP and MEP (Figure S1B). To determine the effect of Bmi1 deficiency on MEP function, we purified MEPs from wild type and Bmi1 null bone marrow cells and performed CFU assays. We found that loss of Bmi1 in MEPs decreased BFU-E colony formation (Figure S1C), indicating MEPs are affected by Bmi1 deficiency. Collectively our data demonstrate that Bmi1 is essential for mouse erythropoiesis.
BMI1 regulates human erythropoiesis
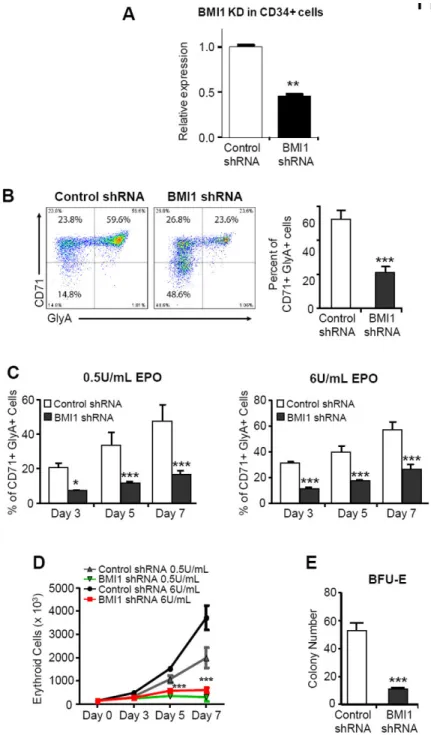
Despite the known role of human BMI1 protein in regulating human hematopoietic stem cell self-renewal [28-29], the function of BMI1 in human erythropoiesis is largely unknown. To define the role of BMI1 in normal human erythropoiesis, we used RNA interference to reduce human BMI1 gene expression in human cord blood (CB) CD34+ hematopoietic stem/ progenitor cells (HSPCs) [Figures 2A and S2] and then placed transduced cells in EPO (6 IU/mL)-driven liquid culture [30]. We monitored the generation of mature erythroid precursor cells (CD71/GlyA double positive cells) by flow cytometry and found that the generation of CD71/GlyA double positive cells was less efficient for the BMI1-knockdown (BMI-KD) cells, compared with the control shRNA-infected cells (Figure 2B). To evaluate the sensitivity of BMI1-KD cells to EPO, we measured GlyA and CD71 expression by FACS analysis in the BMI1-KD HSPCs after plating these cells in culture with SCF (100 ng/mL) and different doses of EPO (0.5 and 6 U/mL). At all tested concentrations of EPO, the BMI1-KD cells showed delayed erythroid maturation compared with control cells (Figures 2C and S3). We also found that knockdown of BMI1 expression reduced the proliferation of CD34+ cells in EPO-driven liquid culture (Figure 2D) and decreased the formation of BFU-E colonies (Figure 2E). Thus, BMI1 is important for the differentiation of human hematopoietic stem and progenitor cells.
Bmi1 deficiency results in decreased expression of some ribosomal protein genes in erythroid progenitor cells
To investigate how Bmi1 regulates erythropoiesis, we performed transcript profiling assays to compare gene expression in MEPs isolated from wild type and Bmi1 null mice and observed that some genes important for erythropoiesis, including Bcl11a, Hoxa10 and Stat5a, are dysregulated in Bmi1 null MEPs (Figure S4A). We also performed transcript profiling assays to compare gene expression in proerythroblast cells (CD71highTer119low cells) isolated from wild type and Bmi1 null mice and utilized Ingenuity Pathways Analysis software to group potential Bmi1 target genes into specific pathways that maybe important for erythropoiesis. We identified several pathways that appear to be altered in the absence of Bmi1, including ribosome biogenesis, DNA damage repair, mitochondria function,
apoptosis and hemoglobin biogenesis (Figure 3A). Ingenuity pathway analysis indicated that ribosome biogenesis is the most altered pathway in Bmi1 null pro-E cells, manifested by down-regulation of transcription of multiple ribosomal protein genes (Figure 3A). We also observed alterations in cell cycle related genes, including Rb, Cdk12 and Cdkn2a (data not shown). To verify the microarray data, we performed quantitative RT-PCR assays using both wild type and Bmi1 null proerythroblasts. As expected, we observed decreased expression of multiple ribosomal protein genes encoding both the small and large subunits of ribosome, including Rps14, Rps19, Rpl11, and Rpl35 (Figure 3B). Surprisingly, we did
Author Manuscript
Author Manuscript
Author Manuscript
not observed decreased ribosomal protein gene expression in HSCs (data not shown) and immature erythroid progenitor cells (CD71lowTer119low) derived from Bmi1 null mice compared with wild type cells (Figure S4B), indicating that Bmi1 specifically regulates ribosomal protein gene expression at the proerythroblast stage. Given that BMI1 plays an important role in human erythropoiesis, we predicted that BMI1 regulates ribosomal protein gene expression in human erythroid precursors. This was indeed the case. We found that BMI1 deficiency results in reduced expression of multiple ribosomal protein genes in human CD34+ cells (Figure 3C). Thus, BMI1 may regulate ribosomal protein gene expression in both mouse and human erythroid progenitor cells.
Haploinsufficiency of RPS14 and RPS19 has been shown to disrupt pre-rRNA processing [20, 31]. To determine the effect of BMI1 deficiency on pre-rRNA processing, we
performed northern blot analysis of rRNA transcripts and found that knockdown of BMI1 in the human erythroleukemia cell line K562 had no effect on pre-rRNA processing (Figure 3D; Figures S5A and S5B) [32]. Reduced ribosomal protein gene expression has also been shown to affect the maturation of ribosome subunit and global translation efficiency [31, 33-34]. To determine whether BMI1 regulates the maturation of ribosome subunits in erythroid progenitor cells, we performed polysome analysis using sucrose gradient centrifugation [25-26] and observed that knockdown of BMI1 in K562 cells significantly reduced polysome levels (Figure 3E). Interestingly, the polysome/monosome ratios for the control shRNA and the BMI1 shRNA were roughly the same even though the polysome peaks differed drastically on the polysome profile. This indicates that there is an overall decrease in ribosomes and global translational efficiency, demonstrating that BMI1 plays a critical role in ribosome biogenesis.
Bmi1 associates with the promoter of ribosomal protein genes and regulates their expression
There are approximately 80 ribosomal proteins in humans [18, 35]. To access the association of Bmi1 with ribosomal protein genes at the genomic level, chromatin immunoprecipitation (ChIP) followed by massive massively parallel sequencing (ChIP-seq) was performed in murine L8057 megakaryoblastic cells [36]. Both Bmi1 and Ring 1b are key components of the PRC1 complex [3]. As high-quality Bmi1 antibodies are not available for ChIP-seq, we utilized anti-Ring1b antibody in the study. Two biological repeats were performed for each, and data were compared to control IgG [36]. We observed that Ring1b associated with the promoter of multiple ribosomal protein genes, including Rpl7, Rpl10, Rpl22, Rpl29, Rps5, Rps12, Rps14 and Rps29 (Figure 4A). It appears that Ring1b associated with the
transcription start site (TSS) of multiple ribosomal protein genes. To investigate whether BMI1 associates with ribosomal protein genes in human erythroid progenitor cells, we performed chromatin immunoprecipitation (ChIP) experiments by using both BMI1 and RING1b antibodies. We observed that both BMI1 and RING1b binded to the promoter region of multiple ribosomal protein genes, including RPL5, RPL11, RPL23, RPS14 and RPS19, in K562 cells (Figures 4B and S6). Moreover, we observed both BMI1 and RING1b binding sites on ribosomal protein gene promoters were enriched with active histone marks, including H3K4me3 and H3K9ac, but not the repressive H3k27me3 mark (Figures 4C and S7), indicating that BMI1 may activate ribosomal protein gene expression in human
Author Manuscript
Author Manuscript
Author Manuscript
erythroid cells. The core enzymatic activity of PRC1 is an E3 ubiquitin ligase activity contributed by Ring1b (and enhanced by Bmi1) which ubiquitinates histone H2A at lysine 119 [3]. We found that H2AK119ub1 mark was enriched at the promoter region of RPS19 and knockdown of BMI1 decreased the level of H2AK119ub1 (Figure S8). Furthermore, we found that knockdown of BMI1 expression decreased RPL11 promoter activation in K562 cells (Figure 4D). These data demonstrate that BMI1 associates with the promoter of ribosomal protein genes and positively regulate their transcription in erythroid cells.
Bmi1 deficiency activates the p53 pathway in erythroid progenitor cells
As ribosomal dysfunction has been shown to activate the p53 pathway [37-40], we examined whether reduced dosage of ribosomal protein genes in Bmi1 null erythroid progenitor cells activates p53. While we observed no change in p53 mRNA levels, p53 target gene p21 was upregulated in Bmi1 null Pro-E cells compared with wild type cells (Figure 5A). We also observed that knockdown of BMI1 in human CD34+ cells increased p21 expression without altering p53 mRNA levels as shown in Figure 5B, indicating that p53 protein may accumulate in the absence of Bmi1. As expected, we observed that both p53 and p21 proteins are accumulated in Bmi1 null bone marrow cells compared with wild type cells (Figure 5C), demonstrating loss of Bmi1 stabilizes p53 protein. We also found that Bmi1 target gene p19Arf expression is upregulated in both Bmi1 null pro-E cells and BMI1 KD CD34+ cells (Figures S9A and S9B).
Elevated p53 protein levels could induce apoptosis and/or cell cycle arrest. To assess the effect of Bmi1 deficiency on the survival of erythroid cells, we assayed for apoptosis of erythroid progenitor cells by Annexin-V staining. While immature erythroid progenitor cells (CD71-Ter119- cells) from the Bmi1 null mice exhibited normal apoptosis, there was a modest increase of apoptotic pro-E cells, though not statistically significant (Figure 5D). Next, we examined the cell cycle status of CD71-Ter119- and Pro-E cells by PI staining. Loss of Bmi1 did not affect cell cycle status of CD71-Ter119- cells (Figure S10); however, we observed that Bmi1 null pro-E cells are arrested at the G0/G1 phase of the cell cycle (Figure 5E). Consistent with data shown in Figure 5E, knockdown of BMI1 significantly increased the proportion of CD34+ cells in the G0/G1 phase of the cell cycle, compared to that of the control shRNA infected cells (Figure 5F). Thus, Bmi1 deficiency activates the p53 pathway, resulting in cell cycle arrest.
Genetic inhibition of p53 activity rescues the erythroid defects seen in the Bmi1 null mice
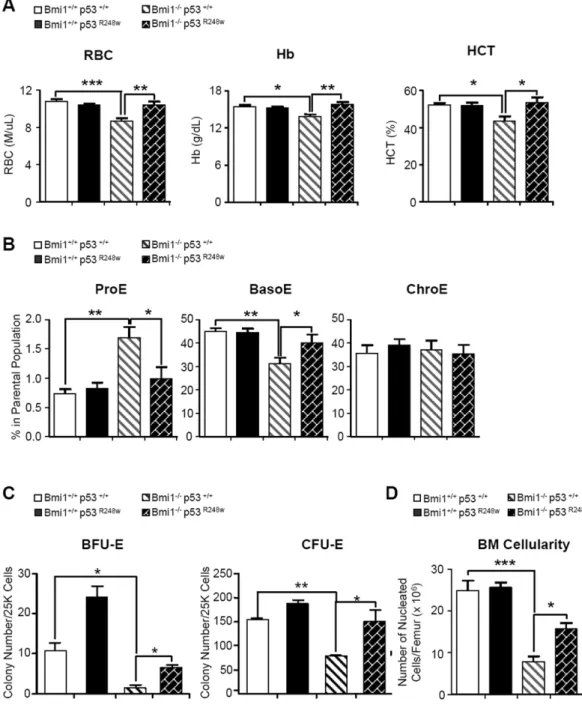
Deletion of p53 can rescue the erythroid defects in animal models of DBA and 5q-syndrome, suggesting a p53-dependent mechanism underlies the pathophysiology of DBA and 5q-syndrome [38-40]. To examine whether inhibiting p53 function rescues the erythroid defects seen in Bmi1 null mice, we used a dominant negative mutant form of p53, p53R248W, which has been shown to inhibit wild type p53 functions [41]. The p53R248W mice express human p53 mutant protein from the endogenous murine Trp53 promoter [22]. We generated Bmi1-/- p53R248W double mutant mice and analyzed the hematopoietic phenotype in a cohort of 4 genotypes (Bmi1+/+ p53+/+; Bmi1+/+ p53R248W; Bmi1-/- p53+/+ and Bmi1-/- p53R248W). We observed that the RBC, Hb and HCT levels were rescued in Bmi1-/- p53R248W mice (Figure 6A). To examine whether dominant-negative p53 can also rescue defective
Author Manuscript
Author Manuscript
Author Manuscript
erythropoiesis in Bmi1 null mice, we examined the frequency of erythroid progenitor cells in these mice. While loss of Bmi1 increased the frequency of Pro-E cells, inhibiting p53 activity with mutant p53 returned the number of these cells in the bone marrow to normal (Figure 6B). We also performed CFC assays and found that inhibiting p53 activity in Bmi1 null bone marrow cells increases their ability to form both BFU-E and CFU-E colonies (Figure 6C). We also found that inhibiting p53 activity enhanced myeloid differentiation of Bmi1 null cells (Figure S11). In addition, we found that inhibiting p53 activity returns p21 expression to normal (Figure S12A). While expression of dominant-negative p53 rescued the cell cycle arrest of Bmi1 null cells (Figure S12B), inhibiting p53 activity had no effect on ribosomal protein gene expression in these cells (Figure S13). These data demonstrate that Bmi1 regulates ribosomal protein gene expression in a cell cycle status independent manner.
Bmi1 null mice develop hypocellular bone marrow and show decreased bone marrow cellularity over time [13]. We found that the decreased bone marrow cellularity seen in the Bmi1 null mice was partially rescued in Bmi1-/-p53R248W mice (Figure 6D). Although the Bmi1 null mice have reduced body size [13], inhibiting p53 does not increase the body weight of Bmi1 null mice (Figure S14). In summary, we show that genetic inhibition of p53 activity rescues the erythroid defects seen in Bmi1 null mice, indicating that activation of the p53 pathway impairs erythropoiesis in Bmi1 null mice.
BMI1 is differentially expressed in CD34+ cells isolated from patients with DBA
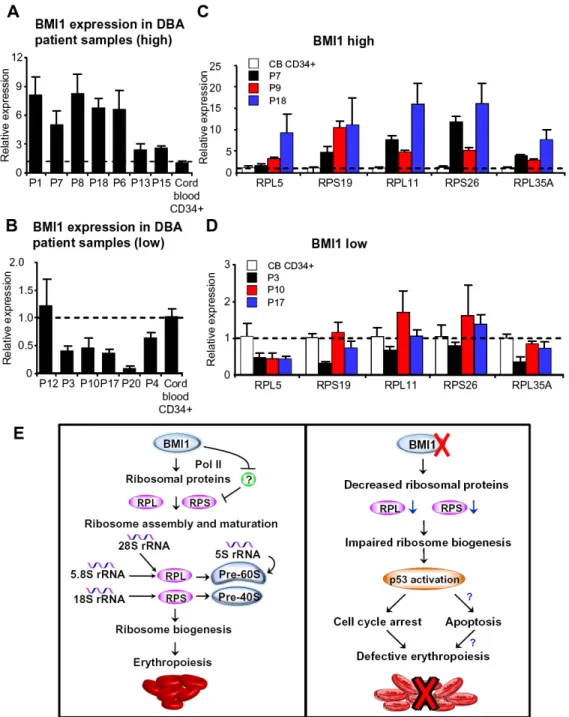
We demonstrated that Bmi1 null mice recapitulate several critical features of human DBA, including impaired ribosome biogenesis, activation of the p53 pathway, cell cycle arrest and defective erythropoiesis, indicating that BMI1 deficiency may contribute to the pathogenesis of DBA. Therefore, we examined human BMI1 gene expression in CD34+ cells isolated from DBA patients by using quantitative RT-PCR assays. While 7 out of 13 DBA samples had high BMI1 expression compared with normal human cord blood CD34+ cells (Figure 7A), 5 out of 13 DBA samples had low BMI1 expression (Figure 7B). Moreover, we observed that high BMI1 expression correlates with increased expression of some ribosomal protein genes, including RPL5, RPL11, RPL35A, RPS19 and RPS26 (Figure 7C), whereas low BMI1 expression correlates with decreased expression of some ribosomal protein genes (Figure 7D). These data suggest that BMI1 may play a pathological role in DBA.
DISCUSSION
We found that Bmi1 is highly expressed in erythroid progenitor cells, where it functions as an enhancer of erythroid differentiation. In these cells, Bmi1 associates with some ribosomal protein genes and enhances their expression. As erythroid progenitor cells undergo
differentiation, Bmi1 expression decreases, thereby decreasing the transcription of ribosomal protein genes and cell proliferation [Figure 7E, left panel]. The Bmi1 gene expression pattern we identified is consistent with Bmi1 expression pattern shown in the ErythronDB [42]. Loss of Bmi1 results in downregulation of transcription of multiple ribosomal protein genes, decreased protein synthesis, activation of the p53 pathway, cell cycle arrest and defective erythroid differentiation (Figure 7E, right panel).
Author Manuscript
Author Manuscript
Author Manuscript
To understand how Bmi1 regulates erythropoiesis, we performed gene expression profiling assays to identify genes and pathways regulated by Bmi1. Several pathways appear to be altered in the absence of Bmi1, including ribosome biogenesis, mitochondria function, DNA damage repair, apoptosis and hemoglobin biogenesis. Based on Ingenuity Pathway analysis, the ribosome biogenesis pathway was the most altered pathway in Bmi1 null pro-E cells. Given that impaired ribosome biogenesis underlies the pathogenesis of DBA and 5q-syndrome [18-21], we decided to focus our studies on the ribosome biogenesis pathway. There are approximately 80 ribosomal proteins in mammalian cells [18, 35]. While the expression of approximately 20 ribosomal protein genes were significantly downregulated in Bmi1 null proerythroblasts, the expression of the majority of ribosomal protein genes were unchanged (data not shown), suggesting that there is an imbalanced synthesis of ribosomal proteins in the absence of Bmi1 [18-19; 43]. Germline mutations in RPS19 and other genes encoding ribosomal proteins cause DBA [18-19]. The 5q- syndrome is caused by a somatically acquired deletion of chromosome 5q, which leads to haploinsufficiency of the ribosomal protein RPS14 and an erythroid phenotype highly similar to DBA [18-20]. Global gene expression analysis of DBA patients has shown that RPS19 mutations lead to
downregulation of transcription of multiple ribosomal protein genes [44]. Further studies of highly purified HSCs from healthy patients and those with MDS links reduced expression of several ribosomal protein genes to decreased RBC maturation [40]. Thus, it is likely that downregulation of multiple ribosomal protein genes in Bmi1 null erythroid precursors impairs ribosome biogenesis.
To investigate whether Bmi1 regulates ribosome biogenesis, we performed genome wide association studies and ChIP experiments. We demonstrated that Bmi1 associates with several ribosomal protein genes and positively regulates their expression in erythroid progenitor cells. In ChIP experiments, BMI1 appears to bind to the promoter region of some ribosomal protein genes with enriched active histone marks, including H3K4me3 and H3K9Ac, but not the repressive H3K27me3 mark. We found that H2AK119ub1 mark was enriched at the promoter region of RPS19 and knockdown of BMI1 decreased the level of H2AK119ub1, indicating that the PRC1 complex may regulate ribosomal protein gene expression in erythroid progenitor cells. BMI1 is a known epigenetic repressor in hematopoietic stem and progenitor cells [3, 13]; however, our data indicate that it may function as an activator of ribosomal protein gene expression in erythroid progenitor cells. Polycomb proteins are found in most cells, but they must be targeted to specific genes in specific cell types to regulate pluripotency and differentiation [1-3]. MYC is a direct regulator of ribosome biogenesis in multiple cell types [45]. Given that BMI1 cooperates with MYC to promote the generation of B- and T-cell lymphomas [46-47], we hypothesize that MYC recruits BMI1 onto the promoter of ribosomal protein genes and assembles an activating complex, enhancing ribosomal protein gene transcription. It is also possible that BMI1 inhibits a negative regulator of ribosome biogenesis and indirectly regulates this process.
Given that ribosomal dysfunction can activate the p53 pathway [39-40], we reasoned that reduced ribosomal protein gene expression in Bmi1 null erythroid progenitor cells may activate the p53 pathway. This was indeed the case. While p53 mRNA levels were
Author Manuscript
Author Manuscript
Author Manuscript
comparable, p53 proteins were elevated in Bmi1 null bone marrow cells, indicating that Bmi1 deficiency stabilizes p53 protein. In addition, we observed that p53 target gene p21 is upregulated in Bmi1 null erythroid progenitor cells, demonstrating that the p53 pathway is activated in the absence of Bmi1. In response to ribosomal stress, several ribosomal proteins, including RPL5 and RPL11, bind to MDM2 and block MDM2-mediated p53 ubiquitination and degradation, resulting in p53-dependent cell cycle arrest [39-41, 48]. It is possible that similar mechanisms may apply to the activation of p53 pathway in Bmi1-deficient cells. Bmi1 is a potent negative regulator of the Ink4a-Arf locus, which encodes the cell cycle regulator and tumor suppressor p16Ink4a and p19Arf proteins [3]. p19 interacts with Mdm2 and stabilize the p53 protein [1-3]. We found that p19 expression is upregulated in Bmi1-deficient cells, suggesting accumulation of p53 protein may also be due to
increased expression of p19Arf.
Deletion of p53 in mouse models of human DBA and 5q-syndrome can rescue the erythroid defects [34, 38-40]. We found that inhibiting p53 activity with a dominant-negative mutant p53 partially rescues the erythroid defects of the Bmi1 null mice, suggesting that a p53-dependent mechanism underlies the pathophysiology of anemia. Human K562
erythroleukemia cells have been used to study the impact of RPS19 mutations on ribosome biogenesis [32]. Therefore, we utilized these cells investigate how BMI1 regulates ribosome biogenesis. We found that knockdown of BMI1 expression in K562 cells results in
downregulation of multiple ribosomal protein genes as we observed in human CD34+ cells (data not shown). Given that K562 cells are p53 null, our data suggest that BMI1 regulate ribosomal protein gene expression in a p53-independent manner.
Stabilization of p53 leads to cell cycle arrest and/or apoptosis in mouse model of human DBA and 5q-syndrome [34, 38, and 40]. In addition, haploinsufficiency for ribosomal protein gene activates the p53 pathway in human erythroid progenitor cells, leading to accumulation of p21 and consequent cell cycle arrest [39]. We observed that Bmi1
deficiency in both mouse and human erythroid progenitor cells results in upregulation of p21 and G0/G1 cell cycle arrest. Bmi1 null proerythroblasts appear to have higher rate of apoptosis, but the difference is not statistically significant. In addition, we found that anti-apoptotic gene Mcl1 was downregulated in Bmi1 null cells (Figure 3A), indicating that enhanced apoptosis may play a role in the erythroid defect seen in Bmi1 null mice. Given that cell cycle progression and ribosomal biogenesis is coupled [48], the reduced ribosomal protein gene expression in Bmi1 null erythroid precursors could also be due to cell cycle arrest. While inhibiting p53 activity using dominant-negative p53 rescued the cell cycle arrest of Bmi1 null cells, inhibiting p53 activity had no effect on ribosomal protein gene expression in these cells, suggesting that Bmi1 regulates ribosome biogenesis in a cell-cycle independent manner.
Although peripheral blood counts from 7 to 8 weeks old Bmi1 null mice were close to normal (data not shown), these mice started to show anemic features from 10 to 12 weeks old, manifested by reduced RBC, HB and HCT levels compared with wild type mice. Interestingly, we observed that MCV levels are increased in Bmi1 deficient mice, which is a key feature of DBA and 5q-syndrome [18-21]. Rps19-deficient mice develop a macrocytic anemia together with leukocytopenia, leading to the exhaustion of hematopoietic stem cells
Author Manuscript
Author Manuscript
Author Manuscript
and bone marrow failure [34]. In a mouse model of human 5q-syndrome, haploinsufficiency of the Cd47-Nid67 interval (containing Rps14) caused macrocytic anemia and prominent erythroid dysplasia in the bone marrow [38]. Thus, Bmi1 deficiency may link to the pathogenesis of ribosomopathies, including DBA and 5q-syndrome.
Recent advances in characterizing the genetic abnormalities underlying DBA have demonstrated mutations or deletions of genes encoding both large (RPL) and small (RPS) ribosomal subunit proteins in 50 to 60% of affected patients [49-50]. We reported clinical analysis of 45 cases of DBA in China and found that clinical features of these Chinese DBA patients are similar to other ethical groups [51]. We performed mutational analysis of ribosomal protein genes in 21 cases of DBA as well [52]. However, genetic abnormalities in the remaining DBA patients are largely unknown. We observed decreased expression of multiple ribosomal protein genes encoding both the small and large subunits of ribosome in Bmi1 null erythroid progenitor cells, including Rps14, Rps19, Rps27 and Rpl11, which has been implicated in the pathogenesis of DBA and 5q-syndrome [18-20]. Moreover, the erythroid defects seen in Bmi1 null mice recapitulate several, but not all clinical features of human DBA and 5q-syndrome [18-20]. In this study, we found that BMI1 expression in CD34+ cells from patients with DBA correlate with the expression of some ribosomal protein genes in a small cohort of DBA patients. While there is no direct link between BMI1 and the pathogenesis of DBA, our data suggest that BMI1 may play a pathological role in DBA and other ribosomopathies. Exome sequencing has identified GATA1 mutations in DBA patients without ribosomal protein gene mutations [53]. Reduced BMI1 expression in patients with DBA may be due to mutations. In the future, we will perform exome
sequencing to detect BMI1 mutations in DBA patients without ribosomal protein gene mutations.
Supplementary Material
Refer to Web version on PubMed Central for supplementary material.
Acknowledgments
We would like to thank Dr. Martin van Lohuizen (The Netherlands Cancer Institute, the Netherlands) for providing the Bmi1 knockout mice. We are also grateful to Dr. Atsushi Iwama (Chiba University, Japan) for providing BMI1-shRNAs and to Dr. Schuringa (University of Groningen, Groningen, Netherlands) for providing MIGR1-BMI1 plasmid. This work was supported in part by the Department of Defense (DoD) Career Development Award CA120373 (Y.L.), an St. Baldrick’s Foundation Scholar Award (Y.L.), an Elsa Pardee Foundation Cancer Research Award (Y.L.), an Alex’s Lemonade Stand Foundation Research Award (Y.L.), an American Cancer Society Institutional Research Grant (Y.L.), an Indiana University Simon Cancer Center pilot project grant (Y.L.) and an Indiana University Biomedical Research Grant (Y.L.), NIH R01 CA173852 (R. Kapur) and NIH R01 HL)77177 (R. Kapur). We acknowledge the In Vivo Therapeutics Core of the Indiana University Simon Cancer Center as well as the nursing staff and Dr. Arthur Baluyut at the St. Vincent Hospital (Indianapolis, IN) for providing umbilical cord blood samples for this study. We also would like to thank Mrs. Marilyn Wales for helping in the preparation of the manuscript.
References
1. Valk-Lingbeek ME, Bruggeman SW, van Lohuizen M. Stem cells and cancer; the polycomb connection. Cell. 2004; 118:409–18. [PubMed: 15315754]
2. Sparmann A, van Lohuizen M. Polycomb silencers control cell fate, development and cancer. Nat Rev Cancer. 2006; 6:846–56. [PubMed: 17060944]
Author Manuscript
Author Manuscript
Author Manuscript
3. Bracken AP, Helin K. Polycomb group proteins: navigators of lineage pathways led astray in cancer. Nat Rev Cancer. 2009; 9:773–84. [PubMed: 19851313]
4. Wang H, Wang L, Erdjument-Bromage H, et al. Role of histone H2A ubiquitination in Polycomb silencing. Nature. 2004; 431:873–878. [PubMed: 15386022]
5. Cao R, Tsukada Y, Zhang Y. Role of Bmi-1 and Ring1A in H2A ubiquitylation and Hox gene silencing. Mol Cell. 2005; 20:845–854. [PubMed: 16359901]
6. Buchwald G, van der Stoop P, Weichenrieder O, et al. Structure and E3-ligase activity of the Ring Ring complex of Polycomb proteins Bmi1 and Ring1b. EMBO J. 2006; 25:2465–2474. [PubMed: 16710298]
7. Martin-Perez D, Piris MA, Sanchez-Beato M. Polycomb proteins in hematologic malignancies. Blood. 2010; 116:5465–75. [PubMed: 20716771]
8. Schuringa JJ, Vellenga E. Role of the polycomb group gene BMI1 in normal and leukemic
hematopoietic stem and progenitor cells. Curr Opin Hematol. 2010; 17:294–9. [PubMed: 20308890] 9. Konuma T, Oguro H, Iwama A. Role of the polycomb group proteins in hematopoietic stem cells.
Dev Growth Differ. 2010; 52:505–16. [PubMed: 20646023]
10. Xie H, Xu J, Hsu JH, et al. Polycomb Repressive Complex 2 Regulates Normal Hematopoietic Stem Cell Function in a Developmental-Stage-Specific Manner. Cell Stem Cell. 2013; 14:68–80. [PubMed: 24239285]
11. Mochizuki-Kashio M, Mishima Y, Miyagi S, et al. Dependency on the polycomb gene Ezh2 distinguishes fetal from adult hematopoietic stem cells. Blood. 2012; 118:6553–61. [PubMed: 22042701]
12. Hidalgo I, Herrera-Merchan A, Ligos JM, et al. Ezh1 is required for hematopoietic stem cell maintenance and prevents senescence-like cell cycle arrest. Cell Stem Cell. 2012; 11:649–62. [PubMed: 23122289]
13. Park IK, Qian D, Kiel M, et al. Bmi-1 is required for maintenance of adult self-renewing haematopoietic stem cells. Nature. 2003; 423:302–305. [PubMed: 12714971]
14. Lessard J, Sauvageau G. Bmi1 determines the proliferative capacity of normal and leukaemic stem cells. Nature. 2003; 423:255–260. [PubMed: 12714970]
15. Liu Y, Liu F, Yu H, et al. Akt phosphorylates the transcriptional repressor bmi1 to block its effects on the tumor- suppressing ink4a-arf locus. Sci Signal. 2012; 5:ra77. [PubMed: 23092893] 16. Oguro H, Yuan J, Ichikawa H, et al. Poised lineage specification in multipotential hematopoietic
stem and progenitor cells by the polycomb protein Bmi1. Cell Stem Cell. 2010; 6:279–86. [PubMed: 20207230]
17. Wong P, Hattangadi SM, Cheng AW, et al. Gene induction and repression during terminal erythropoiesis are mediated by distinct epigenetic changes. Blood. 2011; 118:e128–38. [PubMed: 21860024]
18. Narla A, Ebert BL. Ribosomopathies: human disorders of ribosome dysfunction. Blood. 2010; 115:3196–205. [PubMed: 20194897]
19. Ellis SR, Gleizes PE. Diamond Blackfan anemia: ribosomal proteins going rogue. Semin Hematol. 2011; 48:89–96. [PubMed: 21435505]
20. Ebert BL, Pretz J, Bosco J, et al. Identification of RPS14 as a 5q- syndrome gene by RNA interference screen. Nature. 2008; 451:335–9. [PubMed: 18202658]
21. Narla A, Hurst SN, Ebert BL. Ribosome defects in disorders of erythropoiesis. Int J Hematol. 2011; 93:144–9. [PubMed: 21279816]
22. Song H, Hollstein M, Xu Y. p53 gain-of-function cancer mutants induce genetic instability by inactivating ATM. Nat Cell Biol. 2007; 15:376–88.
23. Liu Y, Elf SE, Miyata Y, et al. p53 regulates hematopoietic stem cell quiescence. Cell Stem Cell. 2009; 4:37–48. [PubMed: 19128791]
24. Bracken AP, Kleine-Kohlbrecher D, Dietrich N, et al. The Polycomb group proteins bind throughout the INK4A-ARF locus and are disassociated in senescent cells. Genes Dev. 2007; 21:525–30. [PubMed: 17344414]
25. Teske BF, Baird TD, Wek RC. Methods for analyzing eIF2 kinases and translational control in the unfolded protein response. Methods Enzymol. 2011; 490:333–56. [PubMed: 21266259]
Author Manuscript
Author Manuscript
Author Manuscript
26. Palam LR, Baird TD, Wek RC. Phosphorylation of eIF2 facilitates ribosomal bypass of an inhibitory upstream ORF to enhance CHOP translation. J Biol Chem. 2011; 286:10939–49. [PubMed: 21285359]
27. Hattangadi SM, Wong P, Zhang L, et al. From stem cell to red cell: regulation of erythropoiesis at multiple levels by multiple proteins, RNAs, and chromatin modifications. Blood. 2011; 118:6258– 68. [PubMed: 21998215]
28. Rizo A, Dontje B, Vellenga E, et al. Long-term maintenance of human hematopoietic stem/ progenitor cells by expression of BMI1. Blood. 2008; 111:2621–30. [PubMed: 18156489] 29. Rizo A, Olthof S, Han L, et al. Repression of BMI1 in normal and leukemic human CD34(+) cells
impairs self-renewal and induces apoptosis. Blood. 2009; 114:1498–505. [PubMed: 19556423] 30. Perna F, Gurvich N, Hoya-Arias R, et al. Depletion of L3MBTL1 promotes the erythroid
differentiation of human hematopoietic progenitor cells: possible role in 20q-polycythemia vera. Blood. 2010; 116:2812–21. [PubMed: 20585043]
31. Flygare J, Aspesi A, Bailey JC, et al. Human RPS19, the gene mutated in Diamond-Blackfan anemia, encodes a ribosomal protein required for the maturation of 40S ribosomal subunits. Blood. 2007; 109:980–6. [PubMed: 16990592]
32. Cmejlova J, Dolezalova L, Pospisilova D, et al. Translational efficiency in patients with Diamond-Blackfan anemia. Haematologica. 2006; 91:1456–64. [PubMed: 17082006]
33. Flygare J, Kiefer T, Miyake K, et al. Deficiency of ribosomal protein S19 in CD34+ cells generated by siRNA blocks erythroid development and mimics defects seen in Diamond-Blackfan anemia. Blood. 2005; 105:4627–34. [PubMed: 15626736]
34. Jaako P, Flygare J, Olsson K, et al. Mice with ribosomal protein S19 deficiency develop bone marrow failure and symptoms like patients with Diamond-Blackfan anemia. Blood. 2011; 118:6087–96. [PubMed: 21989989]
35. Teng T, Thomas G, Mercer CA. Growth control and ribosomopathies. Curr Opin Genet Dev. 2013; 23:63–71. [PubMed: 23490481]
36. Yu M, Mazor T, Huang H, et al. Direct recruitment of polycomb repressive complex 1 to
chromatin by core binding transcription factors. Mol Cell. 2012; 45:330–43. [PubMed: 22325351] 37. Choesmel V, Bacqueville D, Rouquette J, et al. Impaired ribosome biogenesis in
Diamond-Blackfan anemia. Blood. 2007; 109:1275–83. [PubMed: 17053056]
38. Barlow JL, Drynan LF, Hewett DR, et al. A p53-dependent mechanism underlies macrocytic anemia in a mouse model of human 5q- syndrome. Nat Med. 2010; 16:59–66. [PubMed: 19966810]
39. Dutt S, Narla A, Lin K, Mullally A, et al. Haploinsufficiency for ribosomal protein genes causes selective activation of p53 in human erythroid progenitor cells. Blood. 2011; 117:2567–76. [PubMed: 21068437]
40. McGowan KA, Pang WW, Bhardwaj R, et al. Reduced ribosomal protein gene dosage and p53 activation in low-risk myelodysplastic syndrome. Blood. 2011; 118:3622–33. [PubMed: 21788341]
41. Brosh R, Rotter V. When mutants gain new powers: news from the mutant p53 field. Nat Rev Cancer. 2009; 9:701–13. [PubMed: 19693097]
42. Kingsley PD, Greenfest-Allen E, Frame JM, et al. Ontogeny of erythroid gene expression. Blood. 2013; 121:e5–e13. [PubMed: 23243273]
43. Wong CC, Traynor D, Basse N, et al. Defective ribosome assembly in Shwachman-Diamond syndrome. Blood. 2011; 118:4305–12. [PubMed: 21803848]
44. Gazda HT, Kho AT, Sanoudou D, et al. Defective ribosomal protein gene expression alters transcription, translation, apoptosis, and oncogenic pathways in Diamond-Blackfan anemia. Stem Cells. 2006; 24:2034–44. [PubMed: 16741228]
45. van Riggelen J, Yetil A, Felsher DW. MYC as a regulator of ribosome biogenesis and protein synthesis. Nat Rev Cancer. 2010; 10:301–9. [PubMed: 20332779]
46. van Lohuizen M, Verbeek S, Scheijen B, Wientjens E, van der Gulden H, Berns A. Identification of cooperating oncogenes in E mu-myc transgenic mice by provirus tagging. Cell. 1991; 65:737– 752. [PubMed: 1904008]
Author Manuscript
Author Manuscript
Author Manuscript
47. Jacobs JJ, Scheijen B, Voncken JW, Kieboom K, Berns A, van Lohuizen M. Bmi-1 collaborates with c-Myc in tumorigenesis by inhibiting c-Myc-induced apoptosis via INK4a/ARF. Genes & Dev. 1999; 13:2678–2690. [PubMed: 10541554]
48. Zhang Y, Lu H. Signaling to p53: Ribosomal Proteins Find Their Way. Cancer Cell. 2009; 19:369– 377. [PubMed: 19878869]
49. Boria I, Garelli E, Gazda HT, et al. The ribosomal basis of Diamond-Blackfan Anemia: mutation and database update. Hum Mutat. 2010; 31:1269–79. [PubMed: 20960466]
50. Farrar JE, Vlachos A, Atsidaftos E, et al. Ribosomal protein gene deletions in Diamond-Blackfan anemia. Blood. 2011; 118:6943–51. [PubMed: 22045982]
51. Chen YM, Ruan M, Wang YQ, et al. Analysis of clinical characteristics in 45 cases of Diamond-Blackfan anemia. Zhongguo Shi Yan Xue Ye Xue Za Zhi. 2012; 20:646–9. [PubMed: 22739174] 52. Chen YM, Ruan M, Zou Y, et al. Analysis of mutations of ribosomal protein genes in 21 cases of Diamond-Blackfan anemia. Zhongguo Shi Yan Xue Ye Xue Za Zhi. 2012; 20:1414–8. [PubMed: 23257444]
53. Sankaran VG, Ghazvinian R, Do R, et al. Exome sequencing identifies GATA1 mutations resulting in Diamond-Blackfan anemia. J Clin Invest. 2012; 122:2439–43. [PubMed: 22706301]
Author Manuscript
Author Manuscript
Author Manuscript
Figure 1. Bmi1 regulates mouse erythroid differentiation
(A) Real time PCR analysis of Bmi1 mRNAs in LSKs, CMPs, GMPs, MEPs, Pro-E, Baso-E and Chro-E cells. LSKs, Lin-Sca1+Kit+ cells; CMPs, common myeloid progenitors; GMPs, granulocyte-macrophage progenitors; MEPs, megakaryocyte-erythrocyte progenitors; Pro-E, proerythroblasts; Baso-E, basophilic erythroblasts; and Chro-E, chromatophilic
erythroblasts. Bmi1 mRNA level in GMPs was arbitrarily set to 1. Data are means ± SD. Value are shown for three biological replicates. (B) Peripheral blood of 10 to 12 weeks old WT and Bmi1 null mice were collected and analyzed. Data are means ± SD, n=10 for WT mice, n=11 for Bmi1 null mice. *p<0.05; **p<0.01; ***p<0.001. (C) Erythroid progenitor frequency in the bone marrow (BM) of WT and Bmi1 null mice was measured by CD71 and
Author Manuscript
Author Manuscript
Author Manuscript
Ter119 staining in combination with cell size (FSC). Representative FACS profile (left panel) and the absolute number of Pro-E, Baso-E, Chro-E and Ortho-E (right panel) in the bone marrow of wild type and Bmi1 null mice are shown. Data are means ± SD, n=6, *p<0.05; ***p<0.001. (D) Equal number of bone marrow mononuclear cells from WT and Bmi1 null mice were plated on methylcellulose medium. Colonies were counted on day 2-3 (CFU-E) or day 9-10 (BFU-E). Data are means ± SD, n=3, *p<0.05; **p<0.01. (E) Mononuclear cells from the Bmi1 null mice were infected with Bmi1 overexpressing or control retroviruses. Sorted GFP+ cells were plated on methylcellulose medium and colonies
were counted on day 2-3 (CFU-E) or day 9-10 (BFU-E). Data are means ± SD, n=3, *p<0.05; **p<0.01.
Author Manuscript
Author Manuscript
Author Manuscript
Figure 2. BMI1 regulates human erythropoiesis
(A) Lentiviral constructs expressing shRNAs targeting luciferase (control) or BMI1 led to efficient knockdown of BMI1 expression in human CB CD34+ cells, as assessed by
quantitative RT-PCR. Data are means ± SD. Value are shown for three biological replicates. **p<0.01. (B) Expression of CD71 and GlyA on human CD34+ cells, as assayed by flow cytometric analysis at day 7 of EPO-induced culture. Data are means ± SD. ***p<0.001, n=3. (C) Expression of CD71 and GlyA on human CD34+ cells, cultured with different concentrations of EPO, as assayed by flow cytometric analysis at day3, day 5 and day7. Data are means ± SD. *p<0.05; ***p<0.001, n=3. (D) Proliferation of control shRNA or
Author Manuscript
Author Manuscript
Author Manuscript
BMI1 shRNA transduced CD34+ cells at different time points after culturing in EPO-induced liquid culture. Data are means ± SD. ***p<0.001, n=3. (E) Seventy two hours after lentiviral infection, 500 sorted GFP+ CD34+ cells were placed in CFU assays and the number of BFU-E colonies quantified. Data are means ± SD. ***p<0.001, n=3.
Author Manuscript
Author Manuscript
Author Manuscript
Figure 3. Bmi1 deficiency results in decreased expression of some ribosomal protein genes in erythroid progenitor cells
(A) Transcript profiling of Pro-E cells from WT and Bmi1-/- mice were analyzed by Agilent Whole Mouse Genome Oligo Microarrays. Genes whose expressions are increased or decreased more than 2-fold in Bmi1-/- Pro-E cells compared to wild-type cells are shown. Data shown are relative expression as compared to WT Pro-E cells (set as 1). We utilized Ingenuity pathways Analysis (Ingenuity Systems) to group genes into specific canonical pathways. Values are shown for three biological replicates. (B) Real time RT-PCR analysis of ribosomal protein gene expression in Pro-E cells from WT and Bmi1-/- mice. Data shown
Author Manuscript
Author Manuscript
Author Manuscript
are relative expression as compared to WT Pro-E cells (set as 1). Data are means ± SD. Value are shown for three biological replicates. *p<0.05; **p<0.01;***p<0.001. (C) Real time RT-PCR analysis of expressions of different ribosomal protein genes in transduced human CD34+ cells. Data shown are relative expression as compared to control shRNA transduced cells (set as 1). Data are means ± SD. Value are shown for three biological replicates. *p<0.05; ***p<0.001. (D) Northern blot analysis of total RNA from K562 cells infected with control or BMI1 shRNA. (E) Knockdown of BMI1 in K562 cells reduces polysome levels. Representative polysome profiles of K562 cells infected with control or BMI1 shRNAs by sucrose gradient centrifugation are shown.
Author Manuscript
Author Manuscript
Author Manuscript
Figure 4. Bmi1 associates with the promoter of some ribosomal protein genes and enhances their expression
(A) Representative Ring1b and control IgG ChIP-seq profiles of loci occupied by Ring1b in murine L8057 megakaryoblastic cells. It appears that Ring1b associates with the
transcription start site (TSS) of multiple ribosomal protein genes. (B) BMI1 and RING1b associates with the promoter of some ribosomal protein genes in vivo. Chromatin-bound DNA from K562 cells were immunoprecipitated with a BMI1-antibody, a RING1b-antibody or with normal mouse IgG. qPCR amplification was performed on corresponding templates using primers for RPS14, RPS19, RPL5, RPL11 and RPL23 genes. (C) Chromatin-bound DNA from K562 cells were immunoprecipitated with a BMI1-antibody, a
RING1B-antibody, a H3K9ac-RING1B-antibody, a H3K4me3-RING1B-antibody, a H3K27me3-antibody or with normal
Author Manuscript
Author Manuscript
Author Manuscript
mouse IgG. qPCR amplification was performed on corresponding templates using primers for RPS19 gene. (D) Knockdown of BMI1 decreases the activation of the RPL11 promoter. K562 cells with reduced BMI1 expression were transfected with RPL11 promoter-driven luciferase plasmid. Luciferase activity was assayed 24 hr after transfection. Values are means ± SD, n=3, *p<0.05; **p<0.01.
Author Manuscript
Author Manuscript
Author Manuscript
Figure 5. Loss of Bmi1 leads to activation of the p53 pathway in erythroid progenitor cells
(A) Real time RT-PCR analysis of p53 and p21 expression in proerythroblasts
(CD71highTer119low) from the bone marrow of WT and Bmi1 null mice. Data shown are relative expression as compared to WT Pro-E cells (set as 1). Data are means ± SD. Value are shown for three biological replicates. ***p<0.001. (B) Knockdown of BMI1 expression in human CB CD34+ cells upregulates p21 expression as assessed by quantitative RT-PCR.
Data are means ± SD. Value are shown for three biological replicates. ***p<0.001. (C) p53 and p21 proteins in bone marrow mononuclear cells from both wild type and Bmi1 null mice were assessed by Western blot analysis. (D) Annexin V staining of bone marrow cells isolated from WT and Bmi1 null mice. Cells were cultured without cytokine for 24 hours. Data are means ± SD (n=3). (E) Cell cycle analysis of erythroblasts from the bone marrow of WT and Bmi1 null mice. Data are means ± SD, *p<0.05, n=3. (F) Cell cycle analysis of
Author Manuscript
Author Manuscript
Author Manuscript
control shRNA or BMI1 shRNA transduced CD34+ cells after 7 days in EPO-induced liquid culture. Data are means ± SD. ***p<0.001, n=3.
Author Manuscript
Author Manuscript
Author Manuscript
Figure 6. Genetic inhibition of p53 activity rescues the erythroid defects seen in the Bmi1 null mice
(A) Peripheral blood from 10 to 12 weeks old mice with indicated genotype were collected and analyzed. Data are means ± SD, *p<0.05; **p<0.01, ***p<0.001, n=3-8 mice per group. (B) Erythroid progenitor frequency in the bone marrow (BM) of mice with indicated genotype was measured by CD71 and Ter119 staining in combination with cell size (FSC). Data are means ± SD, n=3-8 mice per group, *p<0.05; **p<0.01. (C) Equal number of bone marrow mononuclear cells from 4 genotype mice were plated on methylcellulose medium supplemented with EPO (CFU-E) or EPO, SCF and IL-3 (BFU-E) in triplicates (25K cells/ well). Colonies were counted on day 2-3 (CFU-E) or day 9-10 (BFU-E). Data are means ±
Author Manuscript
Author Manuscript
Author Manuscript
SD, n=3, *p<0.05; **p<0.01. (D) Total nucleated cells per femur from 10-12 weeks old mice were counted. Data are means ± SD, n=3-8. *p<0.05; ***p<0.001.
Author Manuscript
Author Manuscript
Author Manuscript
Figure 7. BMI1 is differentially expressed in CD34+cells from patients with DBA
(A) Increased BMI1 expression in CD34+ cells from some DBA patient samples as assayed by quantitative RT-PCR assays. BMI1 mRNA levels in normal human cord blood CD34+ cells were arbitrarily set to 1. (B) Reduced BMI1 expression in CD34+ cells from some DBA patient samples as assayed by quantitative RT-PCR assays. (C) The expression of some ribosomal protein genes in DBA patient samples with high BMI1 expression. Ribosomal protein gene expression levels in normal human cord blood CD34+ cells were arbitrarily set to 1. (D) Ribosomal protein gene expression in DBA patient samples with low BMI1 expression. (E) A schematic model showing how BMI1 regulates ribosome biogenesis in erythroid progenitor cells. BMI1 associates with the promoter of ribosomal protein genes
Author Manuscript
Author Manuscript
Author Manuscript
and positively regulate their expression. BMI1 promotes erythroid development through regulating ribosome biogenesis in erythroid progenitor cells (left panel). In the absence of BMI1, ribosome biogenesis is impaired. Defective ribosome biogenesis activates the p53 pathway, resulting in cell cycle arrest and impaired erythroid differentiation (right panel). Our work indicates that BMI1 deficiency may contribute to the pathogenesis of
ribosomopathies, including Diamond Blackfan anemia (DBA).