Université de Montréal
Processus de validation d’une base de données haute résolution dans une unité de soins intensifs pédiatriques
Par Audrey Mathieu
Programme de sciences biomédicales Faculté de médecine
Mémoire présenté à la faculté des Études Supérieures en vue de l’obtention du grade de Maîtrise en Sciences (M. Sc.)
en Sciences biomédicales option médecine expérimentale
Juin 2020
Université de Montréal Faculté de médecine
Ce mémoire intitulé
Processus de validation d’une base de données haute résolution dans une unité de soins intensifs pédiatriques
Présenté par
Audrey Mathieu
A été évalué(e) par un jury composé des personnes suivantes
Pierre Langlois Président-rapporteur Philippe Jouvet Directeur de recherche Mathieu Dehaes Membre du jury
Résumé
Objectif : Notre objectif était d’évaluer la qualité des données de la base de données haute résolution (BDHR) implantée dans l’unité de soins intensifs pédiatriques (USIP) de l’Hôpital Sainte-Justine (HSJ).
Type d’étude : Un rapport descriptif et une analyse d’une étude prospective de validation d’une BDHR.
Environnement : Une USIP de 32 lits, adaptée aux soins médicaux, chirurgicaux et cardiaques dans un centre tertiaire mère-enfant du Canada.
Population : Tous les patients admis à l’USIP et ayant un monitorage d’au moins 1 signe vital par un moniteur cardio-respiratoire.
Mesures et résultats principaux : Entre juin 2017 et août 2018, les données de 295 jours de patients ont été enregistrées à partir des appareils médicaux et 4465 données ont été filmées et comparées aux données correspondantes dans la BDHR de l’USIP de l’HSJ. Les analyses statistiques ont démontré en général une bonne corrélation, une excellente fiabilité et un bon agrément. Les graphiques de Bland-Altman ont aussi démontré l’exactitude et la précision entre les données récoltées et les données filmées selon les limites d’agrément cliniquement significatives préalablement définies.
Conclusions : Cette étude de validation exécutée sur un échantillon représentatif a démontré que la qualité des données était globalement excellente.
Abstract
Objective: Our objective was to evaluate the data quality of our high-resolution electronic database (HRDB) implemented in the pediatric intensive care unit (PICU) of HSJ.
Design: A descriptive report and analysis of a prospective validation of a HRDB.
Setting: A 32 beds pediatric medical, surgical and cardiac PICU in a tertiary care free-standing maternal-child health center in Canada.
Population: All patients admitted to the PICU with at least one vital sign recorded using a cardiorespiratory monitor connected to the central monitoring station.
Measurements and Main Results: Between June 2017 and August 2018, data from 295 patient days were recorded from medical devices and 4,645 data points were video recorded and compared to the corresponding data collected in the HSJ-PICU HRDB. Statistical analysis showed excellent overall correlation, agreement and reliability. Bland-Altman analysis showed excellent accuracy and precision between recorded and collected data within clinically significant pre-defined limits of agreement.
Conclusions: This prospective validation study performed on a representative sample showed excellent overall data quality.
Table des matières
Résumé ... 3
Abstract ... 4
Liste des tableaux ... 7
Liste des figures ... 8
Liste des sigles et des abréviations en français ... 9
Liste des sigles et des abréviations en anglais ... 10
Remerciements ... 12
Introduction ... 13
Problématique du travail ... 17
Article I: Qualitative subjective assessment of a high resolution database in a pediatric intensive care unit – Elaborating the perpetual patient’s ID card ... 18
1. Présentation ... 18
2. Objectif ... 18
3. Contribution ... 18
4. Article I ... 20
5. Conclusion ... 33
Article II: Validation Process of a High-Resolution Database in a Pediatric Intensive Care Unit – Describing the Perpetual Patient’s Validation ... 34
1. Présentation ... 34
2. Objectif ... 35
6 4. Contribution ... 35 5. Article II ... 37 Discussion ... 63 Conclusion ... 65 Bibliographie ... 66
Liste des tableaux
Tableau I : Principales données incluses dans la BDHR de l’USI de l’HSJ
Tableau II (Table I article I): Documentation et rapport sur la qualité des données Tableau III (Table I article II): Caractéristiques des patients inclus
Tableau IV (Table II article II): Comparaison entre les données de référence et les données de la base de données (BD)
Tableau V (Table III article II): Résumé descriptif des divergences entre la base de données (BD) et le dossier médical électronique (DME)
Liste des figures
Figure I (Figure I article I) : Évaluation de la base de données de l'USIP de l'hôpital Sainte Justine (HSJ) selon les critères du Directory of Clinical Databases (DoCDat) Figure II (Figure II article I) : Évaluation de la pertinence des critères du répertoire des bases de données (BD) cliniques
Figure III (Figure I article II) : Processus de validation des données Figure IV (Figure II article II): Corrélation et analyse de Bland-Altman
Figure V (Figure III article II): Représentation schématique d'une courbe de fréquence cardiaque avec une accélération significative
Figure VI (Figure IV article II): Corrélation entre le dossier médicale électronique (DME) et la base de données haute résolution (BDHR)
Figure VII (Contenu numérique supplémentaire I article II): Corrélation et analyse Bland et Altman pour les données des moniteurs
Figure VIII (Contenu numérique supplémentaire II article II): Corrélation et analyse de Bland et Altman pour les données des ventilateurs et les données des pompes à perfusion
Liste des sigles et des abréviations en français
BD: Base de donnéesBDHR : Base de données haute résolution DCI: Dénomination commune internationale DME : Dossier médical électronique
HSJ : Hôpital Sainte-Justine
CCI: Coefficient de corrélation intraclasse PiCCO: Débit cardiaque par contour de pouls USI : Unité de soins intensifs
Liste des sigles et des abréviations en anglais
CDSS: Clinical Decision Support SystemsCVP: Central Venous Pressure DB: Database
DBP: Diastolic Blood Pressure
DoCDAT: Directory of Clinical Databases DQC: Data Quality Collaborative
EMR: Electronic Medical Records EtCO2: End Tidal CO2
HRDB: High-Resolution Electronic Database HL7: Health Level 7
ICC: Intraclass Correlation Coefficient MBP: Mean Blood Pressure
MIMIC: Medical Information Mart for Intensive Care PEEP: Positive End-Expiratory Pressure
PELOD: Pediatric Logistic Organ Dysfunction PICU: Pediatric Intensive Care Unit
11 RR: Respiratory Rate
SBP: Systolic Blood Pressure SQL: Structured Query Language
T3: Trending, Tracking and Triggering System VE: Expiratory Tidal Volume
Remerciements
Je tiens d’abord à remercier Dr Philippe Jouvet, mon directeur de recherche, pour m’avoir initiée au monde de la recherche et pour m’avoir fait confiance dès le départ. Un merci tout particulier pour votre support, votre disponibilité et votre enthousiasme.
Je voudrais aussi remercier spécialement David Brossier pour m’avoir accueillie dans son projet, mais, aussi, pour tous tes conseils, pour ton souci du détail et pour tes connaissances en statistiques.
Merci à Michaël Sauthier pour m’avoir transmis une petite partie de tes connaissances en informatique sans quoi le projet n’aurait pas pu avoir lieu. Merci également pour ta disponibilité malgré la distance et pour tes bons conseils.
Merci aux membres du jury, Pierre Langois et Mathieu Dehaes, qui ont accepté́ d’évaluer et d’ajouter leur expertise à ce travail.
Merci à toute l’équipe de soins intensifs pédiatriques du CHU Sainte Justine, Baruch Toledano, Guillaume Emeriaud, Géraldine Pettersen, Catherine Litalien, Catherine Farrell, François Proulx, Jean-Sébastien Joyal, Karen Harrington, Marisa Tucci, Genevieve Du Pont Thibodeau, Laurence Ducharme Crevier.
Merci à Jordan pour m’avoir encouragée à entreprendre et à terminer ce mémoire. Merci pour tes conseils et ton soutien.
Merci à tous ceux qui ont contribué à ce travail par leur écoute, par leur soutien, par leurs encouragements.
Introduction
Dans les dernières décennies, la modernisation des services de santé a permis l’implantation de dispositifs de monitorage plus performants (moniteurs cardio-respiratoires, ventilateurs, pousse-seringues) (1,2,3,4,5). Ces dispositifs, utilisés pour assister les cliniciens dans leur prise en charge, génèrent une quantité considérable de données physiologiques, thérapeutiques et pharmaceutiques. Par défaut de recueil, ces données disparaissent aussi vite qu’elles sont affichées plutôt que d’être exploitées en recherche et en clinique. De plus, la complexité des malades hospitalisés dans les unités de soins intensifs (USI) et la nécessité d’intégrer un nombre croissant de données cliniques, paracliniques et thérapeutiques surpassant les capacités d’intégration du cerveau humain, justifient le recours des intensivistes à des outils d’aide à la décision diagnostique et/ou thérapeutique pour garantir aux patients une prise en charge optimale (6). Afin d’assurer l’adéquation ces outils d’aide à la décision avec la condition clinique du patient, il est nécessaire de développer des bases de données (BD) dont la granularité peut aller jusqu’à stocker l’ensemble des signaux physiologiques du patient (patient perpétuel) qui serviront à tester les systèmes d’aide à la décision en développement, mais aussi à modéliser ce comportement physiologique (patient virtuel) (7). Ceci nécessite l’acquisition et le stockage d’une quantité importante de données cliniques, paracliniques et thérapeutiques (8).
Il est donc apparu indispensable de créer des systèmes de collecte de biosignaux pour permettre l’acquisition, l’intégration, l’organisation et le stockage de toutes les données pertinentes dans une seule et même plateforme accessible aux cliniciens (9). Cela a mené à la création de BD électroniques (10, 11). De nombreux systèmes de collecte de données sont décrits dans la littérature médicale, dont plusieurs ont été développés au sein d’une USI (12, 13, 14, 15, 16, 17). Toutefois, peu de ces BD ont opté pour un système de collecte à haute résolution, c’est-à-dire un système permettant de recueillir des données cliniques sous format numérique à une fréquence supérieure à ce qui est retrouvée dans un dossier médical électronique (DME) usuel i.e. à plus d’une donnée par patient par minute (1,7 % 10!" '()(6). Pourtant, l’instabilité et la complexité des patients dans les USI
14 nécessitent le recueil de données à des intervalles plus rapprochés pour recréer exhaustivement la physiologie dynamique des patients (11).
Parmi ces bases de données haute résolution (BDHR) développées au sein d’une USI (12, 17, 18, 19), peu d’entre elles incluent des patients d’âge pédiatrique et/ou sont assez exhaustives en termes de données démographiques, thérapeutiques et médicales pour reproduire le portrait complet de l’évolution des patients et développer des systèmes d’aide à la décision clinique pédiatrique. C’est pourquoi l’équipe de l’unité de soins intensifs pédiatriques (USIP) de l’Hôpital Sainte-Justine (HSJ) a développé sa propre BDHR. L’USIP de l’HSJ est une unité de 32 lits adaptée aux soins médicaux, chirurgicaux et cardiaques dans un centre tertiaire mère-enfant. En 2013, l’USIP s’est équipée d’un système de DME adapté aux USI (IntelliSpace Critical Care and Anesthesia ® (ICCA ®), Koninklijke Philips Electronics, Netherlands). Bien qu’adapté aux USI, ce système de DME ne prenait pas en charge l’enregistrement à haute résolution des données. En 2015, l’équipe de l’USIP de l’HSJ a décidé de créer sa propre BDHR afin d’optimiser la recherche dans le service de réanimation pédiatrique. Cette BD a été conçue pour créer et pour valider des modèlesd’aide à la décision clinique en physiologie cardio-respiratoire. La BD repose sur une structure clé-valeur avec un schéma en étoile. Cette structure permet une grande polyvalence et facilite une utilisation diversifiée et pérenne des données. Les performances ont été évaluées sur une machine double cœur i5 (4 fils), 8 Go de RAM et un stockage de type RAID-5 sur des disques durs à plateau. Ce système relativement minimaliste n’a jamais été saturé dans nos tests et n’utilisait qu’entre 5-10% des ressources de la machine. Un système d’index adapté à nos besoins a été mis en place accélérant drastiquement l’extraction, sans ralentir l’insertions des données (entre 10000-15000 insertion par secondes environ). Les logiciels ont été développés spécifiquement pour ce projet et reposent principalement sur un programme multitâche en Python. Le système de gestion de la BD repose sur PostgreSQL et l’extraction des données se fait via le langage SQL standard. Chaque appareil de mesure transmet les données qu’il mesure selon ses propres étapes de validation et d’approbation avant sa mise en marché. Le système de collecte ne modifie aucunement les données produites et permet d’y stocker une gamme très étendue (datatype NUMERIC). La résolution temporelle est également dictée par les
15 appareils de mesure et se situe entre 0.03 Hz (1 point échantillonné par 30 secondes) pour certains appareils jusqu’au signal brut pouvant atteindre 500 Hz. Les connexions réseaux sont assurées par des systèmes commerciaux validés (notamment Capsule® recueillant divers signaux via Ethernet et RS232 et les moniteurs Intellivue®) grâce à un sous-réseau privé Ethernet au sein de l’architecture hospitalière. Les serveurs sont actuellement interconnectés en 10 Gbps.
Les données physiologiques numériques provenant des moniteurs sont enregistrées aux secondes et les données issues des ventilateurs et des pousse-seringues sont enregistrées aux 30 secondes dans la BD. La BD est également liée au DME du patient (ICCA®) qui inclut les données cliniques, physiologiques, démographiques et thérapeutiques de tous les patients admis à l’USI et ce de leur admission jusqu’à leur sortie. Le tableau I répertorie sommairement les types de données incluses. Le processus d’acquisition des données est toujours en cours. Entre le 1er juin 2017 et le 30 août 2018, les données de 1378 patients ont été inclus dans la BD (18).
16 Tableau I : Principales données incluses dans la BD de l’USI de l’HSJ
Traduit et adapté Brossier D. et al, 2018 [18]
Type de données Description Physiolog ique Respiratoir e
-Moniteur : Saturation pulsée, Fréquence respiratoire, Pression partielle de CO2 de fin d’expiration
-Respirateur : Ventilation-minute, Pression expiratoire positive, Pression inspiratoire, Volume expiré, Fréquence respiratoire, Volume courant…
-DME : Signes vitaux mesurés par l’infirmière
Hémodyna mique
-Moniteur : Fréquence cardiaque, Tension artérielle, Pression veineuse centrale, Pouls, Pression atriale…
-Données du moniteur de débit cardiaque par contour de pouls (PiCCO)
-DME : Signes vitaux mesurés par l’infirmière, Diurèse, Drain thoracique…
Neurologi que
-Moniteurs : Pression intracrânienne, Pression de perfusion cérébrale, Pression partielle d’O2 dans les tissus cérébraux.
-DME : Signes vitaux mesurés par l’infirmière, Pupille, Score de Glasgow…
Autre -Moniteur : Température… -DME : Évaluation de la douleur, Température…
Soin de support
Support Respiratoir
e
-Respirateur : Fréquence respiratoire, Pression expiratoire positive, Pression inspiratoire, Volume courant…
-DME : Données réglées par les inhalothérapeutes
Autre support
-DME : Dialyse, Circulation extracorporelle, Paramètres vérifiés par l’infirmière
Thérapeut ique
Perfusion continue
-Pousse-seringue : Débit, Dénomination commune internationale (DCI), Concentration
Perfusion discontinu
e
-Pousse-seringue : Débit, DCI, Concentration
Perfusion intermitten
te
-DME : DCI, Dose, Administration vérifiée par l’infirmière
Laboratoir e
-DME : Test sanguin, Analyse urinaire, Test microbiologique
Cliniques -DME: Diagnostic, Histoire médicale antérieure, Intervention, Cathéter…
Problématique du travail
Avant d’exploiter les données d’une BD en clinique et en recherche, il est nécessaire de s’assurer de leur qualité. Un processus de validation est donc essentiel (14, 20). En effet, la validité des données incluses dans une BD influence directement la valeur des résultats d’une étude (21, 22). L’exploitation d’une BD non validée préalablement pourrait mener à la production d’études de piètre qualité si les résultats s’appuyaient sur des données biaisées (21, 22). Toutefois, l’étape de validation est souvent omise ou peu décrite dans la littérature sur les BD médicales, particulièrement lorsque les données sont récoltées automatiquement à haute résolution. Ainsi, les problématiques autour de la validation de BDHR sont multiples. En regard de l’absence de lignes directrices décrivant la validation de BDHR, il semble nécessaire de créer et de décrire exhaustivement une méthode de validation de la qualité des données reproductible par d’autres équipes de recherche. De ce fait, l’étape de validation pourrait devenir une norme de pratique.
Article I: Qualitative subjective assessment of a high
resolution database in a pediatric intensive care unit –
Elaborating the perpetual patient’s ID card
1. Présentation
Dans le cadre des BDHR, nous avons constaté que les descriptions des procédures de validation sont insuffisantes (1, 23). En effet, certaines recherches reposent sur des BD non documentées dans la littérature ou elles ne décrivent pas la pertinence d'un processus de validation (1, 17, 19, 23). Il existe actuellement certaines lignes directrices pour évaluer la qualité d’une BD ou pour encadrer la création d’une BD haute qualité (24, 25). Toutefois, ces lignes directrices sont adaptées aux BD à basse résolution (1.7 x 10⁻² Hz) ou collectées manuellement (24, 25). Parmi celles-ci, on retrouve les critères publiés par « Directory of Clinical Databases » (DoCDAT), dont l’objectif était de créer une méthode d’évaluation de la qualité des données comparable entre les BD (25). On retrouve également les lignes directrices du Data Quality Collaborative (DQC) publiées par Kahn et al. (24). En appliquant ces critères d’évaluation à notre BDHR, nous ne cherchons pas à évaluer la qualité, la fiabilité et la précision des données, mais plutôt à publier une représentation qualitative globale de notre BD et de la validité de son contenu (23).
2. Objectif
L’objectif de ce travail était d’évaluer la qualité de la BD dans son ensemble et fournir à de futurs utilisateurs une description de ses caractéristiques.
3.
Contribution
Cette publication avait comme objectif de fournir une évaluation de la BDHR complétée par ses concepteurs et ses premiers utilisateurs. J’y ai contribué en complétant l’évaluation subjective qualitative de la BD en utilisant les critères DoCDat. De plus, j’ai
19 aidé à rédiger l’article notamment le rapport sur la qualité des données du DQC, et à réviser l’article dans sa forme finale.
20
4. Article I
21 INTRODUCTION
Over the last two decades, numerous health care electronic databases were created, especially in intensive care units (ICUs) (1-3). Among these databases, high frequency electronic databases (data collection rate > 1 per min) were developed using the existing bedside information systems and hospital network architecture to automatically collect and store the data (1, 3, 4). Our team recently published the descriptive report and analysis of a prospective automatically collected database in the pediatric ICU (PICU) i.e. PICU HRDB (1). Given the tremendous amount of data that are automatically collected, it is crucial that database quality be validated based on standardized and well-defined criteria before using the data for research purposes (5, 6). In 2003, the Directory of Clinical Databases (DoCDat) published guidelines to standardize the quality assessment of databases and stored data (7). These criteria assess database quality regarding three main categories: the ability of the database to represent the population that it intends to describe, the completeness of the collected data and the accuracy of the data gathered (2, 7). Several years later, the Data Quality Collaborative (DQC) edited data quality reporting guidelines (6, 8). These guidelines were elaborated in the context of electronic medical records (EMR) based database and research. The reports are recommended to be organized in four sections: data capture description, data processing descriptions, data elements characterization and analysis-specific data elements characterization. The main purpose of our study was to subjectively assess the quality of a PICU HRDB according to the DoCDat criteria. The secondary objective was to compare the quality assessment results to the median levels of performance of previously assessed databases. As a third objective, the assessment results of this study helped the HRDB designers completing the DQC report table and thus providing a more comprehensive description of this database.
22 METHODS
A survey was conducted between April 1st and June 15th, 2018 among the Sainte-Justine PICU research group. This study was approved by the Sainte-Sainte-Justine University hospital ethical Committee (number 2016-1210, 4061) as part of the Sainte-Justine PICU database validation process.
All individuals who developed or used the Sainte-Justine PICU HRDB were included and completed a two-part survey. The first part was a qualitative subjective assessment of the database using the DoCDat criteria (fig 1) (2, 7). The 10 criteria were rated on a 1 (worst) to 4 (best) numeric scale (fig 1). The second part of the survey consisted in a subjective assessment of the appropriateness of each DoCDat criterion with a 5-level Likert scale regarding assessment of high frequency electronic databases. The answers were anonymized before analysis.
The survey results regarding performance level of our database were compared to the available median levels of performance of all previously assessed databases for each DoCDat criteria, as previously described by Stow et al. (2) (fig 1). To perform this comparison, we used the median levels of performance provided in 2006 by Stow et al. (2). The databases included in this article (2) followed the DoCDat clinical databases inclusion criteria defined by Black et al (7). These criteria were as follows: gathered in the United Kingdom; providing individual level information on health care recipients; a scope defined by a common condition, intervention or facility at inclusion in the database; data from more than one health care provider. The main areas of the DoCDat included databases were general, cancer, surgical, congenital anomalies and traumatic and intensive care (9). Continuous variables were expressed as medians (1st and 3rd quartiles).
Based on the survey results and on the previous description of the database gathering process (1), DQC data quality report was edited by the Sainte-Justine PICU HRDB designers.
23 Figure I: Assessment of the Hospital Sainte Justine PICU database according to the Directory of Clinical Databases (DoCDat) criteria (adapted from Black and Payne (7))
Data are expressed as median (1st and 3rd quartiles).
Survey results regarding performance level of the Sainte Justine PICU database. Available median levels of performance of all previously assessed databases
24 RESULTS
All ten research team members (100% response rate) who used the high-resolution database fulfilled the survey (one Information Technology (IT) specialist, one junior medical student and eight clinician researchers including two MD PhDs and five MD PhD candidates). Six were involved in the database design and four were database users only.
The median quality level across all of the 10 criteria was 3 [IQR: 2 - 4]. When compared with the median levels of previously reported database quality performance (2), the Sainte Justine PICU database seemed to perform better regarding 5 criteria, performed as well for 1, and worse for 4 (fig 1). The 10 criteria were considered appropriate by the responders regarding the assessment of a PICU HRDB (fig 2).
25 Figure II: Assessment of the appropriateness of the Directory of Clinical Databases criteria
The DQC data quality report was partially fulfilled (table 1) based on the database description (1) and survey results. Details on data validation rules (item 10, section data processing) and data elements characterization were incomplete as the validation process is ongoing (10). Analysis and specific data quality documentation were not reported as not routinely performed.
26 Table I: Data quality documentation and reporting based (adapted on (6))
HSJ HRDB: Hospital Sainte Justine High Resolution Database, EMR: Electronic Medical Record, HL7: Health Language 7, PICU: Pediatric Intensive Care Unit, CDSS: Clinical Decision Support System, SQL: Structured Query Language, EAV: entity-attribute-value. NA: Not applicable.
Data capture
1. Original data source
1) Data Origin Biomedical data collected in the HSJ HRDB are collected from devices available at beside. Biomedical data from the devices come from two temporary servers: one storing the monitors data including 1 Hz data and raw signal (62-500 Hz) and the second from the other biomedical devices (infusion pumps, ventilator and other devices) between 0.2 and 0.03 Hz. No transformation occurs at this stage.
The HSJ HRDB is linked with the EMR database. Demographic, clinical, laboratory and treatment data come from the EMR without any transformation. In the EMR, data are collected from their original source: ADT [admission-discharge-transfer], medical and nursing notes and pharmacy.
2) Data capture method High Frequency Automatic Collection is performed through HL7 protocol, SQL queries and direct entry from the caregivers
3) Original collection purpose PICU / Research purpose, CDSS elaboration 2. Data steward information
4) Data steward Public University Hospital: Sainte Justine Hospital PICU Research Group.
5) Data set structure Data are store in a SQL database. Biomedical data are stored on a flexible EAV structure with values being separated in numerical and textual data. A local ontology has been built on the keys from the different devices. Raw signals are stored by 5 seconds blocs of consecutive y-coordinates.
27
In the EMR, most of the fields filled by clinicians are drop-down menus and presuggested lists, except for daily notes that are free text.
6) Data set definitions The ontology used with the EAV has a description for each key. For example, a key could be “pulse rate - arterial line” and would be stored in a specific row along with the patient identifier, the datetime and up to two modifiers.
Data processing / Data provenance
7) Data extraction specifications Except for backup, there is no automatic extraction. All extractions are personalized. A graphical user interface to extract the data is currently being tested.
8) Mappings from original to standardized values
Two small modifications are performed at the insertion: - The time zone is added to every datetime
- Patient identification is verified with the bed identifier and the datetime of each data.
9) Data management organization No alteration of the data is performed in the database. Some frequently grouped data (e.g. blood gases) are preidentified in a separate table. Other modifications are only performed after the data extraction. We stored frequent queries (SQL views) for patient lists or severity scores.
10) Data processing validation routines Dataset comparison against raw data extracted from source. Sample validation.
ONGOING PROCESS
11) Audit trail As no modification is performed on data, each user of the database is responsible for doing its own track change.
28 Data elements characterization
12) Data format Dataset comparison against raw data extracted from source. Sample validation.
ONGOING PROCESS
Exact numerical values are stored. 13) Single element data descriptive
statistics
Dataset comparison against raw data extracted from source. Sample validation.
ONGOING PROCESS
14) Temporal constraints Dataset comparison against raw data extracted from source. Sample validation.
ONGOING PROCESS
15) Consistency Dataset comparison against raw data extracted from source. Sample validation.
ONGOING PROCESS Analysis-specific data quality documentation
16) Data Cleansing/customization Dataset comparison against raw data extracted from source. Sample validation.
ONGOING PROCESS Data quality checks of key variables:
17) Used for cohort identification NA 18) Used for outcome categorization NA 19) Used to classify exposure NA 20) Confounding variables NA
29 DISCUSSION
A way of comparing available datasets and reporting their quality would be of great interest. Several guidelines tend to guide data quality reporting. None has been especially elaborated to report data quality regarding high frequency electronic databases (6, 11). Thus, we are left with using criteria developed for a former time (2, 7), for data collected in a lower volume and/or a lower rate (6, 8). To perform this PICU HRDB qualitative subjective assessment we choose to apply the DoCDat assessment method to a HRDB derived from one ICU, in a new setting, different from any of the previous reports (2, 7). The DoCDat assessment method was historically created to compare national registries to each other (2, 7). Other methods have been proposed, such as the Hall et al. “checklist for investigators in database research” (12) and the Arts et al. “framework of procedures for the assurance of data quality in medical registries” (2, 13). The Hall et al. “checklist” provides more information to users but is complex, non-user friendly and seems inappropriate to compare databases quality performance between them as it’s restricted to pharmacoepidemiology (12) . The Arts et al framework was elaborated to guide national multicenter registry builders at each steps of the data collection at the initiation of their registry. Very useful regarding registry creation, this framework appears inappropriate to described HRDB in a reproductive and a more objective way (2, 13).
The quality assessment using DoCDat criteria of a PICU HRDB combined to the EMR documented an overall good quality level. The eligible patient population was considered partially representative of the country, but the recruitment was considered high. Indeed, this database includes data from every patient admitted in the largest PICU in Quebec but doesn’t include data from the other PICUs in this province. The database is linked to the patients’ PICU EMR, so the collected variables included short-term outcomes until PICU discharge and some major confounders, but the database also gathered physiologic and biomedical signals. The completeness of the data collection was considered high and numerous data are collected as raw data directly from monitors, ventilators and infusion pumps. The use of explicit definitions for variables, explicit rules for collection and the reliability of coding were considered as fair as most of the included data were directly collected from medical devices available at the bedside used in daily practice. This
30 subjective qualitative assessment based on the DoCDat criteria appears of great interest. It depicts a global picture of the database to potential future users with information on the population studied, the data collected and data characteristics. However, given the actual DocDat criteria structure it is impossible to account for the type of clinical data gathered, thus sub criteria could be added to describe their nature. For example, each performance level could include a sub performance level 1 for not gathering any clinical data, 2 for gathering laboratory data only (hemoglobin, lactates, etc.), 3 for biometric data only (heart rate, blood pressure, etc.) and 4 for gathering both laboratory and clinical data. A database could then obtain a 2.2 or 3.4 level of quality performance on this criterion for example. Besides, major biases must be considered as the people who designed and use the database performed the evaluation.
Based on the database description and this collaborative assessment, we could partially fill the DQC data quality report. Thus, this report remains insufficient to guarantee the validity, the reproducibility, the reliability, the accuracy or the rightfulness of the dataset. Further independent data validation procedures should be performed (2, 6-8) and are currently ongoing on this specific database (10).
In our opinion, high frequency database creators around the world should gather to elaborate guidelines regarding high frequency automatically collected database quality assessment and dataset validation procedures to better understand the strengths and the weaknesses of their HRDB.
CONCLUSION
Data quality assessment is rarely described. Nevertheless, it is crucial to ensure the scientific validity of conclusions drawn from that data analysis. We subjectively assessed our previously reported PICU HRDB with the DoCDat criteria and found that its quality was comparable to previously reported results.
31 REFERENCES
1- Brossier D, El Taani R, Sauthier M, Roumeliotis N, Emeriaud G, Jouvet P. Creating a High-Frequency Electronic Database in the PICU: The Perpetual Patient. Pediatr Crit Care Med. 2018;19(4):e189-e98. (31)
2- Stow PJ, Hart GK, Higlett T, George C, Herkes R, McWilliam D, et al. Development and implementation of a high-quality clinical database: the Australian and New Zealand Intensive Care Society Adult Patient Database. J Crit Care. 2006;21(2):133-41. (116)
3- Johnson AE, Pollard TJ, Shen L, Lehman LW, Feng M, Ghassemi M, et al. MIMIC-III, a freely accessible critical care database. Sci Data. 2016;3:160035. (147) 4- Celi LA, Csete M, Stone D. Optimal data systems: the future of clinical predictions
and decision support. Curr Opin Crit Care. 2014;20(5):573-80. (16)
5- Sukumar SR, Natarajan R, Ferrell RK. Quality of Big Data in health care. International journal of health care quality assurance. 2015;28(6):621-34. (175) 6- Kahn MG, Brown JS, Chun AT, Davidson BN, Meeker D, Ryan PB, et al.
Transparent reporting of data quality in distributed data networks. EGEMS (Washington, DC). 2015;3(1):1052. (62)
7- Black N, Payne M. Directory of clinical databases: improving and promoting their use. Quality & safety in health care. 2003;12(5):348-52. (162)
8- Kahn MG, Raebel MA, Glanz JM, Riedlinger K, Steiner JF. A Pragmatic Framework for Single-site and Multisite Data Quality Assessment in Electronic Health Record-based Clinical Research. Med Care. 2012;50(0). (171)
9- Black N, Barker M, Payne M. Cross sectional survey of multicentre clinical databases in the United Kingdom. BMJ. 2004;328(7454):1478. (174)
10- Mathieu A, Brossier D, Eltaani R, Sauthier M, Goyer I, Emeriaud G, Jouvet P. Creating a High Resolution Electronic Database in the Pediatric Intensive Care Unit: Validation phase. Ann Intens Care. 2018;8(Suppl 1):F-68. (65)
11- Brown JS, Kahn M, Toh S. Data quality assessment for comparative effectiveness research in distributed data networks. Med Care. 2013;51(8 Suppl 3):S22-9. (63)
32 12- Hall GC, Sauer B, Bourke A, Brown JS, Reynolds MW, LoCasale R. Guidelines for good database selection and use in pharmacoepidemiology research. Pharmacoepidemiology and drug safety. 2012;21(1):1-10. (172)
13- Arts DG, De Keizer NF, Scheffer GJ. Defining and improving data quality in medical registries: a literature review, case study, and generic framework. Journal of the American Medical Informatics Association: JAMIA. 2002;9(6):600-11. (173)
33
5. Conclusion
En réalisant cette évaluation, nous rendons notre BD accessible à la comparaison et nous apportons des informations nécessaires à son utilisation. Toutefois, cette étape n’est pas suffisante pour garantir la qualité des données incluses dans la BD. Elle nous donne une idée qualitative de la qualité de la BDHR. D’autres étapes sont nécessaires pour donner une idée quantitative de la qualité de la BDHR. L’élaboration de ces étapes complémentaires de validation constitue l’objectif principal de l’article II et de mon projet de maîtrise.
Article II: Validation Process of a High-Resolution
Database in a Pediatric Intensive Care Unit – Describing
the Perpetual Patient’s Validation
1. Présentation
La définition de la qualité des données est un concept mal défini dans la littérature. (13, 22, 26, 27). Selon « International Standards Organisation » (ISO), la qualité d’un ensemble de données se définit par « L’ensemble des caractéristiques d’un groupe de données, qui influence leur capacité à satisfaire les besoins liés à leur usage prévu » (ISO 8402-1986, Quality-Vocabulary) (26, 28). En d’autres mots, les données d’une BD doivent être adaptées à leur usage et posséder les caractéristiques essentielles pour permettre leur exploitation (16, 26). Dans le même sens, Kahn et al. utilisent le concept de « fitness for use » pour définir la qualité des données (22). À ce jour, plusieurs termes différents sont utilisés dans la littérature pour caractériser ce concept de qualité tels que l’exactitude, l’exhaustivité, la précision, la fiabilité, la corrélation, la robustesse, la cohérence, etc. (26). Pour l’évaluation de la qualité des données de la BDHR, nous nous sommes restreints à trois métriques soit la précision, la fiabilité et la robustesse. La précision est liée à la distribution des valeurs expérimentales (29). Elle représente la capacité des données à représenter parfaitement la réalité (9, 26). Elle est évaluée par l'accord absolu, la différence moyenne et l'analyse de Bland & Altman. La robustesse correspond à la capacité des données à rester stable et fiable dans le temps et selon les conditions (29). Elle est mesurée à partir du coefficient de corrélation intraclasse et de l’analyse de Bland-Altman. La fiabilité correspond à l’aptitude à reproduire les données dans des conditions définies, soit la corrélation et la concordance entre les données expérimentales et cliniques (30, 31). Elle peut être mesurée à partir du coefficient de corrélation intraclasse (31). Ces trois métriques ont été ciblées particulièrement, car ce sont les caractéristiques qui sont essentielles pour
35 permettre l’exploitation d’une BDHR. Pour évaluer la précision, la robustesse et la fiabilité, les lignes directrices créées par le DoCDAT et le DQC ne sont pas assez exhaustives. En plus, la littérature scientifique documente peu de processus de validation pour des BDHR (4, 17, 19, 23). Ainsi, l’élaboration d’un processus de validation est basée essentiellement sur l’expérience scientifique et sur les BD électroniques déjà décrites (1, 4, 5, 13, 16, 32, 33, 34, 35).
2. Objectif
L’objectif principal de cette étude est de tester la fiabilité, la précision et la robustesse de notre BDHR. L’objectif secondaire est d’identifier et de corriger les voies de transmission des signaux à l’origine d’erreurs ou d’imprécisions.
3. Hypothèse
L’hypothèse est que 100% des données patients affichées par les moniteurs, respirateurs et pousse-seringues à l’USIP sont collectées sans erreur de transcription dans la BDHR.
4. Contribution
Cette publication avait pour but d’évaluer le processus de collecte de données et d’évaluer la qualité des données incluses dans la BDHR. Après une formation en éthique clinique, j’ai réalisé le travail de collecte de données. Les données affichées sur les appareils correspondent aux données de référence et celles transmises par le réseau constituent les données expérimentales. Les données de référence étaient récoltées par enregistrement vidéo au chevet des patients à l’USI. Les données concomitantes étaient extraites de la BD. J’ai également réalisé le travail d’analyse des données. Nous avons choisi d’utiliser la méthode de Bland-Altman pour comparer les données entre elles ainsi que pour étudier leur précision et leur robustesse. Pour mesurer la fiabilité, le coefficient de corrélation intraclasse a été ajouté à l’analyse. De plus, nous avons choisi 14
36 médicaments à différents dosages utilisés quotidiennement à l’USIP et nous avons comparé le nombre de patients prenant chacun de ces médicaments entre le DME ICCA® et la BD durant la période de l’étude (31 août 2017 au 1er août 2018). Puis, les données issues de la BD et du DME ont été comparées à l’aide d’un nuage de point et du coefficient de détermination. L’objectif de cette analyse était d’identifier rapidement si nous avions des incohérences dans le temps entre la BD et la prise en charge réelle des patients. Enfin, j’ai réalisé le travail de rédaction de l’article sous supervision et j’en ai fait présentation du travail à plusieurs congrès dont le congrès international de la Société de Réanimation de Langue Française (36).
37
5. Article II
38 Abstract:
Objective: High data quality is essential to ensure the validity of clinical and research inferences based on the corresponding data. However, these data quality assessments are often missing even though these data are used in daily practice and research. Our objective was to evaluate the data quality of our high-resolution electronic database (HRDB) implemented in our pediatric intensive care unit (PICU).
Design: A prospective validation study of a HRDB.
Setting: A 32-bed pediatric medical, surgical and cardiac PICU in a tertiary care freestanding maternal-child health center in Canada.
Population: All patients admitted to the PICU with at least one vital sign monitored using a cardiorespiratory monitor connected to the central monitoring station.
Interventions: None
Measurements and Main Results: Between June 2017 and August 2018, data from 295 patient days were recorded from medical devices and 4,645 data points were video recorded and compared to the corresponding data collected in the HRDB. Statistical analysis showed excellent overall correlation (R2=1), accuracy (100%), agreement (bias=0, limits of agreement=0), completeness (2% missing data) and reliability (ICC=1) between recorded and collected data within clinically significant pre-defined limits of agreement. Divergent points could all be explained.
Conclusions: This prospective validation of a representative sample showed excellent overall data quality.
39 1. INTRODUCTION
Over the past two decades, technological and computer advances were used extensively to modernize medicine and assist medical teams in daily practice, as shown by the widespread use of electronic medical records (EMR) or connected biomedical devices. While the dedicated purpose in health care services is patient management, these systems have been perceived by many scientists as a way of improving clinical research efficiency and data analysis 1–4. As a result, many medical databases (DB) have been built since the beginning of the twenty-first century 4–6.To optimize our research quality in our different fields of expertise such as respiratory physiology and the development of clinical decision support systems (CDSS) 7, we implemented in 2015 an automated electronic data gathering process in our pediatric intensive care unit (PICU) 8. This DB was designed to develop and validate virtual or synthetic patients for cardiorespiratory physiology as well as for CDSS and data-driven learning systems 8. However, a validation step of the collected data is necessary before considering this DB suitable for research purposes9–11. Indeed, the value of research findings depends on data quality 12,13. Several guidelines or frameworks were elaborated to evaluate and report the quality of DBs and national registries and to guide designers of DBs at each step of the data collection 12,14,15. These documents highlighted the need to evaluate data quality, to compare dataset quality performance between them and raised the question of data validity that every scientist or clinician, as data users, deal with whether in day-to-day clinical care decision-making or in medical research 16,17. However, none of these guidelines provide a detailed validation process that is entirely suitable for high resolution electronic DB (HRDB), defined as a database that collects more than one data point per minute per variable and per patient. Besides, to our knowledge, none of the HRDB published a detailed validation procedure and evaluation of the quality of the data 18–20. This article constitutes the final part of the validation process of our HRDB 8,11. The purpose of this study was to assess the quality of the data include in our HRDB and to provide a generalizable validation method for all HRDB.
40 2. METHODS
This study was a prospective data quality assessment conducted in the PICU of Sainte-Justine Hospital (Montreal, Canada), a pediatric 32-bed medical, surgical and cardiac ICU in a free-standing tertiary maternal-child health center. The study was performed between June 2017 and August 2018.
2.1 Population
Eligible patients were those admitted to the PICU with at least one vital sign monitored using a cardiorespiratory monitor connected to the central monitoring station. Patients were excluded if the presence of one study observer in the patient room was considered incompatible or inappropriate by the physician or the nurse in charge.
2.2 Standard management
As previously reported 8, as a standard of practice in our PICU, all physiological, therapeutic and clinical data from medical devices available at the bedside of all children admitted in the PICU were continuously collected in an organized HRDB linked to the EMR from admission to discharge of the PICU 8. Biomedical signals from the monitors were sampled and recorded every 5 seconds while data from ventilators and infusion pumps were recorded every 30 seconds. The full details of the HRDB structure were previously reported 8.
2.3 Study protocol
The study was divided in three periods of 14, 16 and 17 days respectively (convenient samples, depending on AM availability): the first was dedicated to data from the monitors, the second to the data from the ventilators and the third to the infusion pumps. During the first period, data were collected on devices that displayed the monitored data outside of the patient’s room, as often as possible for patient comfort and efficiency of the
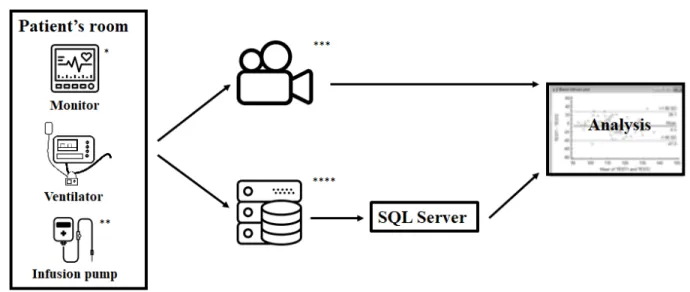
41 data collection, whereas both second and third period took place at the bedside. On every study day, a sample of 20% of the children hospitalized in the PICU that met the inclusion criteria was randomly selected. One patient could have been included more than once. A videotape of the data displayed on the medical devices (monitors, ventilators and infusion pumps), such as heart rate or positive inspiratory pressure (Figure 1) was recorded.
Figure I: Data validation process
* Icons made by monkik from www.flaticon.com, ** Icons made by Freepik from
www.flaticon.com, *** Icons made by Chris Veigt from www.flaticon.com, **** Icons
made by Smashicons from www.flaticon.com.
Each day, a time synchronization process with the automatically calibrated clocks of the hospital and the video recorder was made. Each monitor (IntelliVue MP60, MP70 and MX800, Koninklijke Philips Electronics, Amsterdam, the Netherlands) was video recorded for 30 seconds, each ventilator (Servo-I®, Maquet, Getinge, Sweden) for 90 seconds and each infusion pump (Infusomat®, B. Braun Medical Inc, Bethlehem, Pennsylvania, U.S.) was simply photographed. Since ventilator data are recorded every 30 seconds in the HRDB, 90 seconds was enough to get at least two consecutive records in the HRDB. Because the infusion pumps parameters are only set, and not measured, static
42 pictures were considered sufficient. The data displayed on the devices were then manually extracted into a spreadsheet from the pictures or at every second from the videotape. These data, collected by one independent observer (AM) who was not implicated in patients’ care, were considered as the reference data. Three types of data from medical devices were collected (Figure 1): 1) Physiologic signals from patient monitors (heart rate, oxygen saturation and systolic, diastolic and mean blood pressure) 2) Respiratory and ventilator parameters from the ventilator (positive end-expiratory pressure, peak inspiratory pressure, respiratory rate, respiratory minute volume) 3) Pharmacotherapy from the infusion pumps (ex: drug names and infusion rate). The corresponding HRDB data were extracted using structured query language (SQL) and used for comparison (Figure 1).
2.4 Endpoints
The primary endpoints were the absolute value of the selected variables (heart rate (HR) and pulse oximetry (SpO2)) recorded from the monitors. The secondary endpoints were:
- The absolute value of the selected variables recorded from the monitors when available: respiratory rate (RR), pulse, End tidal CO2 (EtCO2), invasive arterial blood pressure (systolic (SBP), diastolic (DBP) and mean blood pressure (MBP)) and central venous pressure (CVP)
- The absolute value of the selected variables recorded from the ventilators: positive end-expiratory pressure (PEEP), positive inspiratory pressure (PIP), respiratory rate (RR), minute ventilation (VM), expiratory tidal volume (VE)
- The infusion rate
- The infused drugs’ name - The recording time of the data
43
2.5 Statistical analysis and features’ definition
Reference data were compared to the experimental data simultaneously collected in the PICU HRDB at a specific time point for each patient. Variables were expressed as mean ± standard deviation or median [minimal – maximal value] for continuous variables, depending on whether they followed a normal distribution (Shapiro-Wilk normality test) and count (percentage) for categorical variables. Comparisons between experimental and reference data were made by dependent tests as appropriate.
Under the concept of quality lies several features that tend to delineate the degree to which the HRDB is a true representation of the reality of the PICU’s data 14,21
- The accuracy is defined as the closeness of agreement between the experimental and the reference data. Accuracy refers to both trueness and precision. Trueness is expressed in terms of bias and corresponds to the difference between experimental and reference values. Precision relates to the distribution of the experimental values. The agreement between experimental and reference data was evaluated for each parameter measuring the absolute agreement, the mean difference 22 and using the Bland & Altman analysis. Bias and limits of agreement were calculated with the R statistical package “Bland Altman” 23 based on both the original method (the difference of the two paired measurements was plotted against the mean of the two) and the modified one (the difference of the two paired measurements was plotted against the value of the reference data) of the Bland Altman analysis 24,25. In theory, the data should not be modified between the measure (monitor) and the storage (database) and the accuracy should be perfect. However, the rounding process could slightly impact accuracy. Moreover, accuracy implies more than just the data itself: metadata, such as timestamps and patient identifiers, could also impact accuracy in case of asynchrony for example (e.g. in cases where timestamps differ between the DB and the medical devices). Acceptable clinically significant limits of agreement were defined by the intensive care physicians in our team (MS, PJ, GE, DB) as the upper and lower limits above and under which a difference between experimental and reference data could induce a therapeutic intervention. These limits were a
44
priori determined as ±5% of the mean of the reference.
- The correlation, defined as the association between reference and experimental data, was evaluated by the determination coefficient (R2).
- The reliability, defined as the degree to which measurements can be reproduced, echoes both agreement and correlation between experimental and reference data. It was evaluated by intraclass correlation coefficients (ICC) for each parameter. ICCs estimates, 95% confidence intervals and F test results were calculated with the R statistical packages “irr” 26 and “psych” 22 using a single measurement, agreement, two-way mixed effect model 27.
- The completeness is related to the amount and the nature of the missing data and is defined as the extent to which the data that should have been included were indeed included. To evaluate the completeness, we confronted the experimental data with the reference data and specifically looked for the missing data in each dataset. Besides, to complete this evaluation of the completeness, the data of infusion pumps within the HRDB were compared to the corresponding data in the EMR. We compared, for each selected patient, throughout the day, the data recorded in the HRDB to those recorded in the EMR for each infusion. Additionally, we selected 14 daily used PICU drugs and their respective standardized concentration (sedative, analgesic and vasoactive drugs) and compared the correlation between the HRDB and the EMR within the study period (from August 31, 2017, to August 1, 2018). Because of a different data structure and a variable recording rate in the EMR, this second time completeness assessment couldn’t be performed with the monitoring and the ventilator data.
All analyses were performed after the exclusion of the paired measurements when one of the experimental or reference data was missing. Thus, we intended to differentiate inaccurate data from missing data. A p-value < 0.05 was considered statistically significant. Statistical analyses were performed using open access R software (version 3.5.1, 2018-07-02, http://cran.r-project.org/).
45
Ethics: The study was approved by the institutional review board of Sainte-Justine Hospital
(reference number 2016-1210, 4061). The exploitation of the HRDB is regulated by a DB policy validated by the institutional review board and no protected health information were stored in the HRDB nor in the video recordings. No patients or caregivers were recorded in the videos.
3. RESULTS
Between June 1, 2017, and August 30, 2018, 1378 patients were admitted to the PICU and 100% were included in the HRDB. During the effective 47 days of study, 81 patients were hospitalized in PICU and 81 (100 %) were included in the HRDB. Data from 70 patients (86 %), 295 patient days, were recorded from medical devices (Table 1) and 4645 data points were video recorded and compared to the corresponding data collected in the HRDB (Table 2).
3.1 Monitor data validity
Statistical analysis showed overall excellent correlation, agreement and reliability, as shown in Table 2. The term excellent refers to the fact that results are statistically and clinically significant. ICCs were considered excellent as for all the tested variables (Table 2). Bland-Altman analysis showed excellent accuracy and precision between recorded and collected data within clinically significant pre-defined limits of agreement (Supplemental Digital Content 1). A single heart rate measurement in the experimental data (0.03 %) was considered as clinically different from the reference data (Figure 2,3). We documented 74 data points (2 %) that were missing, as detailed in Table 2.
46 Table I: Patients’ characteristics
Characteristics of all patients included (n=70)
Age (years), median [min-max] 3 [0.0- 20]
Weight (kg), median [min-max] 11.2 [2.1-81.8]
PELOD2, median [min-max] 6 [0-24]
Main diagnostic category at admission, n (%)
Post-surgical care 12 (17.1%)
Post-cardiac surgery care 7 (10.0%)
Cardiac 14 (20.0%) Pulmonary 10 (14.3%) Neurologic 7 (10.0%) Infectious 6 (8.6%) Accidents (Traumatism/Burn/Intoxication) 5 (7.2%) Others 9 (12.9%)
Characteristics of the data studied (n=4645)
n (%) Total recording time (s)
Monitors’ data 3703 (79.7%)
Heart rate (beats per minute) 1104 (23.8%) 10202
Respiratory rate (breaths per minute) 1079 (23.2%) 10281
Pulse oxymetry (%) 975 (21.0%) 9907
Pulse (beats per minute) 316 (6.8%) 2839
Expiratory tidal CO2 (mmHg) 12 (0.3%) 131
Systolic blood pressure (mmHg) 54 (1.2%) 529
Diastolic blood pressure (mmHg) 54 (1.2%) 529
Mean blood pressure (mmHg) 66 (1.4%) 527
Central Venous pressure (mmHg) 43 (0.9%) 224
Ventilators’ data 670 (14.4%)
Positive end expiratory pressure (cmH2O) 134 (2.9%) 4230
Positive inspiratory pressure (cmH2O) 134 (2.9%) 4230
Measured respiratory rate (breaths per minute) 134 (2.9%) 4230
Measured expiratory Tidal Volume (ml) 134 (2.9%) 4230
Minute ventilation (L/min) 134 (2.9%) 4230
Infusion pumps
47 Figure II: Correlation and Bland-Altman plot
a. Heart rate. Average bias of -0.02 bpm (95% Confidence Interval +/- 0.03) and limits of agreement (Average bias +/- 1.96 standard deviation) -1.05;1.01 (95% Confidence Interval +/- 0.05). Acceptable limits of agreement -5; +5 bpm. b. Positive inspiratory pressure. Average bias of -0.02 cmH20 (95% Confident Interval +/- 0.02) and limits of agreement (Average bias +/- 1.96 standard deviation) -0.23;0.18 (95% Confident Interval +/- 0.03). Acceptable limits of agreement -1; +1 cmH2O.
48 Figure III: Schematic representation of a heart rate curve with a significant acceleration HR: Heart Rate
49
Reference Database
Mean
difference Agreement p R2* (CI95%) ICC**
Median
[min-max] Missing data Median [min-max]
Monitors’ data 74 (2%)
Heart rate (bpm) 117 [49-199] 25 (2%) 117 [49-199] -0.019 99.7% 0.18 1 1 (1-1) Respiratory rate (bpm) 28 [11-89] 8 (1%) 28 [11-89] -0.001 99.9% 1 1 1 (1-1) Pulse oxymetry (%) 100 [74-100] 10 (1%) 100 [74-100] 0 100.0% NA 1 1 (1-1) Pulse (bpm) 120 [35-173] 12 (4%) 120 [35-173] 0 100.0% NA 1 1 (1-1) End tidal CO2 (mmHg) 33 [19-49] 1 (1%) 33 [19-49] 0 100.0% NA 1 1 (1-1) Systolic blood pressure (mmHg) 92.5 [78-128] 6 (11%) 94 [78-128] 0 100.0% NA 1 1 (1-1) Diastolic blood pressure (mmHg) 51 [44-76] 6 (11%) 51 [44-76] 0 100.0% NA 1 1 (1-1) Mean blood pressure (mmHg) 66 [55-97] 6 (9%) 66.5 [55-97] 0 100.0% NA 1 1 (1-1)
Central venous pressure (mmHg) 9 [6-25] 0 9 [6-25] 0 100.0% NA 1 1 (1-1)
Ventilators’ data 0
Positive end expiratory pressure
(cmH2O) 7 [5-13] 0 7 [5-13] 0 100% NA 1 1 (1-1)
Positive inspiratory pressure (cmH2O) 18 [8-35] 0 18 [8-35] -0.022 95.5% 0.02 1 1 (1-1)
Respiratory rate (rpm) 34 [11-56] 0 34 [11-56] 0.008 94% 0.53 1 1 (1-1) Expiratory tidal volume (ml) 25 [5.50-600] 0 25 [5.50-600] -0.015 97% 0.07 1 1 (1-1)
Minute ventilation (L/min) 1 [0.4-7] 0 1 [0.4-7] 0 100% NA 1 1 (1-1)
Infusion pumps
Rate of infusion (ml/h) 1.3 [0-100] 23 (9%) 1.3 [0-100] 0 100% NA 1 1 (1-1)
50 Supplemental Digital Content I: Correlation and Bland and Altman analysis for monitors’ data.
a. Pulse oximetry. b. Respiratory rate. c. End tidal CO2. d. Systolic arterial pressure. e. Mean arterial pressure. f. Diastolic arterial pressure
51
3.2 Ventilators’ data validity
Statistical analysis showed excellent overall correlation, agreement and reliability (Table 2, Supplemental Digital Content 2). A small, but statistically significant difference was found for the positive inspiratory pressure (mean difference of -0.022 cmH2O, p-value 0.02). This difference was observed only for a minority of the data (95.5% of all values were equal). Agreement remained over 90% with excellent correlation between reference and experimental data. ICCs were considered as excellent for all the tested variables (Table 2). Bland-Altman analysis showed excellent accuracy and precision (Supplemental Digital Content 2). No data were missing (table 2).
a. Infusion pumps data validity
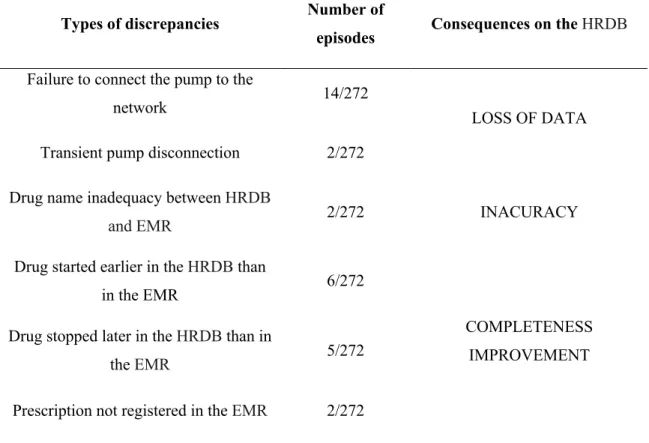
The comparison with the data displayed on the infusion pumps showed excellent correlation, agreement and reliability (Table 2) with Bland-Altman analysis showing excellent accuracy and precision between recorded and collected data for all the tested variables (Supplemental Digital Content 2). ICCs were considered as excellent for all the tested variables (Table 2). Twenty-three infusions (9 %) were not retrieved in the HRDB (Table 2). Nine episodes were related to six patients without any pharmacological data collected in the HRDB and 14 episodes were related to pump dysfunction. Other minor discrepancies were noticed between HRDB and EMR (Table 3). Correlation between HRDB and EMR regarding drugs of interests over the study period were depicted in figure 4.
b. Timestamps
A delay was observed between time synchronized videotapes and collected data from the monitors and the ventilators. This delay was less than 28 seconds and remained stable among patients. Besides, regarding infusion pumps data, we discovered that the data were not collected in the HRDB every 30 seconds as expected, but at different time
52 intervals between 10 and 40 seconds or when a modification was done. No delays were observed between the source and the HRDB.
Table III: Descriptive summary of discrepancies between the database and the electronic medical record
Types of discrepancies Number of
episodes Consequences on the HRDB
Failure to connect the pump to the
network 14/272
LOSS OF DATA
Transient pump disconnection 2/272
Drug name inadequacy between HRDB
and EMR 2/272 INACURACY
Drug started earlier in the HRDB than
in the EMR 6/272
COMPLETENESS IMPROVEMENT Drug stopped later in the HRDB than in
the EMR 5/272
53 Figure IV: Correlation between EMR and HRDB
54 Supplemental Digital Content II Correlation and Bland and Altman analysis for ventilators’ data and for infusion pumps’ data.
55 6. DISCUSSION
Whether in day-to-day clinical care decision-making or in medical research, the need to evaluate data quality is essential to ensure the reliability of DB 9,21,28,29. To our knowledge, this is the first study to validate PICU data contained in a specific HRDB 20,30. This article is indissociable from our two previously reports 8,11. The first report described the gathering process of our HRDB 8 and the second gave a comprehensive description of the HRDB’s architecture and process 11, these articles constitute the quality assurance of the HRDB 14,31. This third article completes this set. It contributes to the quality assurance phase and to the quality control phase of the HRDB 14,31.
As there were no guidelines specifically designed to guarantee high-resolution data quality 9,14, we elaborated the first complete validation procedure. Our validation procedure was inspired by previously published experiences 9,10,30,32–34 and guidelines 13–15,28,35 regarding data quality assessment in the field of medical DB collected at a lower rate or in a restricted area. To evaluate the quality of the data, we chose to perform an external validation procedure. We compared our extracted results with the information displayed on the monitor or the biomedical device 21. Our study showed an excellent overall accuracy, completeness and reliability of our HRDB when compared to displayed data at the bedside at the same time.
Regarding the accuracy of the dataset, we noticed only one clinically significant different heart rate value. This error was due to a rapid acceleration of the heart rate (Figure 2). In the video, the heart rate increase from 118 beats/minute to 154 beats/minute and the HRDB recorded one single value at 135 beats/minute during the transition. This suggests that monitors processed those data and only refreshed the display at a specific interval (probably between one and two seconds) and did not show intermediate data. Then, the HRDB recorded an intermediate value, which explains the importance of the difference between the reference value and the experimental value. Differences between the HRDB’s data and the reference data were observed regarding PIP. Even though they were statistically significant, disagreements were not clinically significant (the maximal difference was 0.5 cmH20 and concerned only 4.5% of all the collected PIP, the remaining 95.5% values were strictly equal) as shown by a mean difference of -0.022 cmH2O. Only integers are displayed