HAL Id: hal-00330914
https://hal.archives-ouvertes.fr/hal-00330914
Submitted on 22 Aug 2006
HAL is a multi-disciplinary open access
archive for the deposit and dissemination of
sci-entific research documents, whether they are
pub-lished or not. The documents may come from
teaching and research institutions in France or
abroad, or from public or private research centers.
L’archive ouverte pluridisciplinaire HAL, est
destinée au dépôt et à la diffusion de documents
scientifiques de niveau recherche, publiés ou non,
émanant des établissements d’enseignement et de
recherche français ou étrangers, des laboratoires
publics ou privés.
Distributed under a Creative Commons Attribution| 4.0 International License
On variations of foF2 and F-spread before strong
earthquakes in Japan
E. V. Liperovskaya, Michel Parrot, V. V. Bogdanov, C.-V. Meister, M. V.
Rodkin, V. A. Liperovsky
To cite this version:
E. V. Liperovskaya, Michel Parrot, V. V. Bogdanov, C.-V. Meister, M. V. Rodkin, et al.. On variations
of foF2 and F-spread before strong earthquakes in Japan. Natural Hazards and Earth System
Sci-ence, Copernicus Publications on behalf of the European Geosciences Union, 2006, 6 (5), pp.735-739.
�10.5194/nhess-6-735-2006�. �hal-00330914�
Nat. Hazards Earth Syst. Sci., 6, 735–739, 2006 www.nat-hazards-earth-syst-sci.net/6/735/2006/ © Author(s) 2006. This work is licensed under a Creative Commons License.
Natural Hazards
and Earth
System Sciences
On variations of f oF2 and F-spread before strong earthquakes in
Japan
E. V. Liperovskaya1, M. Parrot2, V. V. Bogdanov3, C.-V. Meister4, M. V. Rodkin5, and V. A. Liperovsky1 1Institute for Physics of the Earth, 123995 Moscow, Russia
2L.P.C.E./C.N.R.S., 3A, Avenue de la Recherche Scientifique, 45071 Orl´eans Cedex 2, France
3Inst. of Cosmophysical Research and Radio Wave Propagation, Far Eastern Branch of RAS, 684034 P-Kamchatsky, Russia 4High School and Science Programme Brandenburg/Potsdam, Project “Physics of Stellar and Planetary Atmospheres”, 14482 Potsdam, Germany
5World Geophysical Data Center, Molodejnaya 3, 117296 Moscow, Russia
Received: 9 June 2006 – Revised: 14 August 2006 – Accepted: 14 August 2006 – Published: 22 August 2006
Abstract. The statistical analysis of the variations of the
dayly-mean frequency of the maximum ionospheric electron density f oF2 is performed in connection with the occurrence of (more than 60) earthquakes with magnitudes M>6.0, depths h<80 km and distances from the vertical sounding station R<1000 km. For the study, data of the Tokyo sound-ing station are used, which were registered every hour in the years 1957–1990. It is shown that, on the average, f oF2 de-creases before the earthquakes. One day before the shock the decrease amounts to about 5%. The statistical reliability of this phenomenon is obtained to be better than 0.95.
Further, the variations of the occurrence probability of the turbulization of the F-layer (F spread) are investigated for (more than 260) earthquakes with M>5.5, h<80 km,
R<1000 km. For the analysis, data of the Japanese station Akita from 1969–1990 are used, which were obtained every hour. It is found that before the earthquakes the occurrence probability of F spread decreases. In the week before the event, the decrease has values of more than 10%. The statis-tical reliability of this phenomenon is also larger than 0.95. Examining the seismo-ionospheric effects, here periods of time with weak heliogeomagnetic disturbances are consid-ered. For the f oF2 analysis, the Wolf number is less than 100 and the index 6Kpis smaller than 30, and in case of the F-spread study a Wolf number less than 80 and 6Kpsmaller than 17 are chosen.
Correspondence to: C.-V. Meister
1 Introduction
In a series of works, the behaviour of characteristic parame-ters of the ionosphere during earthquake preparation times has been studied. In this connection, the critical f oF2-frequency – one of the parameters normally measured by ver-tical sounding – is often chosen. This frequency is the plasma frequency at the ionospheric F2-peak. Analyses of modifi-cations of mean values of f oF2 to prove if they might be precursors of sufficiently strong earthquakes were performed in a number of works. A decrease of the critical frequency
f oF2 before a few earthquakes was demonstrated by Hobara and Perrot (2005), Liperovsky et al. (1992), Ondoh (2000), Rios et al. (2004), Sing et al. (2004). On the other side, Pu-linets and Boyarchuk (2004) noticed an increase of f oF2 be-fore an extremely strong earthquake. A statistical investi-gation of the f oF2-decrease in the afternoon before Taiwan earthquakes was performed by Liu et al. (2006). These in-vestigations were carried out for earthquakes with different ranges of magnitudes.
The aim of the present work is to prove the f oF2-decrease statistically for Japanese earthquakes and to determine which are the magnitudes of the earthquakes yet connected with an observable modification of the mean f oF2 frequency before a shock. Further, the pre-seismic mean temporal change of the turbulization of the F-layer, the F-spread, is studied.
736 E. V. Liperovskaya et al.: f oF2 and F-spread variations before strong earthquakes in Japan
2
E. V. Liperovskaya et al.: foF2 and F-spread variations before strong earthquakes in Japan
Fig. 1. Result of the superposition of epoches for earthquakes with
epicenters below sea. 12 events with M > 6.5, R < 1000 km and h < 80km are analyzed.
In the present work, dayly-mean values hfoF2i of foF2 are
analysed. For any earthquake, a time interval from 10 days
before the event up to 5 days after the event is taken into
ac-count. If a few earthquakes happened on one day, the day
is treated as a day with one event. Further, earthquakes are
excluded from the statistics, if the number of “quiet” days of
the total time interval of 16 days was less than 8 days (less
than half of the whole time interval). Then, the value hfoF2i
of every of the 16 days is normalized by the mean value of the
whole time interval of 16 days. Thus, for any earthquake i
a series of undimensional numbers F
i=hfoF2i
i/ hfoF2i
totalis calculated for all the considered 16 days separately.
Fur-ther, the method of superposed epoches for earthquakes of
each group of events is applied, i.e. the normalized values F
iare averaged over the whole set of earthquakes for each day.
As result a time-dependend function F (t) is found, which is
presented in corresponding figures.
3 Decrease of foF2 for earthquakes with epicenters
be-low sea
Twelfe events with magnitudes M > 6.5 occurred in the
years 1957-1990, two of them even at the same day. In Fig.
1, F (t) for earthquakes with M > 6.5, h < 80 km and R <
1000
km are considered. Indeed, the dayly-mean values of
foF2 statistically decrease. This phenomenon starts one week
before the event, and the minimum occurs on the day of the
earthquake. This result is in agreement with the findings of
the works by Sing et al. (2004) and Hobara and Parrot (2005).
An analogeous result, we find for somewhat weaker marine
earthquakes with 6.0 < M < 6.5 (43 events, see Fig. 2).
On the other hand, for earthquakes with lesser magnitudes
6.0 > M > 5.5, R < 1000 km and h < 80 km (225 events)
no decrease of hfoF2i is found for the day of the shock.
Fig. 2. Result of the superposition of epoches for earthquakes with
epicenters below sea. 43 events with 6.5 > M > 6, R < 1000 km and h < 80 km are analyzed.
4 Decrease of foF2 for earthquakes with epicenters
be-low land
In Japan strong earthquakes with epicenters below land
hap-pen less frequently than below sea. During the considered
period of time 1957-1990 under “quiet” heliomagnetic and
geomagnetic conditions, only one event with M > 6.5 and
six events with 6.5 > M > 6.0 occurred. Fig. 3 shows the
result of the superposition of epoches for this 7 earthquakes.
Further, for less strong earthquakes with 6.0 > M > 5.5 (30
events), an analogeous decrease of hfoF2i towards the day of
the shock is not found. Summarizing the earthquakes with
epicenters below sea and below land, which meet the
condi-tion M > 6.0, into one group, one obtains a statistically
re-liable result: The dayly-mean values of foF2 decrease about
one week before the earthquake.
Now, one has to investigate if the obtained
seismo-ionospheric effect is casual or not. To answer this
ques-tion, one has to calculate the probability P
casualthat the
effect is casual. If this probability is small enough, e.g.
P
casual< 0.05, then the effect is not casual with probability
P = 1 − P
casual> 0.95. In such a case the effect may be
treated as a seismoionospheric one.
To evaluate P
casual, here a study of the variations of the
ionospheric parameter F is performed using a random
back-ground process model. The random backback-ground process is
constructed to check, if the variations of F
virtualfound with
the help of a set of “virtual events” (the number of “virtual”
events must be equal to the number of real events) is of less
amplitude than F (t) obtained for the real events. Therefore
k = 200
series of events are constructed, each consisting of
62 virtual earthquakes. In each series of events the days of
the earthquakes are chosen by a random number generator.
Thus, an F
virtualis found for each set of “virtual” events.
For every day, e.g. the day (-7) or the day (+2), F
virtualpos-sesses a Gaussian distribution. Thus it is possible to
deter-mine the standard deviation ˆ
F
virtualand the reliability σ for
Fig. 1. Result of the superposition of epoches for earthquakes with epicenters below sea. 12 events with M>6.5, R<1000 km and
h<80 km are analyzed.
2 Method of analysis of f oF2 frequency
In the present work earthquakes with depths of h<80 km and distances R to the sounding station smaller than 1000 km are divided into two groups, earthquakes with epicen-ters under the bottom of the sea (marine earthquakes) and with epicenters below land (land earthquakes). Each of these groups is again divided into three parts – events with mag-nitudes M>6.5, with 6.5≥M>6.0, and with 6.0≥M>5.5. The ionospheric data were obtained by the station Kokubunji (ϕ=35.7◦N, λ=139.5◦E, years 1957–1990, http://www.rl. ac.uk.wdcc1/data.html). Ionospheric effects of earthquakes are usually superposed by solar and geomagnetic distur-bances. Thus, only days with not too large solar and geo-magnetic disturbances are taken into account. What means “not too large” is interpreted differently by different investi-gators. Here only days with Wolf numbers less than 100 and
6Kp<30 are used in the study. Making such an assumption, more than half of the available experimental data are anal-ysed.
In the present work, dayly-mean values hf oF2i of f oF2 are analysed. For any earthquake, a time interval from 10 days before the event up to 5 days after the event is taken into account. If a few earthquakes happened on one day, the day is treated as a day with one event. Further, earthquakes are excluded from the statistics, if the number of “quiet” days of the total time interval of 16 days was less than 8 days (less than half of the whole time interval). Then, the value hf oF2i of every of the 16 days is normalized by the mean value of the whole time interval of 16 days. Thus, for any earthquake
ia series of undimensional numbers Fi=hf oF2ii/hf oF2itotal is calculated for all the considered 16 days separately. Fur-ther, the method of superposed epoches for earthquakes of
2
E. V. Liperovskaya et al.: foF2 and F-spread variations before strong earthquakes in Japan
Fig. 1. Result of the superposition of epoches for earthquakes with
epicenters below sea. 12 events with M > 6.5, R < 1000 km and h < 80km are analyzed.
In the present work, dayly-mean values hfoF2i of foF2 are
analysed. For any earthquake, a time interval from 10 days
before the event up to 5 days after the event is taken into
ac-count. If a few earthquakes happened on one day, the day
is treated as a day with one event. Further, earthquakes are
excluded from the statistics, if the number of “quiet” days of
the total time interval of 16 days was less than 8 days (less
than half of the whole time interval). Then, the value hfoF2i
of every of the 16 days is normalized by the mean value of the
whole time interval of 16 days. Thus, for any earthquake i
a series of undimensional numbers F
i=hfoF2i
i/ hfoF2i
totalis calculated for all the considered 16 days separately.
Fur-ther, the method of superposed epoches for earthquakes of
each group of events is applied, i.e. the normalized values F
iare averaged over the whole set of earthquakes for each day.
As result a time-dependend function F (t) is found, which is
presented in corresponding figures.
3 Decrease of foF2 for earthquakes with epicenters
be-low sea
Twelfe events with magnitudes M > 6.5 occurred in the
years 1957-1990, two of them even at the same day. In Fig.
1, F (t) for earthquakes with M > 6.5, h < 80 km and R <
1000
km are considered. Indeed, the dayly-mean values of
foF2 statistically decrease. This phenomenon starts one week
before the event, and the minimum occurs on the day of the
earthquake. This result is in agreement with the findings of
the works by Sing et al. (2004) and Hobara and Parrot (2005).
An analogeous result, we find for somewhat weaker marine
earthquakes with 6.0 < M < 6.5 (43 events, see Fig. 2).
On the other hand, for earthquakes with lesser magnitudes
6.0 > M > 5.5, R < 1000 km and h < 80 km (225 events)
no decrease of hfoF2i is found for the day of the shock.
Fig. 2. Result of the superposition of epoches for earthquakes with
epicenters below sea. 43 events with 6.5 > M > 6, R < 1000 km and h < 80 km are analyzed.
4 Decrease of foF2 for earthquakes with epicenters
be-low land
In Japan strong earthquakes with epicenters below land
hap-pen less frequently than below sea. During the considered
period of time 1957-1990 under “quiet” heliomagnetic and
geomagnetic conditions, only one event with M > 6.5 and
six events with 6.5 > M > 6.0 occurred. Fig. 3 shows the
result of the superposition of epoches for this 7 earthquakes.
Further, for less strong earthquakes with 6.0 > M > 5.5 (30
events), an analogeous decrease of hfoF2i towards the day of
the shock is not found. Summarizing the earthquakes with
epicenters below sea and below land, which meet the
condi-tion M > 6.0, into one group, one obtains a statistically
re-liable result: The dayly-mean values of foF2 decrease about
one week before the earthquake.
Now, one has to investigate if the obtained
seismo-ionospheric effect is casual or not. To answer this
ques-tion, one has to calculate the probability P
casualthat the
effect is casual. If this probability is small enough, e.g.
P
casual< 0.05, then the effect is not casual with probability
P = 1 − P
casual> 0.95. In such a case the effect may be
treated as a seismoionospheric one.
To evaluate P
casual, here a study of the variations of the
ionospheric parameter F is performed using a random
back-ground process model. The random backback-ground process is
constructed to check, if the variations of F
virtualfound with
the help of a set of “virtual events” (the number of “virtual”
events must be equal to the number of real events) is of less
amplitude than F (t) obtained for the real events. Therefore
k = 200
series of events are constructed, each consisting of
62 virtual earthquakes. In each series of events the days of
the earthquakes are chosen by a random number generator.
Thus, an F
virtualis found for each set of “virtual” events.
For every day, e.g. the day (-7) or the day (+2), F
virtualpos-sesses a Gaussian distribution. Thus it is possible to
deter-mine the standard deviation ˆ
F
virtualand the reliability σ for
Fig. 2. Result of the superposition of epoches for earthquakes with
epicenters below sea. 43 events with 6.5>M>6, R<1000 km and
h<80 km are analyzed.
each group of events is applied, i.e. the normalized values Fi are averaged over the whole set of earthquakes for each day. As result a time-dependend function F (t) is found, which is presented in corresponding figures.
3 Decrease of f oF2 for earthquakes with epicenters be-low sea
Twelfe events with magnitudes M>6.5 occurred in the years 1957–1990, two of them even at the same day. In Fig. 1, F (t ) for earthquakes with M>6.5, h<80 km and R<1000 km are considered. Indeed, the dayly-mean values of f oF2 statis-tically decrease. This phenomenon starts one week before the event, and the minimum occurs on the day of the earth-quake. This result is in agreement with the findings of the works by Sing et al. (2004) and Hobara and Parrot (2005). An analogeous result, we find for somewhat weaker ma-rine earthquakes with 6.0<M<6.5 (43 events, see Fig. 2). On the other hand, for earthquakes with lesser magnitudes 6.0>M>5.5, R<1000 km and h<80 km (225 events) no de-crease of hf oF2i is found for the day of the shock.
4 Decrease of f oF2 for earthquakes with epicenters be-low land
In Japan strong earthquakes with epicenters below land hap-pen less frequently than below sea. During the considered period of time 1957–1990 under “quiet” heliomagnetic and geomagnetic conditions, only one event with M>6.5 and six events with 6.5>M>6.0 occurred. Fig. 3 shows the result of the superposition of epoches for this 7 earthquakes. Further, for less strong earthquakes with 6.0>M>5.5 (30 events), an
E. V. Liperovskaya et al.: f oF2 and F-spread variations before strong earthquakes in Japan 737
E. V. Liperovskaya et al.: foF2 and F-spread variations before strong earthquakes in Japan
3
Fig. 3. Result of the superposition of epoches for earthquakes with
epicenters below land. 7 events with M > 6, R < 1000 km and h < 80km are analyzed.
every day for all k = 200 sets. The number 200 was
cho-sen for k as for such large k-values, ˆ
F
virtualand σ do not
depend on k and may be calculated with proper accuracy.
Then, for each day, F of the real earthquakes is compared
with the variations of ˆ
F
virtualusing ˆ
F
virtual± 2σ. In Fig.
4, ˆ
F
virtual(dashed line) and ˆ
F
virtual± 2σ
(dotted line) are
presented, and it is to be seen that F exceeds ±2σ on the
days (-1) and (0). Hence, the decrease of foF2 is not casual
with a probability P larger than 0.95.
5 Variability of the turbulization of the F-layer before
earthquakes
As characteristic parameter of the turbulization of the
F-layer, the F-spread phenomenon may be used. F-spread is
observed as diffusivity of the traces of the F-layer on
iono-grams. The most important characteristic of F-spread is its
occurrence probability which is studied here. The
occur-rence probability of F-spread equals the ratio of the
num-ber of F-spread observations to the numnum-ber of observations
of F2-layer tracks on the ionograms. Sometimes F-spread
is comparatively weak and the observers can determine an
exact value of foF2. At other times F-spread can be so
inten-sive that an foF2-value cannot be found. Using data obtained
every hour, one can calculate the occurrence probability of
F-spread for some time interval.
F-spread is mainly observed at night. As illustration, Fig.
5 shows the number of F-spread observations as function of
the local time for the years 1969-1990. Thus it is reasonable
to investigate F-spread only for nighttime. Data of the
sta-tion Akita (ϕ = 39.7
oN, λ = 140.1
oE.) are used, because
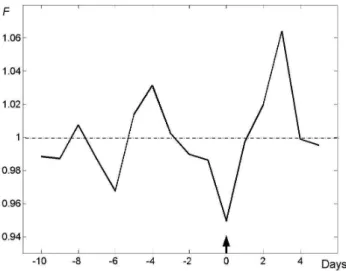
Fig. 4. Result of the superposition of epoches for earthquakes with
epicenters below sea and below land. 62 events with M > 6, R < 1000 km and h < 80 km are analyzed. Solid line - tem-poral behaviour of F . The dashed line gives the mean value of F and the dotted lines show the interval of reliability 2σ (2 standard deviations), which is calculated by random process modelling.
man-made activity is powerful around the station Kokubunji
(Tokio), and this may disturb the F-spread. Here the
occur-rence probability of F-spread is calculated for each night. For
the night a time interval from 23 LT until 5 LT is chosen.
Be-sides, only F-spread on days with comparatively weak solar
and geomagnetic disturbances is considered, but in this case
stronger conditions are chosen, there are taken Wolf numbers
< 80
and ΣK
p< 17. The chosen boundary values are
me-dian values for 1969-1988. More than 1/3 of the days of this
time interval are “quiet” ones.
The occurrence probability of F-spread is calculated for
each day (i) in the vicinity of each earthquake using time
intervals from the day (i-3) to the day (i+3). For these
7 days, the number of F-spread observations N
F −spreadand the number of F-layer observations N
F −layerare
de-termined, and the F-spread occurrence probability P =
N
F −spread/N
F −layerare calculated. Using the method of
superposition of epoches, the mean occurrence probability of
F-spread for the set of earthquakes with M > 5.5, R < 1000
km, h < 80 km is calculated. During the considered time
interval, 226 of such earthquakes are registered. For every
earthquake, a time interval from 30 days before the shock to
30 days after the event is taken into account. Fig. 6 shows
the mean occurrence probability P of F-spread for all 61
analysed days. Almost one week before the earthquakes, a
decrease of P is observed. The minimum of P is found in
the time interval between the days (-3) and (+1). The
de-crease of P amounts to more than 10 %. To prove this
re-sult statistically, again the method of modelling of random
processes, described above, is applied. Here, 200 series of
Fig. 3. Result of the superposition of epoches for earthquakes with epicenters below land. 7 events with M>6, R<1000 km and
h<80 km are analyzed.
analogeous decrease of hf oF2i towards the day of the shock is not found. Summarizing the earthquakes with epicenters below sea and below land, which meet the condition M>6.0, into one group, one obtains a statistically reliable result: The dayly-mean values of f oF2 decrease about one week before the earthquake.
Now, one has to investigate if the obtained seismo-ionospheric effect is casual or not. To answer this ques-tion, one has to calculate the probability Pcasual that the effect is casual. If this probability is small enough, e.g.
Pcasual<0.05, then the effect is not casual with probability P =1−Pcasual>0.95. In such a case the effect may be treated as a seismoionospheric one.
To evaluate Pcasual, here a study of the variations of the ionospheric parameter F is performed using a random back-ground process model. The random backback-ground process is constructed to check, if the variations of Fvirtualfound with the help of a set of “virtual events” (the number of “virtual” events must be equal to the number of real events) is of less amplitude than F (t) obtained for the real events. Therefore
k=200 series of events are constructed, each consisting of 62 virtual earthquakes. In each series of events the days of the earthquakes are chosen by a random number generator. Thus, an Fvirtualis found for each set of “virtual” events. For every day, e.g. the day (−7) or the day (+2), Fvirtualpossesses a Gaussian distribution. Thus it is possible to determine the standard deviation ˆFvirtualand the reliability σ for every day for all k=200 sets. The number 200 was chosen for k as for such large k-values, ˆFvirtual and σ do not depend on k and may be calculated with proper accuracy. Then, for each day,
F of the real earthquakes is compared with the variations of
ˆ
Fvirtualusing ˆFvirtual±2σ . In Fig. 4, ˆFvirtual(dashed line) and ˆ
Fvirtual±2σ (dotted line) are presented, and it is to be seen
E. V. Liperovskaya et al.: foF2 and F-spread variations before strong earthquakes in Japan 3
Fig. 3. Result of the superposition of epoches for earthquakes with
epicenters below land. 7 events with M > 6, R < 1000 km and h < 80km are analyzed.
every day for all k = 200 sets. The number 200 was cho-sen for k as for such large k-values, ˆFvirtual and σ do not
depend on k and may be calculated with proper accuracy. Then, for each day, F of the real earthquakes is compared with the variations of ˆFvirtual using ˆFvirtual± 2σ. In Fig.
4, ˆFvirtual (dashed line) and ˆFvirtual± 2σ(dotted line) are
presented, and it is to be seen that F exceeds ±2σ on the days (-1) and (0). Hence, the decrease of foF2 is not casual with a probability P larger than 0.95.
5 Variability of the turbulization of the F-layer before earthquakes
As characteristic parameter of the turbulization of the F-layer, the F-spread phenomenon may be used. F-spread is observed as diffusivity of the traces of the F-layer on iono-grams. The most important characteristic of F-spread is its occurrence probability which is studied here. The occur-rence probability of F-spread equals the ratio of the num-ber of F-spread observations to the numnum-ber of observations of F2-layer tracks on the ionograms. Sometimes F-spread is comparatively weak and the observers can determine an exact value of foF2. At other times F-spread can be so inten-sive that an foF2-value cannot be found. Using data obtained every hour, one can calculate the occurrence probability of F-spread for some time interval.
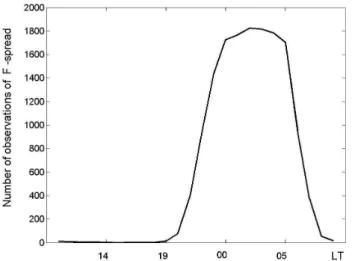
F-spread is mainly observed at night. As illustration, Fig. 5 shows the number of F-spread observations as function of the local time for the years 1969-1990. Thus it is reasonable to investigate F-spread only for nighttime. Data of the sta-tion Akita (ϕ = 39.7o N, λ = 140.1oE.) are used, because
Fig. 4. Result of the superposition of epoches for earthquakes with
epicenters below sea and below land. 62 events with M > 6, R < 1000km and h < 80 km are analyzed. Solid line - tem-poral behaviour of F . The dashed line gives the mean value of F and the dotted lines show the interval of reliability 2σ (2 standard deviations), which is calculated by random process modelling.
man-made activity is powerful around the station Kokubunji (Tokio), and this may disturb the F-spread. Here the occur-rence probability of F-spread is calculated for each night. For the night a time interval from 23 LT until 5 LT is chosen. Be-sides, only F-spread on days with comparatively weak solar and geomagnetic disturbances is considered, but in this case stronger conditions are chosen, there are taken Wolf numbers < 80and ΣKp < 17. The chosen boundary values are
me-dian values for 1969-1988. More than 1/3 of the days of this time interval are “quiet” ones.
The occurrence probability of F-spread is calculated for each day (i) in the vicinity of each earthquake using time intervals from the day (i-3) to the day (i+3). For these 7 days, the number of F-spread observations NF −spread
and the number of F-layer observations NF −layer are
de-termined, and the F-spread occurrence probability P = NF −spread/NF −layer are calculated. Using the method of
superposition of epoches, the mean occurrence probability of F-spread for the set of earthquakes with M > 5.5, R < 1000 km, h < 80 km is calculated. During the considered time interval, 226 of such earthquakes are registered. For every earthquake, a time interval from 30 days before the shock to 30 days after the event is taken into account. Fig. 6 shows the mean occurrence probability P of F-spread for all 61 analysed days. Almost one week before the earthquakes, a decrease of P is observed. The minimum of P is found in the time interval between the days (-3) and (+1). The de-crease of P amounts to more than 10 %. To prove this re-sult statistically, again the method of modelling of random processes, described above, is applied. Here, 200 series of Fig. 4. Result of the superposition of epoches for earthquakes with epicenters below sea and below land. 62 events with M>6,
R<1000 km and h<80 km are analyzed. Solid line – temporal be-haviour of F . The dashed line gives the mean value of F and the dotted lines show the interval of reliability 2σ (2 standard devia-tions), which is calculated by random process modelling.
that F exceeds ±2σ on the days (−1) and (0). Hence, the decrease of f oF2 is not casual with a probability P larger than 0.95.
5 Variability of the turbulization of the F-layer before earthquakes
As characteristic parameter of the turbulization of the F-layer, the F-spread phenomenon may be used. F-spread is observed as diffusivity of the traces of the F-layer on iono-grams. The most important characteristic of F-spread is its occurrence probability which is studied here. The occur-rence probability of F-spread equals the ratio of the num-ber of F-spread observations to the numnum-ber of observations of F2-layer tracks on the ionograms. Sometimes F-spread is comparatively weak and the observers can determine an exact value of f oF2. At other times F-spread can be so in-tensive that an f oF2-value cannot be found. Using data ob-tained every hour, one can calculate the occurrence probabil-ity of F-spread for some time interval.
F-spread is mainly observed at night. As illustration, Fig. 5 shows the number of F-spread observations as function of the local time for the years 1969–1990. Thus it is reason-able to investigate F-spread only for nighttime. Data of the station Akita (ϕ=39.7◦N, λ=140.1◦E.) are used, because man-made activity is powerful around the station Kokubunji (Tokio), and this may disturb the F-spread. Here the occur-rence probability of F-spread is calculated for each night. For the night a time interval from 23:00 LT until 05:00 LT is chosen. Besides, only F-spread on days with comparatively weak solar and geomagnetic disturbances is considered, but
738 E. V. Liperovskaya et al.: f oF2 and F-spread variations before strong earthquakes in Japan
4 E. V. Liperovskaya et al.: foF2 and F-spread variations before strong earthquakes in Japan
Fig. 5. Number of F-spread observations in the years 1969-1990 as
function of the local time.
events are constructed, each consisting of 226 virtual days of earthquakes. Then, the mean value Pvirtualand the
stan-dard deviation σ of the 200 virtual sets are calculated. The interval of reliability 2σ is also presented in Fig. 6. It is to be seen that P exceeds the (±2σ) interval and hence the sta-tistical reliability of the decrease of the F-spread observation probability is larger than 0.95.
6 Conclusions
In the present work, ionospheric effects connected to 62 strong earthquakes with M > 6.0, which took place in Japane, are analysed. The epicenters of the earthquakes were situated below sea and below land. It is shown that about 7-5 days before the events, the dayly-mean values of foF2 decrease. The relative minimum of the foF2 value occurs on the day of the earthquake.
The observed decrease of the foF2 values seems to be a consequence of a specific heating of the ionosphere by spe-cific currents, which are excited by earthquake preparation processes during their last phase.
Further, foF2-variations of more than 260 less strong earthquakes with 6.0 > M > 5.5 are studied. For these events no decrease of the dayly mean foF2 values during the earthquake preparation phase is obtained. This is valid for earthquakes with epicenters below sea and below land sepa-rately.
On the other hand, for the weaker earthquakes with M > 5.5, R < 1000 km, a decrease of the turbulization of the ionospheric F-layer (that means of F-spread) is found a week before the shock. This effect has a maximum in the immi-nence of the day of the shock.
Fig. 6. Mean occurrence probability of F-spread P (thick solid line)
during the time interval from 30 days before the earthquake until 30 days after the event. The dashed line gives the mean value of the occurrence probability calculated using the random process mod-elling. The dotted lines show the interval of reliability 2σ (2 stan-dard deviations) found by random process modelling. Earthquakes with M > 5.5, R < 1000 km, h < 80 km are considered.
The statistical reliability of both investigated seismo-ionospheric phenomena, the decrease of the foF2 values and the decrease of the F-layer turbulization is larger than 0.95.
Thus, considering earthquake precursors, it is more reli-able to analyse the turbulization of the F-layer, because the turbulization of the F-layer may be registered already for rather weak earthquakes.
Acknowledgements. The authors kindly thank the anonymous ref-eree of the paper for valuable discussions and remarks.
References
Hobara Y. and Parrot M.: Ionospheric perturbations linked to a very powerful seismic event, J. Atmos. Terr. Phys., 67, 677-685, 2005. Liperovsky V.A., Pokhotelov O.A., and Shalimov S.L., Ionospheric
precursors of earthquakes, Nauka, Moscow, 1992.
Liu J.Y., Chen Y.I., Chuo Y.J., and Chen C.S.: A statistical investi-gation of preearthquake ionospheric anomaly, J. Geophys. Res., 111, A05304, doi:10.1029/2006.
Ondoh T.: Seismo-ionospheric phenomena, Adv. Space Res., 26 (8), 1267-1272, 2000.
Pulinets S.A. and Boyarchuk K.A.: Ionospheric precursors of earth-quakes, Springer, Berlin, 2004.
Rios V.H., Kim V.P., and Hegai V.V.: Abnormal perturbations in the F2 region ionosphere observed prior to the great San Juan earthquake of 23 November 1977, Adv. Space res., 33, 323-327, 2004.
Singh B., Kushwah V., Singh O.P., Lakshmi D.R., and Reddy B.M.: Ionospheric perturbations caused by some major earthquakes in India, Physics and Chemistry of the Earth, 29, 537-550, 2004.
Fig. 5. Number of F-spread observations in the years 1969-1990 as
function of the local time.
in this case stronger conditions are chosen, there are taken Wolf numbers <80 and 6Kp<17. The chosen boundary val-ues are median valval-ues for 1969–1988. More than 1/3 of the days of this time interval are “quiet” ones.
The occurrence probability of F-spread is calculated for each day (i) in the vicinity of each earthquake using time in-tervals from the day (i−3) to the day (i+3). For these 7 days, the number of F-spread observations NF −spreadand the num-ber of F-layer observations NF −layerare determined, and the F-spread occurrence probability P =NF −spread/NF −layerare calculated. Using the method of superposition of epoches, the mean occurrence probability of F-spread for the set of earthquakes with M>5.5, R<1000 km, h<80 km is calcu-lated. During the considered time interval, 226 of such earth-quakes are registered. For every earthquake, a time inter-val from 30 days before the shock to 30 days after the event is taken into account. Figure 6 shows the mean occurrence probability P of F-spread for all 61 analysed days. Almost one week before the earthquakes, a decrease of P is ob-served. The minimum of P is found in the time interval be-tween the days (−3) and (+1). The decrease of P amounts to more than 10%. To prove this result statistically, again the method of modelling of random processes, described above, is applied. Here, 200 series of events are constructed, each consisting of 226 virtual days of earthquakes. Then, the mean value Pvirtualand the standard deviation σ of the 200 virtual sets are calculated. The interval of reliability 2σ is also presented in Fig. 6. It is to be seen that P exceeds the
(±2σ ) interval and hence the statistical reliability of the de-crease of the F-spread observation probability is larger than 0.95.
4
E. V. Liperovskaya et al.: foF2 and F-spread variations before strong earthquakes in Japan
Fig. 5. Number of F-spread observations in the years 1969-1990 as
function of the local time.
events are constructed, each consisting of 226 virtual days
of earthquakes. Then, the mean value P
virtualand the
stan-dard deviation σ of the 200 virtual sets are calculated. The
interval of reliability 2σ is also presented in Fig. 6. It is to
be seen that P exceeds the (±2σ) interval and hence the
sta-tistical reliability of the decrease of the F-spread observation
probability is larger than 0.95.
6 Conclusions
In the present work, ionospheric effects connected to 62
strong earthquakes with M > 6.0, which took place in
Japane, are analysed. The epicenters of the earthquakes were
situated below sea and below land. It is shown that about
7-5 days before the events, the dayly-mean values of foF2
decrease. The relative minimum of the foF2 value occurs on
the day of the earthquake.
The observed decrease of the foF2 values seems to be a
consequence of a specific heating of the ionosphere by
spe-cific currents, which are excited by earthquake preparation
processes during their last phase.
Further, foF2-variations of more than 260 less strong
earthquakes with 6.0 > M > 5.5 are studied. For these
events no decrease of the dayly mean foF2 values during the
earthquake preparation phase is obtained. This is valid for
earthquakes with epicenters below sea and below land
sepa-rately.
On the other hand, for the weaker earthquakes with M >
5.5, R < 1000 km, a decrease of the turbulization of the
ionospheric F-layer (that means of F-spread) is found a week
before the shock. This effect has a maximum in the
immi-nence of the day of the shock.
Fig. 6. Mean occurrence probability of F-spread P (thick solid line)
during the time interval from 30 days before the earthquake until 30 days after the event. The dashed line gives the mean value of the occurrence probability calculated using the random process mod-elling. The dotted lines show the interval of reliability 2σ (2 stan-dard deviations) found by random process modelling. Earthquakes with M > 5.5, R < 1000 km, h < 80 km are considered.
The statistical reliability of both investigated
seismo-ionospheric phenomena, the decrease of the foF2 values and
the decrease of the F-layer turbulization is larger than 0.95.
Thus, considering earthquake precursors, it is more
reli-able to analyse the turbulization of the F-layer, because the
turbulization of the F-layer may be registered already for
rather weak earthquakes.
Acknowledgements. The authors kindly thank the anonymous ref-eree of the paper for valuable discussions and remarks.
References
Hobara Y. and Parrot M.: Ionospheric perturbations linked to a very powerful seismic event, J. Atmos. Terr. Phys., 67, 677-685, 2005. Liperovsky V.A., Pokhotelov O.A., and Shalimov S.L., Ionospheric
precursors of earthquakes, Nauka, Moscow, 1992.
Liu J.Y., Chen Y.I., Chuo Y.J., and Chen C.S.: A statistical investi-gation of preearthquake ionospheric anomaly, J. Geophys. Res., 111, A05304, doi:10.1029/2006.
Ondoh T.: Seismo-ionospheric phenomena, Adv. Space Res., 26 (8), 1267-1272, 2000.
Pulinets S.A. and Boyarchuk K.A.: Ionospheric precursors of earth-quakes, Springer, Berlin, 2004.
Rios V.H., Kim V.P., and Hegai V.V.: Abnormal perturbations in the F2 region ionosphere observed prior to the great San Juan earthquake of 23 November 1977, Adv. Space res., 33, 323-327, 2004.
Singh B., Kushwah V., Singh O.P., Lakshmi D.R., and Reddy B.M.: Ionospheric perturbations caused by some major earthquakes in India, Physics and Chemistry of the Earth, 29, 537-550, 2004.
Fig. 6. Mean occurrence probability of F-spread P (thick solid line)
during the time interval from 30 days before the earthquake until 30 days after the event. The dashed line gives the mean value of the occurrence probability calculated using the random process mod-elling. The dotted lines show the interval of reliability 2σ (2 stan-dard deviations) found by random process modelling. Earthquakes with M>5.5, R<1000 km, h<80 km are considered.
6 Conclusions
In the present work, ionospheric effects connected to 62 strong earthquakes with M>6.0, which took place in Japane, are analysed. The epicenters of the earthquakes were situated below sea and below land. It is shown that about 7–5 days before the events, the dayly-mean values of f oF2 decrease. The relative minimum of the f oF2 value occurs on the day of the earthquake.
The observed decrease of the f oF2 values seems to be a consequence of a specific heating of the ionosphere by spe-cific currents, which are excited by earthquake preparation processes during their last phase.
Further, f oF2-variations of more than 260 less strong earthquakes with 6.0>M>5.5 are studied. For these events no decrease of the dayly mean f oF2 values during the quake preparation phase is obtained. This is valid for earth-quakes with epicenters below sea and below land separately. On the other hand, for the weaker earthquakes with
M>5.5, R<1000 km, a decrease of the turbulization of the ionospheric F-layer (that means of F-spread) is found a week before the shock. This effect has a maximum in the immi-nence of the day of the shock.
The statistical reliability of both investigated seismo-ionospheric phenomena, the decrease of the f oF2 values and the decrease of the F-layer turbulization is larger than 0.95.
Thus, considering earthquake precursors, it is more reli-able to analyse the turbulization of the F-layer, because the turbulization of the F-layer may be registered already for rather weak earthquakes.
E. V. Liperovskaya et al.: f oF2 and F-spread variations before strong earthquakes in Japan 739
Acknowledgements. The authors kindly thank the anonymous
referee of the paper for valuable discussions and remarks. Edited by: P. F. Biagi
Reviewed by: one referee
References
Hobara, Y. and Parrot, M.: Ionospheric perturbations linked to a very powerful seismic event, J. Atmos. Terr. Phys., 67, 677–685, 2005.
Liperovsky, V. A., Pokhotelov, O. A., and Shalimov, S. L.: Iono-spheric precursors of earthquakes, Nauka, Moscow, 1992.
Liu, J. Y., Chen, Y. I., Chuo, Y. J., and Chen, C. S.: A statistical investigation of preearthquake ionospheric anomaly, J. Geophys. Res., 111, A05304, doi:10.1029/2005JA011333, 2006.
Ondoh, T.: Seismo-ionospheric phenomena, Adv. Space Res., 26(8), 1267–1272, 2000.
Pulinets, S. A. and Boyarchuk, K. A.: Ionospheric precursors of earthquakes, Springer, Berlin, 2004.
Rios, V. H., Kim, V. P., and Hegai, V. V.: Abnormal perturbations in the F2 region ionosphere observed prior to the great San Juan earthquake of 23 November 1977, Adv. Space Res., 33, 323–327, 2004.
Singh, B., Kushwah, V., Singh, O. P., Lakshmi, D. R., and Reddy, B. M.: Ionospheric perturbations caused by some major earth-quakes in India, Phys. Chem. Earth, 29, 537–550, 2004.