HAL Id: hal-00298998
https://hal.archives-ouvertes.fr/hal-00298998
Submitted on 1 Jan 2001
HAL is a multi-disciplinary open access
archive for the deposit and dissemination of
sci-entific research documents, whether they are
pub-lished or not. The documents may come from
teaching and research institutions in France or
abroad, or from public or private research centers.
L’archive ouverte pluridisciplinaire HAL, est
destinée au dépôt et à la diffusion de documents
scientifiques de niveau recherche, publiés ou non,
émanant des établissements d’enseignement et de
recherche français ou étrangers, des laboratoires
publics ou privés.
Investigation of over-horizon VHF radio signals
associated with earthquakes
Y. Fukumoto, M. Hayakawa, H. Yasuda
To cite this version:
Y. Fukumoto, M. Hayakawa, H. Yasuda. Investigation of over-horizon VHF radio signals associated
with earthquakes. Natural Hazards and Earth System Science, Copernicus Publications on behalf of
the European Geosciences Union, 2001, 1 (3), pp.107-112. �hal-00298998�
c
European Geophysical Society 2001
Natural Hazards
and Earth
System Sciences
Investigation of over-horizon VHF radio signals associated with
earthquakes
Y. Fukumoto1, M. Hayakawa1, and H. Yasuda2
1Dept. of Electronic Engineering, University of Electro-Communications, 1-5-1 Chofugaoka, Chofu Tokyo 182-8585, Japan 2Taiyo Musen Co., Ltd., Ebisu-nishi 2-20-7, Shibuya, Tokyo, Japan
Received: 7 May 2001 – Revised: 1 November 2001 – Accepted: 3 December 2001
Abstract. This paper presents the preliminary results on the
possible reception of over-horizon VHF radio signals from a FM (frequency modulation) transmitter during abnormal sit-uations (probably in close association with earthquakes). The transmitter is FM Sendai (frequency = 77.1 MHz) and the re-ceiving station is our university (UEC) at Chofu, Tokyo, with the transmitter-receiver distance being about 310 km. We first show a typical example of the reception of over-horizon VHF signals in which we present the amplitude behavior, az-imuthal and incident angle estimation, etc. Then, we study the correlation between a signal anomaly and an earthquake and it seems that the over-horizon VHF signals observed are probably associated with earthquakes, observed about 7 to 0 days before an earthquake. The direction finding measure-ments have indicated that such signals are due to favorable tropospheric (but not ionospheric) conditions attributed to the effects of earthquakes.
1 Introduction
Electromagnetic phenomena have been recently considered to be very promising for short-term earthquake prediction (Hayakawa and Fujinawa, 1994; Hayakawa, 1999). One of the electromagnetic soundings is the use of pre-existing transmitter signals in different frequency ranges to inves-tigate the seismo-atmospheric and seismo-ionospheric phe-nomena. Very convincing results relating to the seismo-ionospheric perturbations in the VLF and LF bands have al-ready been reported (Gokhberg et al., 1989; Hayakawa et al., 1996; Molchanov and Hayakawa, 1998). This has led to an important scientific study of the lithosphere-atmosphere-ionosphere coupling. Biagi (1999) has also investigated the seismo-atmospheric effect in the sub-ionospheric LF (150– 300 kHz) wave propagation.
Correspondence to: M. Hayakawa
(hayakawa@aurora.ee.uec.ac.jp)
In the VHF frequency range, Kushida and Kushida (1998) have been working on the reception of over-horizon VHF transmitter signals (FM (frequency modulation) radio sig-nals). They consider these signals to be associated with earthquakes and such receptions of the over-horizon VHF signals are due to the scattering by ionospheric perturbations caused by an earthquake. However, the mechanism is poorly understood. Due to this, we present our recent preliminary results in order to answer the fundamental questions regard-ing VHF radio soundregard-ing; (1) Can we actually receive an over-horizon VHF transmitter signal before an earthquake? and (2) What is the mechanism of reception for over-horizon VHF radio signals associated with earthquakes?
2 Observation, receiving and antenna systems
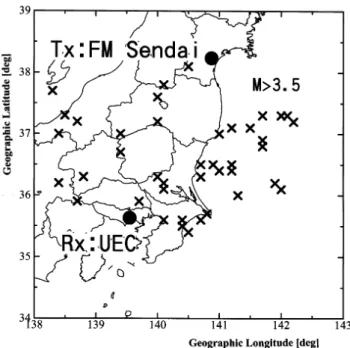
Figure 1 illustrates the relative location of the FM transmit-ter in Sendai (frequency = 77.1 MHz, power = 5 kW, height = 193 m, and horizontal polarization) (named FM Sendai) and the receiver at our university (UEC) (antenna height = 33.8 m). The distance between the transmitter and receiver is 312 km and the line of sight is 80 km. Crosses in the fig-ure indicate the epicenters of earthquakes with magnitudes greater than 3.5 during the period of our observation, which was five months, from 1 February to 30 June 2000. During this period midnight (00:00–05:30 LT), data could be used because during other time periods, the radio broadcasting (University of the Air) was transmitting on this same fre-quency in the Tokyo area.
The FM signal for one antenna system was received by a corresponding observing system, and was fed to a tuned HF amplifier. Then, the signal was frequency-translated to IF (intermediate frequency, 10.7 MHz) by means of a local oscillator. Afterwards, a part of the signal was rectified by a DAQ (data acquisition) board with a sampling rate of 10 s and analyzed by a PC (Fig. 2 is an example). Another part of the signal was fed to an IF amplifier and a detector, and the lower frequency component (demodulated signal) was
108 Y. Fukumoto et al.: Investigation of over-horizon VHF radio signals
Fig. 1. Relative location of the FM transmitter in Sendai (FM
Sendai) and the receiving station (our university), together with the locations of earthquake epicenters with magnitudes greater than 3.5 which occurred during the period of February through June 2000.
recorded on a video tape recorder to verify that the received signal was actually due to FM Sendai.
Next, we describe the antenna systems. Six Yagi antenna systems are used (each Yagi has 5 elements) and the receiv-ing system for one antenna system is described above. As for the reception of a horizontally polarized signal, we have three different antenna systems with different bearing (az-imuthal) angles of −30◦, 0◦, +30◦(0◦means the direction between the receiver and transmitter; − (minus sign) indi-cates the west of the path and + (plus sign) the east of the path) for the fixed elevation angle of 0◦(horizontal). Addi-tionally, we have three other antenna systems with three dif-ferent elevation angles (0◦, 45◦, and 90◦(vertical upward))
for the fixed azimuth of 0◦for the same horizontal
polariza-tion. We have one final antenna system to detect the signal with vertical polarization (bearing = 0◦, elevation = 0◦). By using the outputs from the two antennas directed in two az-imuths (S(+) and S(−)) (bearing +30◦ and −30◦, respec-tively) for the fixed elevation angle of 0◦, we could estimate the azimuth of the observed signal by using the relationship of 2 (deg) = (180◦/π )tan−1(S(+)/S(−))−45◦ and also the absolute amplitude (because the system is well calibrated).
3 Observed results and correlation analysis
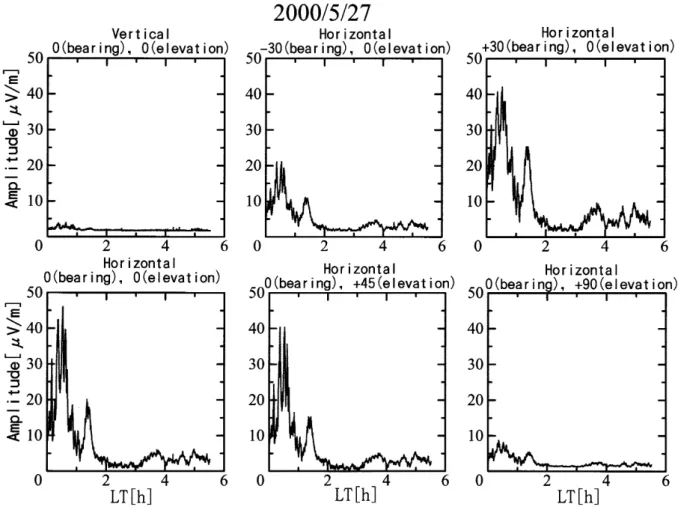
On the normal days without any earthquake effects, we ob-serve the background levels for all six antenna channels. However, when a certain effect (probably the effect of an earthquake) happens, we have various records based on pre-vious observations, such as the one on 27 May 2000 as shown
in Fig. 2. This was a typical example of the rectified IF out-put. Looking at the three panels (the two at the top right and one at the bottom left) directed at three different bearings (but with the same horizontal polarization and the same elevation angle of 0◦), the most significant output was seen for the az-imuth +30◦ (east of the path). By using the outputs from the two antennas (S(+) and S(−)), we can locate the bearing direction, which has indicated that the over-horizon signals were found to have the bearing of about +20◦ (east of the path). Next, we discuss the incident angle of the signal by looking at the bottom three panels. As was easily seen from the results of the panels, the output for the elevation of 0◦ is strongest, next for the elevation of 45◦, and consequently, a negligible output was seen for the elevation of 90◦ (verti-cally upward). By taking into account the radiation pattern in the elevation direction (as in the case of bearing estimation), the incident angle of the observed signal was estimated to be
∼10◦. It was furthermore confirmed by listening to the
de-modulated low frequency signal of the observed signal that the sound signal of the observed VHF wave was precisely the one from FM Sendai, thus verifying reception of the over-horizon signal from FM Sendai. It seems that the reception of the abnormal over-horizon signal may have been a precur-sor to a big earthquake that occurred seven days later (on 3 June).
After having shown a typical example in Fig. 2, we want to know the possible correlation between such an anomalous signal (as in Fig. 2) and an earthquake. In order to study such a correlation, we take, as a reasonable quantity, an average of the signal amplitude (as in Fig. 2) during one particular day (i.e. about six hours during midnight hours as in Fig. 2) as
x(t )(t = day). On the other hand, another physical quan-tity was related to the earthquake. First, we deal with the earthquakes occurring east of the transmitter-receiver path (occurring within a radius of 300 km from the receiver with azimuths less than 120◦) with magnitudes greater than 3.5. How to express another variable as y(t ) for any day pro-viding us with earthquakes seems to depend on the mech-anism of having such an anomalous VHF propagation. We assume that the magnitude of an anomalous VHF signal was proportional to the released energy of an earthquake (E) (E (in erg) = exp(11.8 + 1.5 M)) (M = magnitude) (Gutenberg-Richter law) (Kanamori, 1977), which seems reasonable and acceptable. The atmospheric perturbation effect in terms of an anomalous VHF signal amplitude was assumed to be re-lated to the depth of an earthquake by the expression of d−1 (d = depth in km), and finally, the signal intensity was rea-sonably related to the epicentral distance (r in km) as r−1 which is accepted from the wave propagation theory, thus,
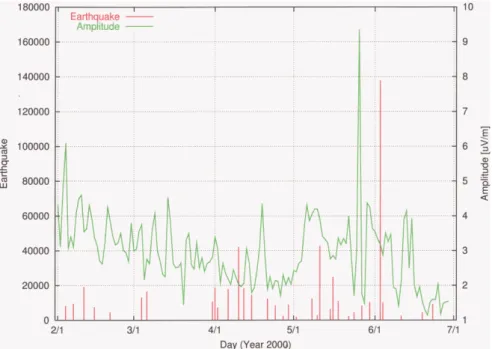
y = exp(11.8 + 1.5 M)/d/r. On some occasions when we have a few earthquakes on one particular day, we adopt the largest value y for any earthquake as the daily value for y(t ). An alternative method was to take the sum of the y’s corre-sponding to all earthquakes, but we have found no significant differences from the results. So, as an example, we indicate in Fig. 3 the daily plots of x(t ) and y(t ) for the earthquakes in the east of the path and for the signal intensity with a bearing
Fig. 2. An example of abnormal receptions of over-horizon FM signals on 27 May 2000. The outputs from six different antenna systems are
illustrated; from left to right on the upper panel; (1) vertical polarization (bearing=0◦, elevation=0◦), (2) horizontal polarization (bearing=-30◦, elevation=0◦), (3) same polarization (bearing +30◦, elevation = 0◦), then on the lower panel, from right to left; (4) horizontal polarization (bearing = 0◦, elevation = 0◦) (5) same polarization (bearing = 0◦, elevation = 45◦) and (6) same polarization (bearing = 0◦, elevation = 90◦ (upward)).
of +30◦and elevation of 0◦(horizontal polarization), corre-sponding to the top third panel in Fig. 2. When we look at Fig. 3 and compare these two plots, we can infer the correla-tion between the two. We look at the periods when the signal intensity exceeds a threshold (say 4µ V/m), and we try to make group-to-group correlations between the two. At the beginning of February we had several days with enhanced signal intensity (reception of over-horizon signal), and dur-ing that period we had earthquakes corresponddur-ingly. A series of earthquakes in the early half of May were likely to be pre-ceded by enhanced VHF signals in the beginning of May. Similarly, significant enhancement at the end of May (as in Fig. 2) was likely to be a precursor to the big earthquake at the beginning of June. A significant peak around 20 April seems to be closely associated with small earthquakes at the end of April. Earthquakes at the beginning of March and at the beginning of April were not clearly preceded by any VHF signal enhancements.
Apart from this kind of group-to-group correlation, we feel that there seems to be some kind of one-to-one
correla-tion existing between the propagacorrela-tion anomaly and an earth-quake when we look at the observational data daily, i.e. the correlations between a local maximum (as in Fig. 3) and an earthquake. Although the application of this method for such data was not verified, we performed a cross-correlation anal-ysis. Figure 4 is the corresponding result (lag-correlogram, though not normalized), for our six antenna systems. Let us look at the results for the antenna system (horizontal po-larization, bearing of 0◦ and elevation of 0◦) (down left in Fig. 4). A minus sign in the figure means that the signal re-ception was taking place before an earthquake. The figure indicates that there is a broad maximum from −7 days to 0 days, which may suggest that such receptions of over-horizon signals tends to occur before an earthquake.
The abnormal signal on 27 May in Fig. 2 was likely to be a precursor to a big earthquake (M = 5.8) which occurred on 3 June, whose epicentral azimuth was +94◦. However, the direction finding gave us the result of +20◦for the event in Fig. 2, and there seems to be a significant difference between the observed signal bearing and epicentral direction. Based
110 Y. Fukumoto et al.: Investigation of over-horizon VHF radio signals
Fig. 3. Temporal plots of the VHF
sig-nal amplitude and the corresponding in-formation on earthquakes during the en-tire observation period of five months.
Fig. 4. Cross-correlation between the
earthquakes taking place in the east of the path and abnormal signal reception (for the same antenna systems as in Fig. 2). Minus sign on the abscissa in-dicates that the signal reception was oc-curring before an earthquake.
on the correlation in Fig. 4, we have identified the earthquake corresponding to each propagation anomaly during the pe-riod of −7 days to 0 days. The statistical analysis on such a difference between the signal bearing and the corresponding epicentral direction is summarized in Fig. 5, indicating that the signal bearing is always more westward than the epicen-tral direction (the maximum difference is peaked at ∼ 30◦). Figure 5 suggests that the signal was coming very close to the coast of the Japan Islands, which may indicate the presence of a large perturbed region associated with the earthquake. We can comment on the statistical result of the signal eleva-tion, which indicates that the signal elevation was less than 20◦, while peaking at about 10◦.
Figure 6 illustrates the intensity of the observed over-horizon VHF signals, compared with the theoretical expecta-tion (Hall et al., 1996). The full line is the theoretical curve for the expected signal amplitude based on the information
according to the transmitter characteristics (antenna power, etc.) and receiver height. Up to the distance of the line of sight (∼ 50–80 km), the wave is considered a space wave and beyond this critical distance we have only a diffracted wave (indicated by a full line in the lower part of the figure), while the upper full line indicates the free space wave intensity. The observed signal intensity was mainly below the broken line (which is the extrapolaration of the space wave propaga-tion), but the strongest intensity exceeded this level.
4 Conclusion and discussion
The following observational facts have emerged from our preliminary analysis over five months.
1. Over-horizon VHF transmitter signals (though they are not received during normal conditions) were sometimes
Fig. 5. Statistical plot of the differences
between the signal bearings and epicen-tral directions in the case of earthquakes occurring only in the east of the great-circle path. Signal was always coming more westward than the epicentral di-rection.
Fig. 6. Theoretical estimation of signal
intensity as a function of distance, to-gether with the observed signal inten-sity.
observed during abnormal conditions (probably associ-ated with earthquakes).
2. Such abnormal over-horizon VHF signals were found to be received at our observing station with a small in-cident angle (inin-cident angle < 20◦).
3. The direction finding of the bearing of observed over-horizon signals showed that there was sometimes sub-stantial differences with regards to the bearing of a fu-ture epicenter.
4. The correlation between the abnormal over-horizon VHF signals and earthquakes indicated that there was a broad maximum about 7 to 0 days before an earthquake, suggesting a precursory effect in VHF signal reception. Based on these preliminary observational facts, we tried to answer the fundamental questions raised in the Introduc-tion. First of all, the signal from FM Sendai was actually ob-served on some occasions at a receiving station beyond the horizon. A comparison of the daily variations concerning the
VHF signal amplitude with that of earthquakes and the cross-correlation between the two, may indicate that such a recep-tion of over-horizon VHF signals might be due to the effect of earthquakes. The various over-horizon signals were observed with a small elevation angle (around 10◦, and less than 20◦),
which may imply that the signal reception was due to tropo-spheric effects (definitely not due to ionotropo-spheric scattering). Also, the bearing of the observed signal was significantly dif-ferent from the future epicentral direction, and we may infer that the perturbed region was considerably large (with radius of 100 km based on considerations of the signal bearing and the epicentral position) and the signal was likely to be com-ing from the coastal region. The important point was that the signal intensity was much higher than the diffracted level and was significantly large as shown in Fig. 6. Consequently, this means that the signal reception was unlikely caused by ionospheric scattering, but due to very favorable tropospheric propagation conditions associated with an earthquake.
With future work, it is of essential importance to show convincing evidence and also to perform appropriate corre-lation studies between abnormal signal receptions and
earth-112 Y. Fukumoto et al.: Investigation of over-horizon VHF radio signals
quakes to demonstrate the correlation between the two. Also, we need to investigate the generation mechanism of atmo-spheric perturbation associated with earthquakes. Finally, we have to investigate the natural noise (for vertical polarization in Figs. 2 and 4) associated with earthquakes.
Acknowledgements. The authors would like to express their sincere thanks to T. Yoshida of Hiroshima City University for his assistance in the system design.
References
Biagi, P.: Seismic effect on LF radio waves, in: Atmospheric and Ionospheric Electromagntic Phenomena Associated with Earth-quakes, (Ed) Hayakawa, M., Terra Sci. Pub. Co., 535–542, 1999. Gokhberg, M. B., Gufeld, I. L., Rozhnoy, A. A., Marenko, V. F., Yampolsky, V. S., and Ponomaren, E. A.: Study of seismic influ-ence on the ionosphere by super long-wave probing of the Earth-ionosphere waveguide, Phys. Earth Planet. Inter., 57, 64, 1989.
Hall, M. P., Barclay, L. W., and Hewitt, M. T.: Propagation of Ra-diowaves, Inst. Electr. Engrs., London, UK, 1996.
Hayakawa, M., (Ed): Atmospheric and Ionospheric Electromag-netic Phenomena Associated with Earthquakes, Terra Sci. Pub. Co., Tokyo, 997, 1999.
Hayakawa, M. and Fujinawa, Y. (Eds): Electromagnetic Phenom-ena Related with Earthquakes, Terra Sci. Pub. Co., Tokyo, 667, 1994.
Hayakawa, M., Molchanov, O. A., Ondoh, T., and Kawai, E.: The precursory signature of Kobe earthquake on VLF subionspheric signal, J. Comm. Res. Lab., 43, 169–180, 1996.
Kanamori, H.: The energy release in great earthquakes, J. Geophys. Res., 82, 2981–2987, 1977.
Kushida, Y. and Kushida, R.: On the possibility of earthquake fore-cast by radio observation in the VHF band, RIKEN Review, 19, 152–160, 1998.
Molchanov, O. A., and Hayakawa, M.: Subionospheric VLF sig-nal perturbations possibly related with earthquakes, J. Geophys. Res., 103, 17 489–17 504, 1998.