HAL Id: hal-01598571
https://hal.archives-ouvertes.fr/hal-01598571
Submitted on 6 Nov 2020
HAL is a multi-disciplinary open access archive for the deposit and dissemination of sci-entific research documents, whether they are pub-lished or not. The documents may come from teaching and research institutions in France or abroad, or from public or private research centers.
L’archive ouverte pluridisciplinaire HAL, est destinée au dépôt et à la diffusion de documents scientifiques de niveau recherche, publiés ou non, émanant des établissements d’enseignement et de recherche français ou étrangers, des laboratoires publics ou privés.
communities in cloud water
Pierre Amato, Muriel Joly, Ludovic Besaury, Anne Oudart, Najwa Taïb, Anne
I. Moné, Laurent Deguillaume, Anne-Marie Delort, Didier Debroas
To cite this version:
Pierre Amato, Muriel Joly, Ludovic Besaury, Anne Oudart, Najwa Taïb, et al.. Active microorganisms thrive among extremely diverse communities in cloud water. PLoS ONE, Public Library of Science, 2017, 12 (8), �10.1371/journal.pone.0182869�. �hal-01598571�
Active microorganisms thrive among
extremely diverse communities in cloud water
Pierre Amato1*, Muriel Joly1, Ludovic Besaury1, Anne Oudart1,2, Najwa Taib2, Anne
I. Mone´2, Laurent Deguillaume3, Anne-Marie Delort1, Didier Debroas2
1 Universite´ Clermont Auvergne, CNRS, Institut de Chimie de Clermont-Ferrand, Clermont-Ferrand, France, 2 Universite´ Clermont Auvergne, CNRS, Laboratoire Microorganismes: Ge´nome et Environnement,
Clermont-Ferrand, France, 3 Universite´ Clermont Auvergne, CNRS, Observatoire de Physique du Globe, Clermont-Ferrand, France
*pierre.amato@uca.fr
Abstract
Clouds are key components in Earth’s functioning. In addition of acting as obstacles to light radiations and chemical reactors, they are possible atmospheric oases for airborne microor-ganisms, providing water, nutrients and paths to the ground. Microbial activity was previ-ously detected in clouds, but the microbial community that is active in situ remains unknown. Here, microbial communities in cloud water collected at puy de Doˆme Mountain’s meteoro-logical station (1465 m altitude, France) were fixed upon sampling and examined by high-throughput sequencing from DNA and RNA extracts, so as to identify active species among
community members. Communities consisted of ~103−104bacteria and archaea mL-1and
~102−103eukaryote cells mL-1. They appeared extremely rich, with more than 28 000
dis-tinct species detected in bacteria and 2 600 in eukaryotes. Proteobacteria and Bacteroi-detes largely dominated in bacteria, while eukaryotes were essentially distributed among Fungi, Stramenopiles and Alveolata. Within these complex communities, the active mem-bers of cloud microbiota were identified as Alpha- (Sphingomonadales, Rhodospirillales and Rhizobiales), Beta- (Burkholderiales) and Gamma-Proteobacteria (Pseudomonadales). These groups of bacteria usually classified as epiphytic are probably the best candidates for interfering with abiotic chemical processes in clouds, and the most prone to successful aerial dispersion.
1. Introduction
The atmospheric envelope is a fundamental component of Earth’s functioning. Apart from holding huge energy exchanges, it transports, transforms and redistributes material at a large
scale; it also participates to the spreading of microorganisms over the globe (e.g., [1–5]).
Out-door, the air is dotted with microorganisms (virus, bacteria, archaea, and eukaryotes) originat-ing from surface habitats like vegetation, soil, water, or Humans/animals among natural
sources [6–8], at concentrations varying from ~102to ~106cells m-3(e.g., [9,10]. Some of them
are regarded with attention for potential health hazards to Humans, animals and plants [11].
a1111111111 a1111111111 a1111111111 a1111111111 a1111111111 OPEN ACCESS
Citation: Amato P, Joly M, Besaury L, Oudart A,
Taib N, Mone´ AI, et al. (2017) Active
microorganisms thrive among extremely diverse communities in cloud water. PLoS ONE 12(8):
e0182869.https://doi.org/10.1371/journal.
pone.0182869
Editor: Gabriel Moreno-Hagelsieb, Wilfrid Laurier
University, CANADA
Received: May 13, 2017 Accepted: July 25, 2017 Published: August 8, 2017
Copyright:© 2017 Amato et al. This is an open access article distributed under the terms of the
Creative Commons Attribution License, which permits unrestricted use, distribution, and reproduction in any medium, provided the original author and source are credited.
Data Availability Statement: All sequence files are
available from the NCBI Sequence Read Archive SRA database (BioProject ID PRJNA380262).
Funding: Funding provided by CNRS MicrobiEN
program (http://www.insu.cnrs.fr/ec2co),
"FONCOMIC" project, attributed to PA. MJ and LB were hired on the projects ANR-15-CE01-0002 ("INHALE") and ANR-DFG-14-CE35-005-02 ("CHLOROFILTER"), respectively.
Competing interests: The authors have declared
Surface ecosystems, also, are exposed to the continuous flow of diverse microbial incomers deposited from the atmosphere, bringing competitors, genetic material, and early colonizers in
emerging habitats (e.g., [3,12]. Yet, environmental fitness tends to decrease with increasing
distance from the source as habitats diverge [13], while, in addition, atmospheric transport
exposes cells to harsh environmental conditions [14,15]. Hence, for microorganisms unable to
produce resistance forms (spores), maintaining metabolic activity appears decisive for survival
and possibility of successful establishment in the receptacle environment (e.g. [16].
Within the atmospheric system, clouds are genuine atmospheric interfaces with the ground: they physically connect high altitudes with the surface by being to a large extent at the origin of
wet deposition of aerosols, including microorganisms [1,17,18]. Cloud water is a complex
mix-ture of soluble gas and particles dissolved into millions of micron-sized water droplets, and
forming very reactive and dynamic systems (e.g., [19]. As non-soluble biological particles,
some microorganisms can physically impact clouds by acting as embryos for the formation of
water droplets and ice crystals [20,21], with subsequent impacts on hydrological cycles [22–
26]. Observations of microbiological features in fog and clouds raised the possibility that these
also represent habitats for microorganisms [27–29], where they would actively take part in the
chemical reactivity through metabolic activity and nutrient utilization [30–34]. So far these
active « inhabitants » of clouds remain largely unknown. Microbiological studies in the atmo-sphere, including precipitation and deposition dust, essentially focused on the biodiversity,
pathogens, emission sources and environmental drivers [3,6,7,10,35]. A predominance of
Gram-negative bacteria (Alpha-, Beta- and Gamma-Proteobacteria, Bacteroidetes) is often observed, and attributed to inputs from soil and plants, with high temporal and spatial
vari-ability [3,6]. Current knowledge about the microorganisms living in clouds is essentially based
on cultures approaches, so limited to a small fraction (< 1%) of the whole community. These indicated the presence bacteria and fungi, with prevailing groups, in Proteobacteria notably,
and others appearing only once in a while [8,36–38]. Interrogations concerning the actualin
situ functioning of microbial communities in clouds remain, starting with the identification of
active members. Yet, these are probably better equipped than others (or better fitted) for
sur-viving in the atmosphere and clouds [14,15,39], interfering with abiotic atmospheric processes,
and they likely represent the potential successful colonizers of distant habitats. Here, using molecular methods, we investigate the structure of cloud water microbial communities and clarify our current vision of clouds as habitats by identifying active members. This consortium of active microorganisms finally revealed provides crucial information for further research on the interactions existing between microbial communities and abiotic processes in clouds, as well as important insights into the aerial dispersion of microorganisms.
2. Material and methods
2.1. Sample collection
Three cloud water samples were collected during the fall 2013 from the atmospheric station at the summit of puy de Doˆme Mountain (1465 m a.s.l., 45.772˚ N, 2.9655˚ E, France). Specific permission was not required since the station is operated by OPGC (Observatory of the Globe of Clermont-ferrand), who collaborated this study. The field study carried out did not involve
any endangered of protected species. Samples were collected at an air flow rate of 108 m3h-1
using a cloud droplet impactor similar as in [24,30,40]. It has been slightly modified for
allow-ing immediate fixation of the biological content (DNA and RNA) upon collection usallow-ing a fixa-tive agent: the water collected was transferred continuously, by gravity through autoclaved silicone tubing, to a sterile glass bottle containing 200 mL of a saturated ammonium sulphate
prepared under sterile conditions from fresh powders dissolved into sterile deionized water, then stored in sterile bottles. When samples froze upon impaction in the sampler, the ice col-lected was immediately melted into 200 mL of cold fixative solution. Before each sampling occasion, the presence of contaminants along the sampling apparatus and in the fixative solu-tion was controlled by pooring 200 mL of sterile water into the sampler. The resulting 400 mL control sample was then processed and analyzed in parallel. Samples and controls mixed with the fixative solution were processed immediately after sampling using the microbiology facility
of the puy de Doˆme’s atmospheric observatory. These were filtered on 0.22μm porosity filters
(MoBio 14880-50-WF), within a vertical laminar flow hood previously exposed to UV light for 15 minutes, the filters cut in halves with a sterile scalpel, and each half was finally transferred into bead-beating tubes of the MoBio Power Water kits for DNA or RNA extraction, and stored at -80˚C until being further processed, within a week. Samples for routine analyses (cell counts and chemical analyses, see below) were collected during the course of sampling by tem-porarily exchanging the collection bottle containing the fixative solution for an empty, sterile, glass bottle, until enough volume (~10–15 mL) was collected (~30 min).
2.2. Cell counts and chemical analyses
Cloud water samples collected in the absence of fixative solution were used for chemical and microbiological characterization. Ion analysis was realized within a month by ion chromatog-raphy on Dionex DX320 for anions (column AS11, eluant KOH) and Dionex ICS1500 for cat-ions (column CS16, eluant hydroxymethanesulfonate) on samples kept at -25˚C, similarly as
in [41]. Cell counts were performed by flow cytometry (BD FacsCalibur, Becton Dickinson,
Franklin Lakes, NJ) on 450μL triplicates added with 50 μL 5% glutaraldehyde (0.5% final
con-centration; Sigma-Aldrich G7651) stored for < 1week at 4˚C. For analysis, samples were
mixed with 1 vol. of 0.02μm filtered Tris-EDTA pH 8.0 (40 mM Tris-Base, 1 mM EDTA,
ace-tic acid to pH 8.0) and stained with SYBRGreen I (Molecular Probes Inc., Eugene, OR) from a
100X solution. Counts were performed for 3 minutes or 100,000 events at a flow rate of ~80μL
min-1(precisely further determined by weighting). Prokaryotes and eukaryotes were
distin-guished from background particles based on fluorescence and side scattering light intensities
(λexc= 488nm;λem= 530nm).
2.3. Meteorological data and backward trajectory plots
Meteorological variables were monitored continuously by the atmospheric observatory of the puy de Doˆme’s summit at 5 min intervals. Details on the instrumentation can be found at http://wwwobs.univ-bpclermont.fr/SO/mesures/instru.php. Twenty-four hours backward tra-jectory plots of the air masses sampled were computed for the puy de Doˆme’s site (45.772 N, 2.9655 E; 1465 m above sea level) using the NOAA HYSPLIT trajectory model (HYbrid
Sin-gle-Particle Lagrangian Integrated Trajectory; [42] using GDAS (1degree) meteorological data
archive and default parameters for this site.
2.4. Nucleic acids extraction, amplification and sequencing
DNA and RNA were extracted separately from dedicated filter halves using MoBio Power-Water isolation kits for DNA and for RNA, respectively, following manufacturer’s recommen-dations and including a DNase treatment step on RNA extracts. The absence (RNA fractions) or presence (DNA fractions) of DNA in the extracts was verified by PCR targeting the 16S rRNA gene of bacteria using the universal primers 1492r and 27f and similar PCR conditions
as in [40]. From RNA extracts, cDNA were obtained using Superscript VILO cDNA synthesis
from DNA extracts and cDNA products using primer couples targeting either the V4 region of
the 16S subunit of prokaryotes (primers 515F and 806R [43], or the V7 region of the 18S
sub-unit of eukaryotes (primers 960F-1200R [44];S1 Table). The “Marine” cloud was not
pro-cessed for RNA due to issues related to storage of the corresponding extract. PCR were
performed in total volumes of 30μL, containing 3 μL of 10X NH4reaction buffer, and final
concentrations of 2 mM MgCl2, 0.75 units of of Eurobio Taq II DNA polymerase (Eurobio,
5U/μL), 0.2 mM each dNTP, 0.5 mg mL-1BSA, and 0.2μM of each primer. The amplification
conditions consisted of an initial denaturation at 94˚C for 5 min followed by 30 cycles of 1 min. at 94˚C, 45 s. at 58˚C (16S) or at 55˚C (18S) and 45 s. at 72˚C, ended by a final elongation step of 7 min. at 72˚C. Amplicons length was verified by agarose gel electrophoresis then puri-fied using MinElute Gel Extraction kits (Qiagen) before quantification by fluorescence using Quant-it PicoGreen (Molecular Probes Inc., Eugene, OR). Finally, an equimolar pool of 14
PCR products was prepared (total amount of 510 ng of DNA (17 ng DNAμL-1in 30μL
molec-ular biology grade H2O). Further sample processing and sequencing was realized by
Genosc-reen (Lille, France). Briefly, DNA libraries were generated by adaptator ligation (section “Perform End Repair and Size Selection”, Illumina reagent kit V3), and controlled on Agilent High Sensitivity microarray. Sequencing (2×300 bp paired-end on Illumina MiSeq platform) yielded a total of 43 763 524 reads (13 129 Mb), 75.7% of which had a quality score Q30.
2.5. Sequence processing
A total of ~11.7 million reads were obtained from MiSeq sequencing. Prokaryotes, including Bacteria and Archaea, contributed ~6.6 millions reads in DNA and ~1.5 million reads in RNA (abbreviated into 16SDNA and 16SRNA, respectively), and eukaryotes ~2.5 millions reads in DNA and ~1.1 million reads in RNA (18SDNA and 18SRNA, respectively). These were
assem-bled with the vsearch tool (https://github.com/torognes/vsearch) and cleaning procedures
con-sisted in the elimination of sequences < 200 bp, presenting a mismatch in the forward or reverse primer, having ambiguous bases “N”, PHRED quality score < 25. The putative chimae-ras were detected by vsearch. The remaining rRNA 16S (prokaryotes) and 18S (eukaryotes) sequences were clustered into “molecular species” (Operational Taxonomy Units, OTUs) at a
97% and 95% similarity threshold (OTU0.03and OTU0.05, respectively), according to [45] and
[46] with vsearch (option cluster_small sorted by length). The representative sequence for
each OTU was inserted into phylogenetic trees for taxonomic annotation. The seed OTUs were finally affiliated by similarity and phylogeny from reference sequences extracted from the
SSURef SILVA database [47], according to the following criteria: length > 1 200 bp, quality
score >75% and a pintail value > 50. After comparing the OTUs with the reference sequences using a similarity approach (vsearch tool), trees including OTUs with their closest references
were built with FastTree [48]. The different taxonomic affiliations obtained were checked for
inconsistency. This process was implemented using the pipeline PANAM (Phylogenetic
Anal-ysis of Next-generation AMpliconshttps://github.com/panammeb/) and is described in more
detail in [49,50].
The resulting OTUs were subjected to additional conservative filtering intended to remove potential sequencing artefacts (OTUs represented by less than 3 reads), contaminants (OTUs detected in the control samples) and phantom OTUs (OTUs detected in RNA and not in the DNA fraction of the corresponding sample), totals of 761 729 and 140 645 reads and 48 202 and 37 504 reads remained in the DNA and RNA fractions for prokaryotes and eukaryotes, respectively. The corresponding sequence files were deposited to NCBI’s Sequence Read Archive (SRA BioProject ID PRJNA380262). Data were and normalized (proportions) rather
on datasets rarefied at different depth are summarized inS8 Figfor allowing comparison with other studies.
2.6. Data analyses
Data analyses were performed using the R environment version 3.2.2 [52], implemented with
thePhyloseq package (version 1.18.1; [53]) for calculating Shannon-Wiener indexes and
Abun-dance-based Coverage Estimators (ACE);Phyloseq was also employed for rarefying the
data-sets to depths similar as data found in the literature for richness comparison. Gini’s coefficient
was calculated using theineq package (version 0.2.13; [54]). Rarefaction curves were plotted
using the ggplot2 package (version 2.2.0; [55]) from community analyses made with thevegan
package (version 2.4.1; [56]); Venn diagrams were made using Venny 2.1.0 [57].
3. Results
3.1. Samples characteristics
The basic biological, chemical and meteorological features of the cloud water samples
investi-gated are shown inTable 1; these were usual for clouds collected at the Puy de Doˆme Mountain’s
atmospheric observatory [40,58]. Based on geographical origin (S1 Fig), pH, and major ions
composition, when available, these were classified into “Polluted”, “Continental” or “Marine”
type events (S2 Fig)[58]. These categories comprise 9%, 26% and 52% of the clouds observed at
puy de Doˆme, respectively [58]. Total cell concentration was within the range typically observed
in cloud water at this sampling site, with (2.05 to 9.49)×103Bacteria and Archaea mL-1and (0.4
to 8.7)×102eukaryotic cells mL-1, equivalent to (0.4 to 2.5)×103and 8 to cells 270 cells m-3of
cloudy air, respectively, depending on the sample (Table 1). Bacteria largely dominated the
com-munity, both in abundance (cell counts and read number) and richness (OTUs number): they represented ~90% of the DNA reads while eukaryotes contributed ~8%.and Archaea ~2%.
3.2. The cloud water microbiota: An extremely rich and imbalanced
community
A total of 28,143 OTUs were detected in prokaryotes (28,058 in Bacteria and 85 in Archaea) and 2,612 OTUs in eukaryotes. Each sample contained a fraction of the total richness, with ca. 7,800
to 20,500 OTUs0.03in prokaryotes and ca. 1,900 to 2,100 OTUs0.03in eukaryotes (Table 2).
Inflex-ions in the rarefaction plots of the different sets of sequences (S3 Fig) indicated that the actual
microbial communities targeted were well captured (coverage of 72% to 98%). The correspond-ing abundance-based coverage estimators (ACE) specified the presence of between ~10,800 and
~21,000 prokaryotic OTUs0.03per sample and ~2,400 eukaryotic OTUs0.05(Table 2). The results
concerning specifically the composition of prokaryote, eukaryote, then active communities are presented below.
3.2.1 Prokaryote community. In total, 30 different phyla were detected (of which 1 in
Archaea), distributed over 60 classes, 113 orders, 190 families and 286 genera. A complete list of the
abundance and taxonomic affiliation of prokaryotic OTUs is presented inS1 File. In all samples, the
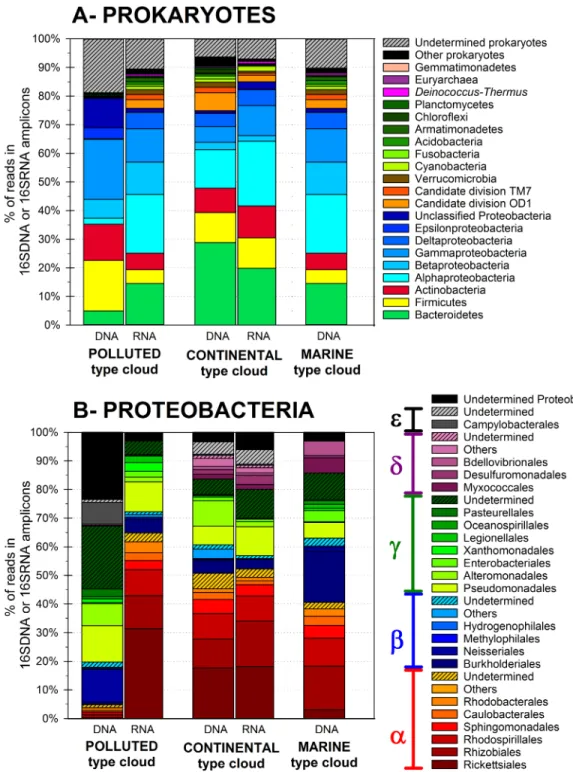
community was largely dominated by 4 bacterial phyla, which represented 75% to 79% of the reads
in DNA datasets and 85 to 88% in RNA (Fig 1A): Proteobacteria (28 to 51% of the DNA reads, in
particular the Gamma- (6–21%), Alpha- (2–21%) and Beta- (3–12%) classes;Fig 1B), Bacteroidetes
(5–30%), Firmicutes (5–18%) and Actinobacteria (6–13%). These phyla are almost systematically
reported dominant in outdoor airborne bacterial communities studies (e.g. [3,6,8,59–62]).
A total of 1,593 OTUs distributed over 103 genera were common to all samples (S4A Fig).
15%-Table 1. Main characte ristics of the samples . Biological data Meteorological data Chemical data Sample ID Local sampling starting
date
and
time
Local sampling ending
date and time Cloud type * Sample volume filtered and used for sequencing (mL) [equivalent air volume (m 3)] Total prokaryotic cells concentration (mL -1) Total eukaryotic cells concentration (mL -1) T (˚C) Wind speed (m s -1 ) Wind direction (˚/N) LWC b (g m -3) Dissolved ions concentrations ( μ M) Mean SE a Mean SE a Mean SE c Mean SE c Mean SE c Mean SE c pH Na + SE a Cl -SE a NO 3 -SE a CLOUD 1 10/11/13 10:36 AM 10/11/13 1:25 PM Polluted 94 [304 m 3of cloudy air] 8.23 × 10 3 ± 1.25 × 10 3 8.67 × 10 2 ± 3.15 × 10 2 -1.2 ± 0.2 ND * -ND * -0.16 ± 0.06 4.2 ND -ND -ND -CLOUD 2 10/14/13 10:00 PM 10/15/13 11:10 AM Continental 350 [1422 m 3of cloudy air] 9.49 × 10 3 ± 2.87 × 10 3 2.83 × 10 2 ± 1.05 × 10 2 6.5 ± 0.3 12.1 ± 1.5 218 ± 9 0.31 ± 0.05 4.7 79.0 ± 6.5 15.5 ± 2.8 38.5 ± 0.8 CLOUD 3 11/5/13 2:45 PM 11/6/13 1:30 PM Marine 420 [2457 m 3of cloudy air] 2.05 × 10 3 ± 1.39 × 10 3 4.42 × 10 1 ± 0.21 × 10 2 6.8 ± 0.8 18.3 ± 3.4 337 ± 4 0.40 ± 0.07 5.6 188.5 ± 12.6 0.2 ± 0.1 1.13 ± 0.7 ND: Not determined . * According to the classifica tion of clouds sampled at the puy de Do ˆme as establish ed by [ 58 ] (see S2 Fig ), based on pH, ion content and backtraj ectory plots (shown in S1 Fig ). aStandard error of 3 replica te measurem ents. bLiquid water content. cStandard error of average s of meteorolog ical variables collecte d every 5 minutes during sampling. https://do i.org/10.1371/j ournal.pone .0182869.t001
31% of the total 16SDNA reads in each sample. Their relative contribution to the whole
com-munity structure in the different samples is shown as a heat-map inS5A Fig. Dominant genera
comprised notably:Rickettsia, Sphingomonas, Methylobacterium and Acidiphilium in
Alpha-Proteobacteria;Pseudomonas, Enhydrobacter, Moraxella and Psychrobacter in
Gamma-Proteo-bacteria;Capnocytophaga in Bacteroidetes; Corynebacterium, Arthrobacter and Streptomyces in
Actinobacteria;Dolosigranulum, Clostridium in Firmicutes.
The samples had clear distinct patterns: ~70% of the total OTU richness observed in
prokary-otes was contributed by the “Polluted” type sample, with most of them being characteristic,i.e.
exclusive of this sample (15,152 OTUs representing 72% of the reads of this sample). Compara-tively, other samples had 2,600 to 3,000 characteristic OTUs which represented 8–12% of the
reads. The “Polluted” type cloud was characterized by relatively high abundance of
Dolosigranu-lum, Corynebacterium, Moraxella and Campylobacter bacteria. The “Marine” type cloud was
dominated by Proteobacteria affiliated withBdellovibrio, Pseudomonas, Methylobacterium,
Sphin-gomonas and Rickettsia; these were also well represented in the “Continental” type cloud, along
with some Firmicutes and Actinobacteria (Clostridium, Streptococcus and Corynebacterium).
3.2.2 Eukaryote community. Eukaryotic OTUs were distributed over 12 phyla, with 66
orders identified. A complete list of the abundance and taxonomic affiliation of eukaryotic
OTUs can be found inS2 File. A large proportion of reads (~50%) remained unaffiliated at the
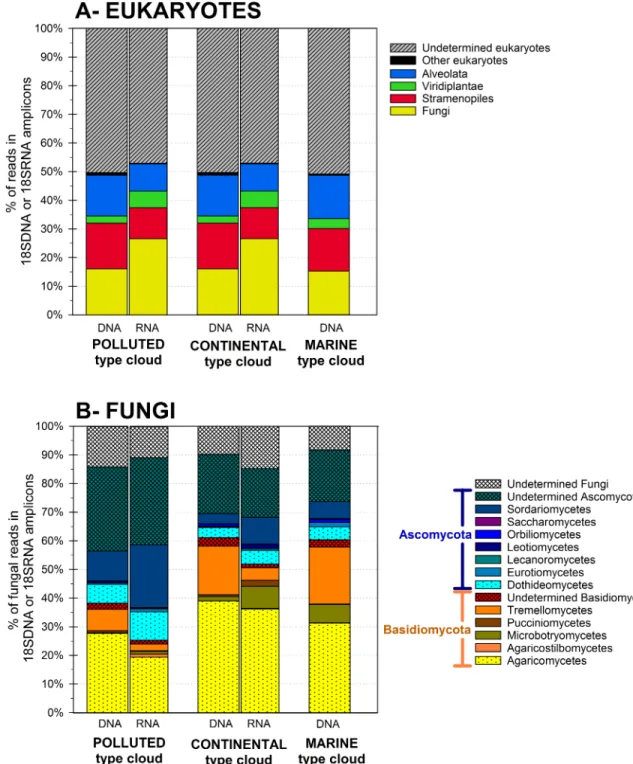
phylum level, both in DNA and RNA. The reads taxonomically identified in the DNA fraction were evenly distributed among Fungi, Stramenopiles and Alveolata (12% to 18%), while
Viri-diplantae represented ~3% (Fig 2A). Basidiomycota and Ascomycota largely dominated in
Fungi (Fig 2B). By far, most identified Basidiomycota were members of the classes
Agaromy-cetes (52% to 73%, with Polyporales and Agaricales the dominant families), TremellomyAgaromy-cetes (20% to 33%) and Microbotryomycetes (0.2% to 11%). In the phylum Ascomycota, among those identified to the class level, Sordariomycetes (12% to 22%) and Dothideomycetes (12%
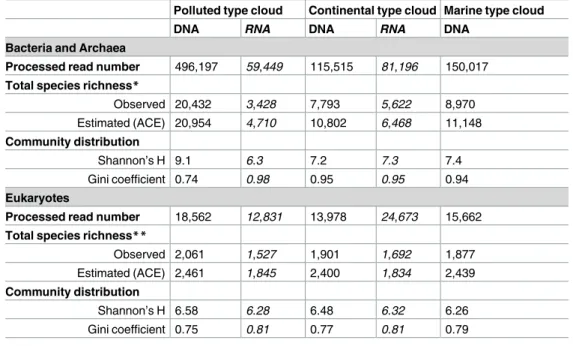
Table 2. Prokaryotic and eukaryotic communities’ richness and distribution.
Polluted type cloud Continental type cloud Marine type cloud
DNA RNA DNA RNA DNA
Bacteria and Archaea
Processed read number 496,197 59,449 115,515 81,196 150,017
Total species richness*
Observed 20,432 3,428 7,793 5,622 8,970 Estimated (ACE) 20,954 4,710 10,802 6,468 11,148 Community distribution Shannon’s H 9.1 6.3 7.2 7.3 7.4 Gini coefficient 0.74 0.98 0.95 0.95 0.94 Eukaryotes
Processed read number 18,562 12,831 13,978 24,673 15,662
Total species richness**
Observed 2,061 1,527 1,901 1,692 1,877
Estimated (ACE) 2,461 1,845 2,400 1,834 2,439
Community distribution
Shannon’s H 6.58 6.28 6.48 6.32 6.26
Gini coefficient 0.75 0.81 0.77 0.81 0.79
*OTUs clustered at 97% sequence similarity. **OTUs clustered at 95% sequence similarity.
to 15%) dominated; other classes (Eurotiomycetes, Lecanoromycetes, Leotiomycetes, Orbilio-mycetes and SaccharoOrbilio-mycetes) represented < 5% of the reads.
A total of 1,209 eukaryotic OTUs were shared between the samples (S4B Fig). These were
distributed over 39 orders, gathering 15.2% to 16.6% of the total reads of the samples and 91% to 97% of those identified at this taxonomic depth. Their relative abundance in the eukaryotic
communities of each sample is shown as a heat-map inS5B Fig. Dominant shared orders in all
samples included notably Bicoseocida, Polyporales, Charales and Euplotida.
3.3. Active community
The active community, as detected in RNA extracts, was a fraction of the total community.
This included 26.4% of the total richness observed in prokaryotes (7,438 OTUs0.03) and 82%
(2,612 OTUs0.05) in eukaryotes. The samples were globally less distinct in their RNA fraction
than they were in their DNA fraction (S6 Fig). A total of 1,612 prokaryotic OTUs were shared
between the RNA fractions of 2 samples analyzed. These were distributed over 97 identified genera gathering in total 32% to 34% of the 16SRNA reads, of which a few dominant genera
contributed each around 1%:Rickettsia, Spirosoma, Enhydrobacter, Corynebacterium,
Acidiphi-lium, Sphingomonas, Pseudomonas and Methylobacterium. In eukaryotes, most RNA reads
(18% to 27%) were attributed to Fungi, whereas Stramenopiles and Alveolata each were repre-sented by ~10%, and Viridiplantae by ~6%. A the order level, dominant Fungi included Mag-naporthales and Pleosporales in Ascomycota, Polyporales and Sporidiobolales in
Basidiomycota), SAR (Bicosoecida) and others such as Syndiniales, a group of dinoflagellates.
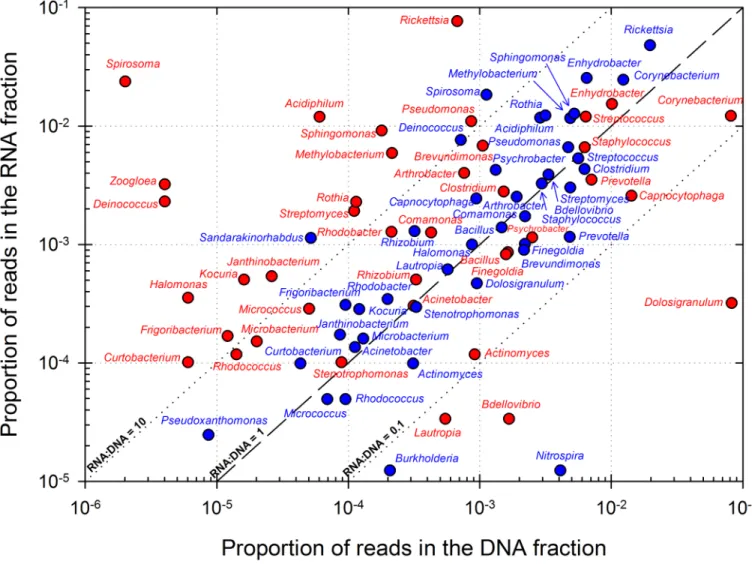
Figs3and4compile overall most represented bacterial genera and eukaryotic orders,
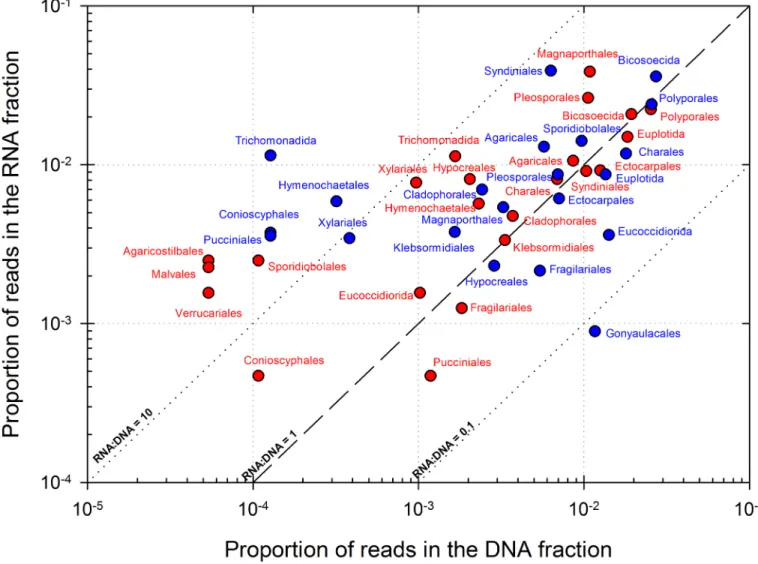
respec-tively, in corresponding DNA and RNA datasets. The relative abundance of RNA, respect to DNA, in an OTU (abbreviated into RNA:DNA ratio for clarity) is often used for estimating its rel-ative level of metabolic activity, with higher ratios linked with potentially higher metabolic activity
[63,64]. RNA:DNA ratio ranged between 0 and 210 in eukaryotes, and from 0 to, exceptionally,
11,760 in prokaryotes in an OTU affiliated toSpirosoma (Bacteroidetes). Low abundance groups
tended to exhibit high ratios, in prokaryotes and in a lesser extent also in eukaryotes (seeS7 Fig),
as observed by others in atmospheric samples [65], but by far, most RNA:DNA ratios were
bet-ween 0.1 and 10. Alpha- and Gamma-Proteobacteria clearly dominated in bacterial taxas with
ratio > 1 (i.e. potentially metabolically active taxa). NotablyRickettsia, Sphingomonas,
Methylobac-terium, Enhydrobacter, Pseudomonas, and Acidiphilium genera were highly represented and were
probably the most active taxas. In bacteria, these included notablySpirosoma, Deinococcus
(Deino-coccus-Thermus),Janthinobacterium (Beta-Proteobacteria), Frigoribacterium and Curtobacterium
(Actinobacteria). Conversely, some bacteria were found abundant but exhibited very low or no activity based on RNA:DNA ratio. These comprised essentially Gram-positive bacteria:
Actino-bacteria (Corynebacterium, Actinomyces) and Firmicutes (Dolosigranulum, Staphylococcus), and
also members of Proteobacteria (Bdellovibrio, Burkholderia), Bacteroidetes (Capnocytophaga) and
others likeNitrospira. In eukaryotes the orders Magnaporthales, Syndiniales, Pleosporales,
Poly-porales, Bicosoecida and Sporidiobolales in particular were markedly abundant in both the DNA and RNA datasets.
4. Discussion
4.1. Clouds are extremely rich and diverse mosaics of multiple sources
ecosystems
In this work, we aimed at drawing a picture of the structure of cloudborne microbial commu-nities, including active groups and rare taxa. The detection of eventual environmental drivers
such as meteorological variables to the microbial communities observed was beyond the scope of this study. Thus, we chose to orient our investigations toward large sample volumes, associ-ated with deep sequencing. Consistently, species richness reaches here an unprecedented value in atmospheric samples, with ~11,000 to ~21,000 distinct OTUs estimated in prokaryotes and ~2,400 in eukaryotes. Such high richness are uncommon and in general rather reported in
Fig 1. Prokaryotic total (DNA fraction) and active (RNA fraction) community composition in the cloud water samples at the phylum level (A),and relative distributions of Proteobacteria orders (B).
soils (e.g., [66,67]. In the atmosphere, although much less is known, it is often described as a
highly diverse environment (e.g., [7,8,60,68–70]. The high richness observed in our samples
can be related to the large sample volumes considered. It is clear that scale problems arise
when estimating community richness in open ecological systems [71,72], especially in dynamic
environments like the atmosphere where the biomass is low. Comparatively, DNA analyses
Fig 2. Eukaryotic total (DNA fraction) and active (RNA fraction) community composition in the cloud water samples
at the kingdom level (A), and relative distributions of Fungal classes (B).
were carried out in reference studies from 2.7 to 144 m3of air at mid-altitude sites (ca. 1,500 to
3,000 m asl.; [35,65], and ~6 m3of air in the free troposphere (i.e. ~3×10⁴bacterial cells per
sample; [10]). Volumes similar as in our study were notably used for assessing fungal [73] and
prokaryotic diversity [4] in aerosols at global scale: up to 1,100 species of fungi and 2,900
spe-cies of prokaryotes per sample were observed. Recently [62] detected up to 1,910 species in
cloud water volumes of 100 mL, on data rarefied to 9,100 sequences. A richness equivalent was
observed in our study when rarefying data to a comparable depth (S8 Fig). Finally, bacterial
species richness similar as our findings was reported from large rain samples (7–22 liters),
with 13,083 OTUs0.03[74], in [61].
The structure of the communities was investigated through ecological indexes (Table 2).
Shannon’s H indexes ranging from 6.3 to 9.1 demonstrated extreme biodiversity, in a large part contributed to by the numerous rare species. Indeed, the communities, in particular prokary-otes, were highly uneven with a low proportion of abundant species and many rare, as shown
by OTU rank-abundance plots (S3C and S3D Fig), Lorenz curves (S9 Fig) and corresponding
Gini’s coefficients close to 1 (0 being a perfect equality in OTU abundance distribution and 1
Fig 3. Representation of the major prokaryotic genera identified in DNA and RNA datasets. Dashed and dotted lines depict RNA:DNA ratios
of 0.1, 1 and 10. The top 20 genera based on their average position rank over the 3 cloud samples are shown, as well as some selected for high representation in RNA datasets (43 distinct genera in total). POLL: “Polluted” type cloud; CONT: “Continental” type cloud.
being perfect inequality,i.e. a very contrasted abundance distribution between OTUs).
Illustrat-ing this, despite conservative sequence filterIllustrat-ing, the 1% most abundant OTUs represented around ~20% of the reads in eukaryotes and ~35% in prokaryotes, respectively, and the top half OTUs more than 90%. This high unevenness suggests that the global functioning of the
com-munity is fragile (not robust), sensitive to stress [75], and so, likely to be variable in space and
time. If an abundant group was to be lost from the community, i.e. a group that is likely to con-tribute significantly to the structure and global functioning of the system, there would be a high probability to lose or reduce also the functions associated with it. This ecological theory, that functional stability implies even structure, derives from established ecosystems and it is applied here for apprehending the functioning of cloud’s microbial communities in the frame of clouds as microbial habitats hypothesis; it is possible though that this is not applicable to environments acting mainly as transport areas, where microbial establishment is by essence not possible, like clouds.
Any microbe inhabiting a surface environment has a probability to get aerosolized, though
more or less promptly depending on its physiological characteristics (e.g.,[76] and other
Fig 4. Representation of the major eukaryotic orders identified in DNA and RNA datasets. Dashed and dotted lines depict RNA:DNA ratios of
0.1, 1 and 10. The top 20 genera based on their average position rank over the 3 cloud samples are shown, as well as some selected for high representation in RNA datasets (24 distinct orders in total). POLL: “Polluted” type cloud; CONT: “Continental” type cloud.
environmental variables linked with its habitat, like exposure to mechanical disturbances by
wind or rainfall for instance [77–79]. The community observed likely resulted from the mixing
of microbial inputs from myriads of different sources, albeit not confidently quantifiable here. The high unevenness observed could suggest by itself that there is a marked influence of some specific environments over others; this assumes temporal stability on sources and equivalent
strengths among sources and microorganisms, and this is probably not the case (e.g., [67,80,81].
Rather, the variability between the samples indicated that the sources themselves are large and
rich, so a variety of possible children communities can emerge from it [82].
As needles in a haystack of complex communities, the presence of more or less specific trac-ers can inform about emission sources. It is widely observed, and our samples are no exception, that airborne microorganisms outdoors most likely originate from soil, vegetation, surface waters and animals among natural sources; Humans and activities such as composting can also
create bioaerosols in high number (e.g., [35,76,79,83,84]). Proteobacteria and Bacteroidetes
dominated the communities observed, with also a good representation of Actinobacteria and
Firmicutes, as usually in airborne microbial communities [6,8,10,59,60,85]. Prokaryotic
endo-symbionts or parasites of eukaryotes (Rickettsia, Wolbachia)[86,87] were present in high
pro-portion. To our knowledge, this is the first report of such abundance of these organisms in atmospheric samples. Their presence is not surprising as they probably originated from the
numerous plant, insect, arthropod and other animal fragments contained among aerosols [88].
Rickettsia are ultra-small bacteria thought to be at the origin of mitochondria in eukaryotes
(endosymbiotic theory) [89]. The abundance of Pseudomonads and Sphingomonads attested of
important inputs from vegetation in all samples (e.g., [90,91]), whereas others likeStreptomyces
rather refer to soils. These apart,Bdellovibrio, a genus of Delta-Proteobacteria found in water
environments, dominated in the “Marine” type cloud was, and taxa generally affiliated with
soils, decomposing organic material, animals, and humans, likeDolosigranulum,
Corynebacte-rium, Moraxella, Campylobacter and Capnocytophaga (e.g., [92]) were abundant in the “Pol-luted” type cloud. Wei et al. studied polluted and non-polluted fog events in China and also
observed a prevalence of potential Human pathogens in the polluted air masses [61].
In eukaryotes, Basidiomycota tended to dominate over Ascomycota, as a result from
continen-tal inputs [11,73,93]. The relative dominance of Basidiomycota over Ascomycota in the air was
revealed recently by culture-independent methods [11,93]. More precisely, Basidiomycota tend to
dominate in continental air masses, whereas Ascomycota prevail in marine air masses [73].
Despite sampling site’s remoteness from ocean, samples kept a marine biological signature detectable on the taxonomic affiliation of some abundant groups of microorganisms, as also
observed for chemical composition: marine or water-related taxa, in prokaryotes (Bdellovibrio,
Delta-Proteobacteria) and in eukaryotes [green, brown and red algae (Charales, Ectocarpales, Hildenbrandiales, Fucales, Cladophorales), diatoms (Fragilariales, Thalassiosirales, Hemiaulales), fungi and protozoans affiliated with water environments (Syndiniales, Saprolegniales, Conioscy-phales)]. Saprophytic fungi affiliated with vegetation, soils and decomposing litters were also par-ticularly abundant: Polyporales, Sporidiobolales, Agaricales, Pleosporales, and others.
Although it is not statistically verifiable, we observed that the prokaryotic community, and in a lesser extent the eukaryotic community, were richer (ACE estimator), more diverse (Shan-non’s index), and less uneven (Gini’s coefficient) in the “Polluted” type cloud than in
non-pol-luted “Continental” or “Marine” type clouds (Table 2). A relationship between Human
activities and microbial communities structure in clouds was reported in China [61], with
higher diversity in non-polluted clouds. Another study rather pointed out an impact of day and night on the composition of bacterial communities in clouds; a higher representation of
Alpha-Proteobacteria during the night, notably, was reported [62], but the reasons for such
4.2. Clouds are environments open to all, but where only some can
thrive: active groups
Among the high diversity of cloud microbial communities, some were capable of maintaining met-abolic activity in cloud despite probable stressful conditions. According to criteria of abundance in
both DNA and RNA fractions, RNA:DNA ratio (Fig 3), frequency of recovery in cultures in earlier
studies [40], and other hints from previous reports [10,65], and at the exception of eukaryotic
endo-symbionts (Rickettsia), these probable main bacterial “inhabitants” of clouds can be named:
Alpha-and Gamma-Proteobacteria, in particularSphingomonas (order Sphingomonadales),
Methylobac-terium (Rhizobiales), Acidiphilium (Rhodospirillales), Pseudomonas (Pseudomonadales), Comamo-nas (Burkholderiales) and, to a lesser extent, Enhydrobacter and Psychrobacter (Pseudomonadales).
Among more discrete genera,Curtobacterium, Deinococcus, Spirosoma, Rhizobium and
Janthino-bacterium notably can also be cited here, along with, in other phyla, Arthrobacter, Staphylococcus.
All these have physiological properties compatible with their maintenance in the high atmosphere and clouds, and they probably interact with their cloud water environment with potential impacts on chemistry. Many of these are epiphytic taxa commonly recovered viable from air and clouds [8,9,17,29,84,94–96]. On the other hand, tracers of polluted air masses could reside amongst the
most abundant species in DNA, likeDolosigranulum or Capnocytophaga.
Many of the microorganisms identified relate to vegetation: epiphytic, parasitic and endo-symbiontes. Plant leaves, like clouds, are subjected to frequent temperature and humidity shifts, high levels of UV light, etc. It is possible that these bacteria acquired physiological traits
compatible with survival in clouds from this lifestyle.Pseudomonas and Sphingomonas species
are versatile bacteria abundant in the environment, particularly on vegetation (e.g., [80]).
Pseu-domonas are among the bacteria the most frequently recovered by culture (i.e. viable) from
clouds and atmospheric samples [17,27,40], where their presence is particularly interesting for
many reasons: plant pathogenicity and epidemiology, degradation of organic compounds in
clouds [97,98]; production of siderophores and interactions with iron and radical chemistry
[99]; production and release of surfactants, which could facilitate the formation of cloud water
droplets [21,68]; ice nucleation, which in clouds can trigger precipitation (hypothesized as
“bioprecipitation”) (e.g.[96]).Sphingomonas are pigmented oligotrophic bacteria, frequently
described as psychrotolerant bacteria recovered from polar environments and air samples
[36,100,101]. Many of them are studied for their intrinsic resistance to numerous antibiotics
[102], and for their capacity to degrade xenobiotics [103], alikeComamonas [104].
Methylobac-terium are methylotrophic bacteria, i.e. they can develop on one-carbon compounds such as
methanol, formaldehyde or formate [105,106], which are abundant in the atmosphere and in
cloud water [41,98]. Some species can use compounds shown to be responsible for ozone
depletion in the stratosphere, such as chloromethane [107]. The presence and potential activity
of methanotrophic bacteria in the air was shown previously [32].Acidiphilium have high
capacities of interaction with iron [108,109] and so is a good candidate for interfering with
cloud water oxidant capacity [33]; it remains yet rarely isolated by culture.Enhydrobacter have
gas-vacuole helping floatation in aquatic environments [110], and it is possible that this
favored its aerosolization from waters bodies (e.g., 104). Finally,Deinococcus and Spirosoma
are known for their high resistance to DNA-damages such as those caused by UV light
[111,112], so their presence among the common core of the community is no surprise.
Spiro-soma species have been described from Arctic and Mountain regions [112,113].
In eukaryotes, endosymbiontes and parasites flagellate protists (Syndiniales and Bicosoecida) dominated in DNA, but active groups included mainly plant pathogens and saprophytic fungi
from terrestrial or aquatic origins known for aerial dispersion [114–116] in Ascomycota
Hymenochaeales and Sporodiobolales) (Fig 4). Ascomycota were previously reported dominant
in the active fraction of airborne fungi [93], and in Basidiomycota, Sporodiobolales includes
yeasts frequently isolated from cloud water samples at the same site,Rhodotorula and
Sporobolo-myces [40], However, if RNA:DNA ratio gives hints about potentially active eukaryotes,
ribo-some gene number is intrinsically more variable than it is in prokaryotes [117]; so estimating
their actual relative activity in cloud water will necessitate more investigations.
Our investigations revealed an incredible richness in the atmosphere, originating from a variety of different sources and meeting in clouds. High inequities suggested high sensibility to perturbations, including potentially stress caused by Human activities. Frequent species proba-bly composed most of the biomass, but the vast majority of the diversity was contributed by
rare species. This feature, common in the environment (e.g., [118], funded the “everything is
everywhere” concept (e.g., [119]. There is no “global atmosphere” with a specific community
structure and functioning, but rather a multitude of different regional to local atmospheres dis-tributed over the globe, as moving airborne imprints of surface ecosystems. On top of this, some atmospheric corridors connecting distant regions together and defining some extent of
bio-geographical distribution of microorganisms on the planet have been identified [5,73,118].
Airborne communities are sorts of blurred airborne imprints of surface ecosystems gather-ing and overlappgather-ing with each other in clouds A set of microorganisms able to maintain meta-bolic activity in clouds was identified among complex communities. In previous studies, many
of these active taxa were frequently recovered by culture from cloud water samples [29,40].
These represent the microorganisms the most prone to interfere with their cloud chemical environment. They are also potential competitors brought to surface receptacle ecosystems by atmospheric deposition, and the early colonizers of emerging environments. Their identifica-tion certainly helps understanding the atmosphere as a habitat; it will also allow focusing researches for evaluating microbial impact on cloud physical and chemical processes, but their
actual functioning, the “what do they do?” question remains to be answered.
Supporting information
S1 File. 16S rRNA and 16S rRNA gene amplicons taxonomic affiliations and abundances in the datasets.
(XLSX)
S2 File. 18S rRNA and 18S rRNA gene amplicons taxonomic affiliations and abundances in the datasets.
(XLSX)
S1 Table. Oligonucleotide sequences of primers and indexes used for barcoded PCR ampli-fication of prokaryotic and eukaryotic ribosomal genes.
(DOCX)
S1 Fig. Twenty-four hour backward trajectory plots of the air masses corresponding to the cloud event sampled.
(TIF)
S2 Fig. Principal component analysis used for categorizing clouds at this sampling site
based on chemical composition, implemented from [58].
(TIF)
S3 Fig. Rarefaction curves (A and B) and rank-abundance plots (C and D) of the different set
of amplicons. (TIF)
S4 Fig. Venn diagrams depicting similarities and singularities of the 3 samples at the OTU0.03
level for prokaryotes (A) and OTU0.05for eukaryotes (B).
(TIF)
S5 Fig. Relative abundance of shared prokaryotic genera (A) and eukaryotic orders (B).
(TIF)
S6 Fig. Bray-Curtis similarity matrices between the different sets of sequence of prokaryotes
(A) and eukaryotes (B). (TIF)
S7 Fig. Relative OTU representation in extracts of RNA respect to DNA in corresponding datasets, showing a trend of higher RNA.DNA ratios in rare OTUs.
(TIF)
S8 Fig. Observed OTUs, richness estimators and Shannon’s indexes calculated at different rarefactions depths.
(TIF)
S9 Fig. Lorentz curves of the different sets of sequences.
(TIF)
Acknowledgments
We warmly thank the numerous people who helped us concretizing this study: J. Colombet, L. Nauton, J.M. Pichon, I. Mary, F. Enault, J.C. Charvy, A. Mahul and the Mesocentre Calcul Center, and G. Lefebvre for language corrections in the manuscript.
Author Contributions
Conceptualization: Pierre Amato, Anne-Marie Delort.
Data curation: Pierre Amato, Muriel Joly, Ludovic Besaury, Anne Oudart, Najwa Taib, Didier
Debroas.
Formal analysis: Pierre Amato, Muriel Joly, Ludovic Besaury, Anne Oudart, Najwa Taib. Funding acquisition: Pierre Amato, Anne-Marie Delort.
Investigation: Pierre Amato, Anne Oudart, Najwa Taib, Anne I. Mone´, Laurent Deguillaume. Methodology: Pierre Amato, Najwa Taib, Laurent Deguillaume, Didier Debroas.
Project administration: Pierre Amato.
Resources: Pierre Amato, Laurent Deguillaume, Didier Debroas. Software: Najwa Taib, Didier Debroas.
Supervision: Pierre Amato.
Validation: Pierre Amato, Didier Debroas. Visualization: Pierre Amato, Muriel Joly.
Writing – original draft: Pierre Amato, Muriel Joly, Ludovic Besaury, Anne Oudart, Laurent
Deguillaume, Anne-Marie Delort, Didier Debroas.
References
1. Burrows SM, Butler T, Jo¨ckel P, Tost H, Kerkweg A, Po¨schl U, et al. Bacteria in the global atmo-sphere–Part 2: Modeling of emissions and transport between different ecosystems. Atmos Chem Phys. 2009; 9: 9281–9297.https://doi.org/10.5194/acp-9-9281-2009
2. Griffin DW, Garrison VH, Herman JR, Shinn EA. African desert dust in the Caribbean atmosphere: Microbiology and public health. Aerobiologia. 2001; 17: 203–213.https://doi.org/10.1023/ A:1011868218901
3. Barbera´n A, Henley J, Fierer N, Casamayor EO. Structure, inter-annual recurrence, and global-scale connectivity of airborne microbial communities. Sci Total Environ. 2014; 487: 187–195.https://doi.org/ 10.1016/j.scitotenv.2014.04.030PMID:24784743
4. Smith DJ, Timonen HJ, Jaffe DA, Griffin DW, Birmele MN, Perry KD, et al. Intercontinental dispersal of bacteria and archaea by transpacific winds. Appl Environ Microbiol. 2013; 79: 1134–1139.https://doi. org/10.1128/AEM.03029-12PMID:23220959
5. Womack AM, Bohannan BJM, Green JL. Biodiversity and biogeography of the atmosphere. Philo-sophical Transactions of the Royal Society of London B: Biological Sciences. 2010; 365: 3645–3653. https://doi.org/10.1098/rstb.2010.0283PMID:20980313
6. Bowers RM, Clements N, Emerson JB, Wiedinmyer C, Hannigan MP, Fierer N. Seasonal Variability in Bacterial and Fungal Diversity of the Near-Surface Atmosphere. Environ Sci Technol. 2013; 47: 12097–12106.https://doi.org/10.1021/es402970sPMID:24083487
7. Brodie EL, DeSantis TZ, Parker JPM, Zubietta IX, Piceno YM, Andersen GL. Urban aerosols harbor diverse and dynamic bacterial populations. PNAS. 2007; 104: 299–304.https://doi.org/10.1073/pnas. 0608255104PMID:17182744
8. Sˇ antl-Temkiv T, Finster K, Hansen BM, Nielsen NW, Karlson UG. The microbial diversity of a storm cloud as assessed by hailstones. FEMS microbiology ecology. 2012; 81: 684–695.https://doi.org/10. 1111/j.1574-6941.2012.01402.xPMID:22537388
9. Bowers RM, Lauber CL, Wiedinmyer C, Hamady M, Hallar AG, Fall R, et al. Characterization of Air-borne Microbial Communities at a High-Elevation Site and Their Potential To Act as Atmospheric Ice Nuclei. Appl Environ Microbiol. 2009; 75: 5121–5130.https://doi.org/10.1128/AEM.00447-09PMID: 19502432
10. DeLeon-Rodriguez N, Lathem TL, Rodriguez-R LM, Barazesh JM, Anderson BE, Beyersdorf AJ, et al. Microbiome of the upper troposphere: Species composition and prevalence, effects of tropical storms, and atmospheric implications. PNAS. 2013; 110: 2575–2580.https://doi.org/10.1073/pnas.
1212089110PMID:23359712
11. Fro¨hlich-Nowoisky J, Pickersgill DA, Despre´s VR, Po¨schl U. High diversity of fungi in air particulate matter. PNAS. 2009; 106: 12814–12819.https://doi.org/10.1073/pnas.0811003106PMID:19617562
12. Morris CE, Sands DC. Impacts of microbial aerosols on natural and agro-ecosystems: immigration, invasions and their consequences. Microbiology of aerosols. John Wiley and Sons Inc. Hoboken, New Jersey, USA: Delort, A.M. and Amato, P.; 2017.
13. Nekola JC, White PS. The distance decay of similarity in biogeography and ecology. Journal of Bioge-ography. 1999; 26: 867–878.https://doi.org/10.1046/j.1365-2699.1999.00305.x
14. Joly M, Amato P, Sancelme M, Vinatier V, Abrantes M, Deguillaume L, et al. Survival of microbial iso-lates from clouds toward simulated atmospheric stress factors. Atmospheric Environment. 2015; 117: 92–98.https://doi.org/10.1016/j.atmosenv.2015.07.009
15. Smith DJ, Griffin DW, McPeters RD, Ward PD, Schuerger AC. Microbial survival in the stratosphere and implications for global dispersal. Aerobiologia. 2011; 27: 319–332.https://doi.org/10.1007/ s10453-011-9203-5
16. Price PB, Sowers T. Temperature dependence of metabolic rates for microbial growth, maintenance, and survival. Proc Natl Acad Sci U S A. 2004; 101: 4631–4636.https://doi.org/10.1073/pnas. 0400522101PMID:15070769
17. Monteil CL, Bardin M, Morris CE. Features of air masses associated with the deposition of Pseudomo-nas syringae and Botrytis cinerea by rain and snowfall. ISME J. 2014; 8: 2290–2304.https://doi.org/ 10.1038/ismej.2014.55PMID:24722630
18. Zhao TL, Gong SL, Zhang XY, McKendry IG. Modeled size-segregated wet and dry deposition bud-gets of soil dust aerosol during ACE-Asia 2001: Implications for trans-Pacific transport. J Geophys Res. 2003; 108: 8665.https://doi.org/10.1029/2002JD003363
19. Herrmann H, Schaefer T, Tilgner A, Styler SA, Weller C, Teich M, et al. Tropospheric Aqueous-Phase Chemistry: Kinetics, Mechanisms, and Its Coupling to a Changing Gas Phase. Chemical Reviews. 2015; 115: 4259–4334.https://doi.org/10.1021/cr500447kPMID:25950643
20. Mo¨hler O, DeMott PJ, Vali G, Levin Z. Microbiology and atmospheric processes: the role of biological particles in cloud physics. Biogeosciences. 2007; 4: 1059–1071. https://doi.org/10.5194/bg-4-1059-2007
21. Renard P, Canet I, Sancelme M, Wirgot N, Deguillaume L, Delort A-M. Screening of cloud microorgan-isms isolated at the Puy de Doˆme (France) station for the production of biosurfactants. Atmos Chem Phys. 2016; 16: 12347–12358.https://doi.org/10.5194/acp-16-12347-2016
22. Bigg EK, Soubeyrand S, Morris CE. Persistent after-effects of heavy rain on concentrations of ice nuclei and rainfall suggest a biological cause. Atmos Chem Phys. 2015; 15: 2313–2326.https://doi. org/10.5194/acp-15-2313-2015
23. Creamean JM, Suski KJ, Rosenfeld D, Cazorla A, DeMott PJ, Sullivan RC, et al. Dust and Biological Aerosols from the Sahara and Asia Influence Precipitation in the Western U.S. Science. 2013; 339: 1572–1578.https://doi.org/10.1126/science.1227279PMID:23449996
24. Joly M, Amato P, Deguillaume L, Monier M, Hoose C, Delort A-M. Quantification of ice nuclei active at near 0˚C temperatures in low-altitude clouds at the Puy de Doˆme atmospheric station. Atmos Chem Phys. 2014; 14: 8185–8195.https://doi.org/10.5194/acp-14-8185-2014
25. Morris CE, Sands DC, Bardin M, Jaenicke R, Vogel B, Leyronas C, et al. Microbiology and atmo-spheric processes: research challenges concerning the impact of airborne micro-organisms on the atmosphere and climate. Biogeosciences. 2011; 8: 17–25.
26. Stopelli E, Conen F, Morris CE, Herrmann E, Bukowiecki N, Alewell C. Ice nucleation active particles are efficiently removed by precipitating clouds. Scientific Reports. 2015; 5: 16433.https://doi.org/10. 1038/srep16433PMID:26553559
27. Fuzzi S, Mandrioli P, Perfetto A. Fog droplets—an atmospheric source of secondary biological aerosol particles. Atmospheric Environment. 1997; 31: 287–290.https://doi.org/10.1016/1352-2310(96) 00160-4
28. Sattler B, Puxbaum H, Psenner R. Bacterial growth in supercooled cloud droplets. Geophysical Research Letters. 2001; 28: 239–242.
29. Amato P, Parazols M, Sancelme M, Laj P, Mailhot G, Delort A-M. Microorganisms isolated from the water phase of tropospheric clouds at the Puy de Doˆme: major groups and growth abilities at low tem-peratures. FEMS Microbiology Ecology. 2007; 59: 242–254.https://doi.org/10.1111/j.1574-6941. 2006.00199.xPMID:17328765
30. Amato P, Me´nager M, Sancelme M, Laj P, Mailhot G, Delort A-M. Microbial population in cloud water at the Puy de Doˆme: Implications for the chemistry of clouds. Atmospheric Environment. 2005; 39: 4143–4153.https://doi.org/10.1016/j.atmosenv.2005.04.002
31. Hill KA, Shepson PB, Galbavy ES, Anastasio C, Kourtev PS, Konopka A, et al. Processing of atmo-spheric nitrogen by clouds above a forest environment. J Geophys Res. 2007; 112: D11301.https:// doi.org/10.1029/2006JD008002
32. Sˇ antl-Temkiv T, Finster K, Hansen BM, PasˇićL, Karlson UG. Viable methanotrophic bacteria enriched from air and rain can oxidize methane at cloud-like conditions. Aerobiologia. 2013; 1–12.
33. Vaïtilingom M, Deguillaume L, Vinatier V, Sancelme M, Amato P, Chaumerliac N, et al. Potential impact of microbial activity on the oxidant capacity and organic carbon budget in clouds. PNAS. 2013; 110: 559–564.https://doi.org/10.1073/pnas.1205743110PMID:23263871
34. Krumins V, Mainelis G, Kerkhof LJ, Fennell DE. Substrate-Dependent rRNA Production in an Airborne Bacterium. Environ Sci Technol Lett. 2014; 1: 376–381.https://doi.org/10.1021/ez500245y
35. Bowers RM, McLetchie S, Knight R, Fierer N. Spatial variability in airborne bacterial communities across land-use types and their relationship to the bacterial communities of potential source environ-ments. ISME J. 2011; 5: 601–612.https://doi.org/10.1038/ismej.2010.167PMID:21048802
36. Fahlgren C, Hagstro¨mÅ, Nilsson D, Zweifel UL. Annual Variations in the Diversity, Viability, and Origin of Airborne Bacteria. Appl Environ Microbiol. 2010; 76: 3015–3025.https://doi.org/10.1128/AEM. 02092-09PMID:20228096
37. Amato P, Parazols M, Sancelme M, Mailhot G, Laj P, Delort A-M. An important oceanic source of micro-organisms for cloud water at the Puy de Doˆme (France). Atmospheric Environment. 2007; 41: 8253–8263.https://doi.org/10.1016/j.atmosenv.2007.06.022
38. Dueker ME, O’Mullan GD, Weathers KC, Juhl AR, Uriarte M. Coupling of fog and marine microbial content in the near-shore coastal environment. Biogeosciences. 2012; 9: 803–813.https://doi.org/10. 5194/bg-9-803-2012
39. Amato P, Joly M, Schaupp C, Attard E, Mo¨hler O, Morris CE, et al. Survival and ice nucleation activity of bacteria as aerosols in a cloud simulation chamber. Atmos Chem Phys. 2015; 15: 6455–6465. https://doi.org/10.5194/acp-15-6455-2015
40. Vaïtilingom M, Attard E, Gaiani N, Sancelme M, Deguillaume L, Flossmann AI, et al. Long-term fea-tures of cloud microbiology at the puy de Doˆme (France). Atmospheric Environment. 2012; 56: 88– 100.https://doi.org/10.1016/j.atmosenv.2012.03.072
41. Marinoni A, Laj P, Sellegri K, Mailhot G. Cloud chemistry at the Puy de Doˆme: variability and relation-ships with environmental factors. Atmos Chem Phys. 2004; 4: 715–728. https://doi.org/10.5194/acp-4-715-2004
42. Draxler RR, Rolph GD. HYSPLIT (HYbrid Single-Particle Lagrangian Integrated Trajectory) Model access via NOAA ARL READY Website (http://ready.arl.noaa.gov/HYSPLIT.php). NOAA Air Resources Laboratory, Silver Spring, MD. 2013;
43. Caporaso JG, Lauber CL, Walters WA, Berg-Lyons D, Huntley J, Fierer N, et al. Ultra-high-throughput microbial community analysis on the Illumina HiSeq and MiSeq platforms. ISME J. 2012; 6: 1621– 1624.https://doi.org/10.1038/ismej.2012.8PMID:22402401
44. Gast RK, Mitchell BW, Holt PS. Detection of airborne Salmonella enteritidis in the environment of experimentally infected laying hens by an electrostatic sampling device. Avian Dis. 2004; 48: 148– 154.https://doi.org/10.1637/7086PMID:15077808
45. Kim M, Morrison M, Yu Z. Evaluation of different partial 16S rRNA gene sequence regions for phyloge-netic analysis of microbiomes. J Microbiol Methods. 2011; 84: 81–87.https://doi.org/10.1016/j.mimet. 2010.10.020PMID:21047533
46. Mangot J-F, Domaizon I, Taib N, Marouni N, Duffaud E, Bronner G, et al. Short-term dynamics of diversity patterns: evidence of continual reassembly within lacustrine small eukaryotes. Environ Micro-biol. 2013; 15: 1745–1758.https://doi.org/10.1111/1462-2920.12065PMID:23297806
47. Pruesse E, Quast C, Knittel K, Fuchs BM, Ludwig W, Peplies J, et al. SILVA: a comprehensive online resource for quality checked and aligned ribosomal RNA sequence data compatible with ARB. Nucleic Acids Res. 2007; 35: 7188–7196.https://doi.org/10.1093/nar/gkm864PMID:17947321
48. Price MN, Dehal PS, Arkin AP. FastTree 2 –Approximately Maximum-Likelihood Trees for Large Alignments. PLOS ONE. 2010; 5: e9490.https://doi.org/10.1371/journal.pone.0009490PMID: 20224823
49. Taib N, Mangot J-F, Domaizon I, Bronner G, Debroas D. Phylogenetic affiliation of SSU rRNA genes generated by massively parallel sequencing: new insights into the freshwater protist diversity. PLoS ONE. 2013; 8: e58950.https://doi.org/10.1371/journal.pone.0058950PMID:23516585
50. Taib N, Bronner G, Charvy JC, Mephu Nguifo E, Breton V, Debroas D. ePANAM: a web server dedi-cated to the analysis of next generation amplicons. Copenhaguen, Denmark; 2012.
51. McMurdie PJ, Holmes S. Waste Not, Want Not: Why Rarefying Microbiome Data Is Inadmissible. PLOS Computational Biology. 2014; 10: e1003531.https://doi.org/10.1371/journal.pcbi.1003531 PMID:24699258
52. R Core Team. R: A Language and Environment for Statistical Computing ( R Foundation for Statistical Computing, Vienna, Austria). Available at:http://wwwR-project.org. 2011;
53. McMurdie PJ, Holmes S. phyloseq: An R Package for Reproducible Interactive Analysis and Graphics of Microbiome Census Data. PLOS ONE. 2013; 8: e61217.https://doi.org/10.1371/journal.pone. 0061217PMID:23630581
54. Zeileis A, Kleiber C. ineq: Measuring Inequality, Concentration, and Poverty [Internet]. 2014. Avail-able:https://cran.r-project.org/web/packages/ineq/index.html
55. Wickham H. Ggplot2: Elegant Graphics for Data Analysis. 2nd ed. Springer Publishing Company, Incorporated; 2009.
56. Oksanen J, Blanchet FG, Friendly M, Kindt R, Legendre P, McGlinn D, et al. vegan: Community Ecol-ogy Package [Internet]. 2017. Available:https://cran.r-project.org/web/packages/vegan/index.html
57. Oliveros JC. Venny 2.1.0 [Internet]. 2015 2007 [cited 13 Mar 2017]. Available:http://bioinfogp.cnb. csic.es/tools/venny/
58. Deguillaume L, Charbouillot T, Joly M, Vaïtilingom M, Parazols M, Marinoni A, et al. Classification of clouds sampled at the puy de Doˆme (France) based on 10 yr of monitoring of their physicochemical properties. Atmos Chem Phys. 2014; 14: 1485–1506.https://doi.org/10.5194/acp-14-1485-2014
59. Fahlgren C, Bratbak G, Sandaa R-A, Thyrhaug R, Zweifel UL. Diversity of airborne bacteria in sam-ples collected using different devices for aerosol collection. Aerobiologia. 2010; 27: 107–120.https:// doi.org/10.1007/s10453-010-9181-z
60. Maron P-A, Lejon DPH, Carvalho E, Bizet K, Lemanceau P, Ranjard L, et al. Assessing genetic struc-ture and diversity of airborne bacterial communities by DNA fingerprinting and 16S rDNA clone library. Atmospheric Environment. 2005; 39: 3687–3695.https://doi.org/10.1016/j.atmosenv.2005.03.002
61. Wei M, Xu C, Chen J, Zhu C, Li J, Lv G. Characteristics of bacterial community in fog water at Mt. Tai: similarity and disparity under polluted and non-polluted fog episodes. Atmospheric Chemistry and Physics Discussions. 2016; 1–30.https://doi.org/10.5194/acp-2016-776
62. Xu C, Wei M, Chen J, Sui X, Zhu C, Li J, et al. Investigation of diverse bacteria in cloud water at Mt. Tai, China. Science of The Total Environment. 2017; 580: 258–265.https://doi.org/10.1016/j. scitotenv.2016.12.081PMID:28011017
63. Baldrian P, Kolařı´k M, Stursova´ M, Kopecky´ J, Vala´sˇkova´ V, Větrovsky´ T, et al. Active and total micro-bial communities in forest soil are largely different and highly stratified during decomposition. ISME J. 2012; 6: 248–258.https://doi.org/10.1038/ismej.2011.95PMID:21776033
64. Zhang Y, Zhao Z, Dai M, Jiao N, Herndl GJ. Drivers shaping the diversity and biogeography of total and active bacterial communities in the South China Sea. Mol Ecol. 2014; 23: 2260–2274.https://doi. org/10.1111/mec.12739PMID:24684298
65. Klein AM, Bohannan BJM, Jaffe DA, Levin DA, Green JL. Molecular Evidence for Metabolically Active Bacteria in the Atmosphere. Front Microbiol. 2016; 772.https://doi.org/10.3389/fmicb.2016.00772 PMID:27252689
66. Youssef NH, Elshahed MS. Species richness in soil bacterial communities: A proposed approach to overcome sample size bias. Journal of Microbiological Methods. 2008; 75: 86–91.https://doi.org/10. 1016/j.mimet.2008.05.009PMID:18585806
67. Kivlin SN, Hawkes CV. Temporal and Spatial Variation of Soil Bacteria Richness, Composition, and Function in a Neotropical Rainforest. PLOS ONE. 2016; 11: e0159131.https://doi.org/10.1371/ journal.pone.0159131PMID:27391450
68. Ahern HE, Walsh KA, Hill TCJ, Moffett BF. Fluorescent pseudomonads isolated from Hebridean cloud and rain water produce biosurfactants but do not cause ice nucleation. Biogeosciences. 2007; 4: 115– 124.
69. Zweifel UL, Hagstro¨mÅ, Holmfeldt K, Thyrhaug R, Geels C, Frohn LM, et al. High bacterial 16S rRNA gene diversity above the atmospheric boundary layer. Aerobiologia. 2012; 28: 481–498.https://doi. org/10.1007/s10453-012-9250-6
70. Kourtev PS, Hill KA, Shepson PB, Konopka A. Atmospheric cloud water contains a diverse bacterial community. Atmospheric Environment. 2011; 45: 5399–5405.https://doi.org/10.1016/j.atmosenv. 2011.06.041
71. Hughes JB, Hellmann JJ, Ricketts TH, Bohannan BJM. Counting the Uncountable: Statistical Approaches to Estimating Microbial Diversity. Appl Environ Microbiol. 2001; 67: 4399–4406.https:// doi.org/10.1128/AEM.67.10.4399-4406.2001PMID:11571135
72. O’Brien SL, Gibbons SM, Owens SM, Hampton-Marcell J, Johnston ER, Jastrow JD, et al. Spatial scale drives patterns in soil bacterial diversity. Environ Microbiol. 2016; 18: 2039–2051.https://doi.org/ 10.1111/1462-2920.13231PMID:26914164
73. Fro¨hlich-Nowoisky J, Burrows SM, Xie Z, Engling G, Solomon PA, Fraser MP, et al. Biogeography in the air: fungal diversity over land and oceans. Biogeosciences. 2012; 9: 1125–1136.https://doi.org/ 10.5194/bg-9-1125-2012
74. Cho BC, Jang GI. Active and diverse rainwater bacteria collected at an inland site in spring and sum-mer 2011. Atmospheric Environment. 2014; 94: 409–416.https://doi.org/10.1016/j.atmosenv.2014. 05.048
75. Wittebolle L, Marzorati M, Clement L, Balloi A, Daffonchio D, Heylen K, et al. Initial community even-ness favours functionality under selective stress. Nature. 2009; 458: 623–626.https://doi.org/10.1038/ nature07840PMID:19270679
76. Aller JY, Kuznetsova MR, Jahns CJ, Kemp PF. The sea surface microlayer as a source of viral and bacterial enrichment in marine aerosols. Journal of Aerosol Science. 2005; 36: 801–812.https://doi. org/10.1016/j.jaerosci.2004.10.012
77. Burrows SM, Elbert W, Lawrence MG, Po¨schl U. Bacteria in the global atmosphere–Part 1: Review and synthesis of literature data for different ecosystems. Atmos Chem Phys. 2009; 9: 9263–9280. https://doi.org/10.5194/acp-9-9263-2009
78. Huffman JA, Po¨hlker C, Prenni AJ, DeMott PJ, Mason RH, Robinson NH, et al. High concentrations of biological aerosol particles and ice nuclei during and after rain. Atmospheric Chemistry and Physics Discussions. 2013; 13: 1767–1793.https://doi.org/10.5194/acpd-13-1767-2013
79. Joung YS, Ge Z, Buie CR. Bioaerosol generation by raindrops on soil. Nature Communications. 2017; 8: 14668.https://doi.org/10.1038/ncomms14668PMID:28267145
80. Copeland JK, Yuan L, Layeghifard M, Wang PW, Guttman DS. Seasonal Community Succession of the Phyllosphere Microbiome. MPMI. 2015; 28: 274–285. https://doi.org/10.1094/MPMI-10-14-0331-FIPMID:25679538