HAL Id: hal-00297950
https://hal.archives-ouvertes.fr/hal-00297950
Submitted on 30 Nov 2007HAL is a multi-disciplinary open access
archive for the deposit and dissemination of sci-entific research documents, whether they are pub-lished or not. The documents may come from teaching and research institutions in France or abroad, or from public or private research centers.
L’archive ouverte pluridisciplinaire HAL, est destinée au dépôt et à la diffusion de documents scientifiques de niveau recherche, publiés ou non, émanant des établissements d’enseignement et de recherche français ou étrangers, des laboratoires publics ou privés.
Build-up and decline of organic matter during PeECE
III
K. G. Schulz, U. Riebesell, R. G. J. Bellerby, H. Biswas, M. Meyerhöfer, M. N.
Müller, J. K. Egge, J. C. Nejstgaard, C. Neill, J. Wohlers, et al.
To cite this version:
K. G. Schulz, U. Riebesell, R. G. J. Bellerby, H. Biswas, M. Meyerhöfer, et al.. Build-up and decline of organic matter during PeECE III. Biogeosciences Discussions, European Geosciences Union, 2007, 4 (6), pp.4539-4570. �hal-00297950�
BGD
4, 4539–4570, 2007
Build-up and decline of organic matter
during PeECE III K. Schulz et al. Title Page Abstract Introduction Conclusions References Tables Figures ◭ ◮ ◭ ◮ Back Close Full Screen / Esc
Printer-friendly Version Interactive Discussion
EGU Biogeosciences Discuss., 4, 4539–4570, 2007
www.biogeosciences-discuss.net/4/4539/2007/ © Author(s) 2007. This work is licensed
under a Creative Commons License.
Biogeosciences Discussions
Biogeosciences Discussions is the access reviewed discussion forum of Biogeosciences
Build-up and decline of organic matter
during PeECE III
K. G. Schulz1, U. Riebesell1, R. G. J. Bellerby2,3, H. Biswas1, M. Meyerh ¨ofer1, M. N. M ¨uller1, J. K. Egge4, J. C. Nejstgaard4, C. Neill2, J. Wohlers1, and E. Z ¨ollner1
1
Leibniz Institute for Marine Sciences (IFM-GEOMAR), D ¨usternbrooker Weg 20, 24105 Kiel, Germany
2
Bjerknes Centre for Climate Research, Univ. of Bergen, All ´egaten 55, 5007 Bergen, Norway
3
Geophysical Institute, Univ. of Bergen, All ´egaten 70, 5007 Bergen, Norway
4
University of Bergen, Department of Biology, Box 7800, 5020 Bergen, Norway
Received: 13 November 2007 – Accepted: 13 November 2007 – Published: 30 November 2007
BGD
4, 4539–4570, 2007
Build-up and decline of organic matter
during PeECE III K. Schulz et al. Title Page Abstract Introduction Conclusions References Tables Figures ◭ ◮ ◭ ◮ Back Close Full Screen / Esc
Printer-friendly Version Interactive Discussion
Abstract
Increasing atmospheric carbon dioxide (CO2) concentrations due to anthropogenic
fos-sil fuel combustion currently change the ocean’s chemistry. Increasing oceanic [CO2]
and subsequent decreasing seawater pH have the potential to significantly impact ma-rine life. Here we describe and analyze the build-up and decline of a natural
phyto-5
plankton bloom initiated during the 2005 mesocosm Pelagic Ecosystem CO2
Enrich-ment study (PeECE III). We show that processes of inorganic carbon uptake in mixed surface waters and organic carbon export to depth were significantly enhanced at el-evated CO2, while ammonium regeneration in deep waters was substantially reduced.
This has important implications for our understanding of pelagic ecosystem functioning
10
and future carbon cycling.
1 Introduction
Human activities such as the massive combustion of fossil fuels perturb the natural carbon cycle by increasing atmospheric carbon dioxide [CO2] concentrations. Since
the beginning of the industrial revolution atmospheric CO2 levels have increased al-15
ready from about 280 to 380 µatm, in the year 2006 and are projected to reach val-ues as high as 700 µatm, by the end of the 21. century (IPCC,2001). Together with changes in other climate relevant gases this substantial increase in atmospheric CO2
drives global climate change: increasing global mean temperatures, rising sea level and accelerating extreme weather incidences, to name just those events most likely
20
to happen (IPCC,2007). As a result of atmosphere-ocean gas exchange increasing atmospheric CO2levels are accompanied by concomitant increases of [CO2] in ocean
surface waters. This leads to a redistribution in the oceanic dissolved inorganic carbon (DIC) pool, resulting in increased ocean acidity on one hand and reduced carbonate saturation state on the other. This is manifested in decreasing ocean pH which is very
25
BGD
4, 4539–4570, 2007
Build-up and decline of organic matter
during PeECE III K. Schulz et al. Title Page Abstract Introduction Conclusions References Tables Figures ◭ ◮ ◭ ◮ Back Close Full Screen / Esc
Printer-friendly Version Interactive Discussion
EGU already observed since the beginning of the industrial revolution (Caldeira and Wicket,
2003).
Most of the marine organisms studied so far are known to be sensitive in some way or the other to changes in ocean chemistry (for a review see Riebesell (2005)). Marine biogenic calcification (CaCO3 formation), for instance, by warm water corals, 5
coccolithophores and foraminifera has been shown to decrease with increasing pH and hence decreasing carbonate saturation (Gattuso et al.,1998;Kleypas et al.,1999; Riebesell et al.,2000;Russel et al.,2004). Although the response of biogenic CaCO3
production to changing ocean chemistry may differ between species (Langer et al., 2006) and is far from being understood, if carbonate saturation drops below unity the
10
calcareous shells of these organisms begin to dissolve. This will probably happen towards the end of the 21. century to another important group of pelagic calfifiers, the pteropods. Their natural habitats, the Southern Ocean and the subarctic Pacific, will become undersaturated with respect to their CaCO3 (aragonite) shells at increasing CO2 levels (Orr et al., 2005). Marine phytoplankton has also been shown to change 15
their elemental composition (C/N/P) in response to changing [CO2] (Burkhardt and
Riebesell, 1997; Burkhardt et al., 1999b). But again, these changes were species-specific, sometimes even with opposite sign. Furthermore, increases in C/N can be the result of increased production of transparent exopolymer particles, TEP, (Engel , 2002) which are believed to be important for the export of particulate organic matter
20
from the sunlit surface ocean to its interior (Engel et al.,2004). Whether carbon and nitrogen remineralization rates at depth could be effected by varying C/N is another open question. Thus, increasing atmospheric and surface ocean CO2 levels have the potential to change marine element cycling which could trigger important feedback responses in Earth’s climate system.
25
While laboratory studies provide process based understanding at the organismal level mesocosms are ideal for perturbation experiments at the community level. How-ever, a solid experimental design and setup are crucial for subsequent data interpreta-tion. Here we describe the mesocosm setup and performance as well as the temporal
BGD
4, 4539–4570, 2007
Build-up and decline of organic matter
during PeECE III K. Schulz et al. Title Page Abstract Introduction Conclusions References Tables Figures ◭ ◮ ◭ ◮ Back Close Full Screen / Esc
Printer-friendly Version Interactive Discussion development of the phytoplankton bloom in terms of build-up of particulate and
dis-solved organic matter and changes in respective carbon to nitrogen to phosphorus ratios for the 2005 Pelagic Ecosystem CO2Enrichment study (PeECE III).
2 Methods
2.1 Mesocosm setup and sampling
5
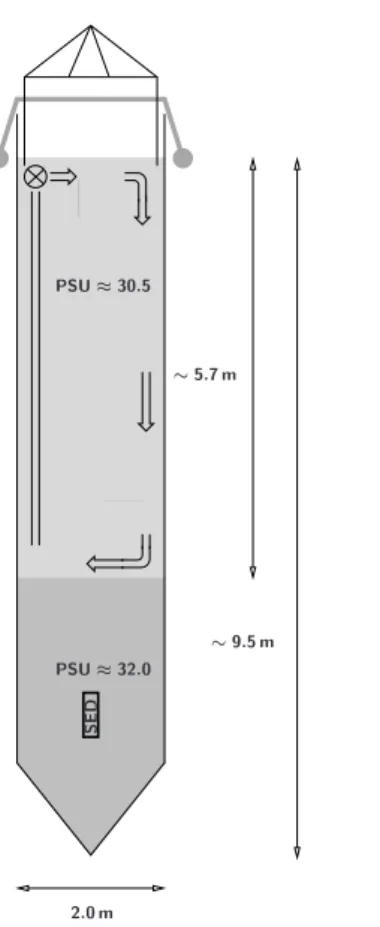
In May 2005, in the Raunefjorden at the coastline of Norway (∼60◦16′′N, 5◦13′′E) nine polyethylene bags (see Fig. 1 for a graphical representation), 2 m in diameter and extending about 9.5 m into depth, were deployed at a free floating raft, operated by the University of Bergen. The bags were filled simultaneously with unfiltered nutrient-poor fjord water, about 27 m3each, pumped from 13.5 m depth. Three different CO2levels 10
∼350 (mesocosms M1–M3), 700 (mesocosms M4–M6) and 1050 µatm (mesocosms M7–M9), termed hereafter 1x, 2x and 3x CO2, representing present day CO2conditions and those predicted for the year 2100 and 2150, respectively (IPCC,2001), were set up in triplicate following in principle the approach described inEngel et al.(2005).
Briefly, the enclosed fjord water was aerated at target CO2levels for about two days 15
until equilibration was reached. Then, about 0.8 m3of freshwater were mixed into the upper 5.5 m by aquarium water pumps (flow rate ∼450 l h−1), creating a halocline with a salinity gradient of ∼1.5 psu at about 5.7 m depth (see Fig. 1). The location and stability of the halocline, separating upper mixed surface from deep waters, was moni-tored daily by means of a CTD (SAIV A/S, model SD204), providing combined vertical
20
distributions of salinity and temperature within the mesocosms (see Figs. 2 and 3, respectively). The operation of the aquarium water pumps within the upper surface waters throughout the experiment ensured the homogeneous distribution of dissolved compounds. The mesocosm bags were covered with gas tight tents (ETFE foil) which allowed for the transmission of about 95% of the complete sunlight spectrum. Incident
25
contin-BGD
4, 4539–4570, 2007
Build-up and decline of organic matter
during PeECE III K. Schulz et al. Title Page Abstract Introduction Conclusions References Tables Figures ◭ ◮ ◭ ◮ Back Close Full Screen / Esc
Printer-friendly Version Interactive Discussion
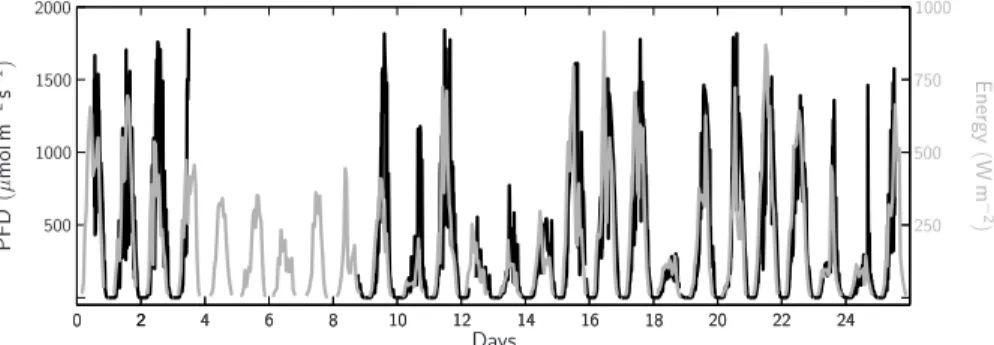
EGU uously (15 min averages) with a Licor light sensor (LI-190) connected to a datalogger
(LI-1400) mounted on the raft (see Fig. 4). On some days this photon flux density (PFD) was also measured within the headspace and at 2.5 m depth of mesocosm M8. The headspace within the tents was continuously flushed with air at target CO2values
throughout the experiment, simulating a 1x, 2x and 3x CO2atmosphere.
5
The phytoplankton bloom was initiated on day t−1 by additions of nitrate and
phos-phate to upper surface waters aiming for final surface water concentrations of 16 and 0.8 µmol kg−1, respectively (see Fig. 5a, b). However, in mesocosms 1,2,3 and 4 these concentrations were lower than expected as some of the nutrients added must have been lost to deep waters during mixing. Therefore, additional nitrate and phosphate
10
was added to these mesocosms on day t1, establishing uniform nutrient concentra-tions within all mesocosms on day 2 (see Fig. 5). As pCO2 in mesocosms 1–6 were
below intended values, NaHCO3 and equimolar amounts of HCl were added,
reach-ing final concentrations of ∼25 and ∼18 µmol kg−1 in mesocosms 1–3 and 4–6, re-spectively. Regarding the changes in the CO2system this procedure is equivalent to 15
CO2 aeration and increased pCO2in mesocosms 1–6 to desired values of ∼700 and
∼1050 µatm on day 2 (see Fig. 6).
Daily sampling was at 10:00 a.m. starting on day t0. Dissolved and particulate
com-ponents (with the exception of DIC, alkalinity, pCO2, and other gases) were sampled
with a 5 m long, 6 cm diameter tube lowered into the mesocosms, providing a
depth-20
integrated sample. The samples representative for upper surface waters (∼20 L per mesocosm per day) were brought back to shore where sub-samples for various mea-surements and analyzes were taken immediately upon arrival. Every other day water from sediment traps, 60×10 cm Plexiglas cylinders deployed in each mesocosm at 7.5 m depth, was also collected.
25
2.2 Measurements and analyzes
In principle all measurements and analyzes of parameters presented in this article fol-lowed standard procedures. A complete list of all parameters measured together with
BGD
4, 4539–4570, 2007
Build-up and decline of organic matter
during PeECE III K. Schulz et al. Title Page Abstract Introduction Conclusions References Tables Figures ◭ ◮ ◭ ◮ Back Close Full Screen / Esc
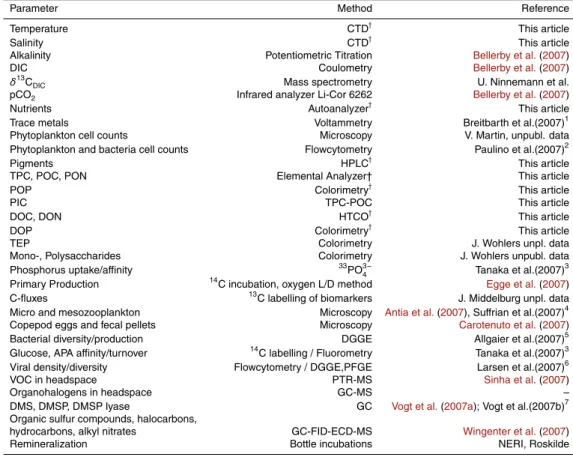
Printer-friendly Version Interactive Discussion their individual methods is given in Table 1. For details on measurement methods of
pa-rameters not presented in this article the reader is referred to the respective reference given in Table 1.
The nutrients nitrate, nitrite and phosphate were determined from GF/F filtered, sili-cate from 3 µm cellulose acetate filtered sample water and measured with an
autoan-5
alyzer (AA II) according toHansen and Koroleff (1999). Ammonium was determined following the approach described inHolmes et al.(1999).
For phytoplankton pigment analysis 250–500 ml of sample water were filtered onto GF/F filters which were frozen at −20◦C until extraction and analysis. For extraction fil-ters were homogenized together with 2 and 4 mm glass beads in 2 ml 100% acetone by
10
a cooled Vibrogen cell mill for 5 min. Then the samples were centrifuged at ∼3000 x g and −10◦C for 10 min. The supernatant was 0.2 µm filtered and analyzed by rp-HPLC (reverse-phase high performance liquid chromatography) where pigments are identi-fied by comparing retention times and absorption spectra, obtained with a diode array spectrophotometer (WATERS), with those of pigment standards. Commercially
avail-15
able pigments were also used as standards for calibration. All sample handling during the extraction and analysis procedures were carried out under dimmed light conditions to prevent pigment photo-oxidation. Calculation of the phytoplankton community com-position and individual phytoplankton Chla contributions (see Fig. 7) was carried out with the program CHEMTAX (Mackey et al.,1996).
20
For determination of the particulate compounds TPC (total particulate carbon), POC (particulate organic carbon), PIC (particulate inorganic carbon), PON (particulate or-ganic nitrogen), POP (particulate oror-ganic phosphorus) 250–500 ml of sample water were filtered onto precombusted (450◦C for 5 h) GF/F filters and stored at −20◦C. TPC, POC, and PON were determined on an EuroVector elemental analyzer (EuroEA 3000).
25
Before analysis all filters were dried for 6 h at 60◦C, while POC filters had been fumed overnight with concentrated HCl to remove PIC. Particulate inorganic carbon was then calculated as the difference between TPC and POC (see Fig. 8). POP was oxidized by potassium persulphate to dissolved inorganic phosphorus which was measured as
BGD
4, 4539–4570, 2007
Build-up and decline of organic matter
during PeECE III K. Schulz et al. Title Page Abstract Introduction Conclusions References Tables Figures ◭ ◮ ◭ ◮ Back Close Full Screen / Esc
Printer-friendly Version Interactive Discussion
EGU described byHansen and Koroleff(1999). Every other day these measurements were
also performed on 200–250 ml sub-samples collected from all nine sediment traps. Determination of the dissolved compounds DOC (dissolved organic carbon), DON (dissolved organic nitrogen) and DOP (dissolved organic phosphorus) was on GF/F filtered fjord water samples. DOC and DON were analyzed by means of high
tem-5
perature catalytic oxidation (HTCO) as described in Qian and Mopper (1996), DOP by potassium persulphate oxidation and subsequent dissolved inorganic phosphorus determination described inHansen and Koroleff(1999) (see Fig. 8).
3 Results
3.1 Mesocosm performance
10
Unlike in a previous mesocosm CO2perturbation experiment (Engel et al.,2005), deep
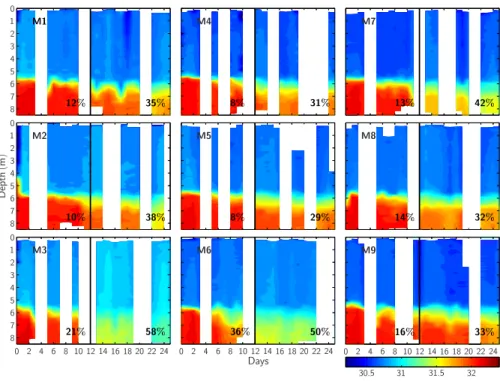
water was separated from the upper mixed surface by establishing a halocline. This allowed particulate organic matter produced in the nutrient-enriched surface waters to settle into depth, simulating export production. Detailed monitoring of the location and stability of the halocline showed that until day t12 deep water loss (mixing of deep 15
waters into the surface waters and deepening of the halocline) was only moderate (∼8– 21%) in most mesocosms, with the exception of mesocosm M6 (∼36%). Unusually stormy weather conditions around day t12, however, enhanced deep water mixing,
and until the end of the experiment a substantial portion of the deep water was lost in all mesocosms (∼29–42%) with up to 58% and 50% in mesocosms M3 and M6,
20
respectively (Fig. 2).
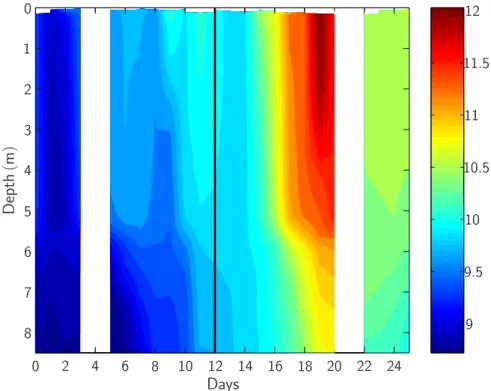
Temperatures within the mesocosms, initially evenly distributed throughout depth at about 9◦C, increased to ∼11.5◦C in upper surface and ∼11◦C in deep waters until day
t19 (Fig. 3). Towards the end of the experiment on day t25 temperatures were again
distributed homogeneously, although slightly decreased, at about 10.5◦C.
25
BGD
4, 4539–4570, 2007
Build-up and decline of organic matter
during PeECE III K. Schulz et al. Title Page Abstract Introduction Conclusions References Tables Figures ◭ ◮ ◭ ◮ Back Close Full Screen / Esc
Printer-friendly Version Interactive Discussion 90 and 560 µmol m−2s−1. These fluctuations corresponded well with those measured
in solar radiation at the University of Bergen (Fig. 4). About 80% of incident PAR passed through the gas tight tents into the mesocosms’ headspace of which up to 15% penetrated into ∼2.5 m depth, the center of the mixed surface layer (data not shown).
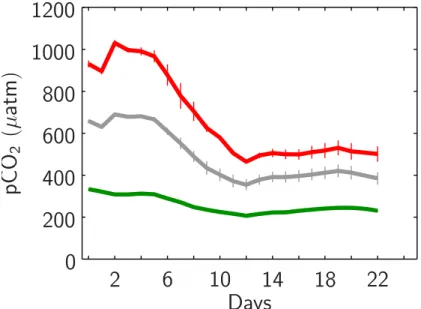
Having established desired pCO2 values within the mesocosms’ surface waters of 5
∼350, 700 and 1050 µatm at day t2, CO2partial pressure continuously decreased until day t12to ∼200, 350 and 460 µatm in the 1x, 2x and 3x mesocosms, respectively. After
a slight increase on day t13and t14pCO2remained rather constant until the end of the
experiment (Fig. 6).
All sediment traps, sampled every other day, showed significant over-trapping. In
10
other words more particulate material was calculated to be exported into the deep than inorganic nutrients removed from surface waters. This was probably caused by contin-uous flapping of the mesocosm bags mainly forced by wind stress which extended into depth and resuspension of sedimented particulate matter. Hence, rather than absolute concentrations only element ratios (POC/PON, POC/POP and PON/POP) are reported
15
in this study (Fig. 11).
3.2 Inorganic nutrient uptake and organic material build-up
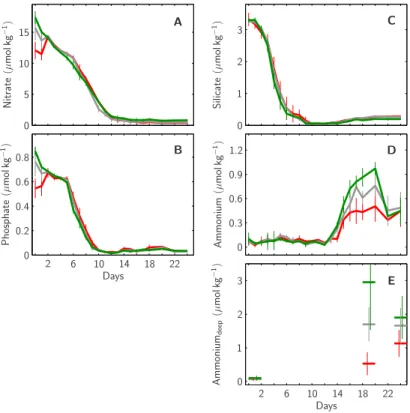
Following the addition of nitrate and phosphate on day t−1and their adjustment on day t1to 15 and 0.7 µmol kg−1 in all mesocosms, respectively, inorganic nutrients (nitrate, phosphate and silicate) continuously decreased (Fig. 5). In all mesocosms silicate was
20
the first to get depleted about day t7 (Fig. 5c), followed by phosphate about day t10
(Fig. 5b) and nitrate about day t13 (Fig. 5a). From their day of depletion onwards all
inorganic nutrient concentrations remained comparatively low. An exception were am-monium concentrations which were close to zero until day t12and increased up to ∼0.5,
0.75 and 0.9 µmol kg−1until day t20in the 1x, 2x and 3x CO2mesocosms, respectively 25
(Fig. 5d). Corresponding deep water values also increased to up to 3 µmol kg−1 to-wards the end of the experiment, with apparently higher values in 3x than in 2x and 2x
BGD
4, 4539–4570, 2007
Build-up and decline of organic matter
during PeECE III K. Schulz et al. Title Page Abstract Introduction Conclusions References Tables Figures ◭ ◮ ◭ ◮ Back Close Full Screen / Esc
Printer-friendly Version Interactive Discussion
EGU than 1x CO2mesocosms (Fig. 5e).
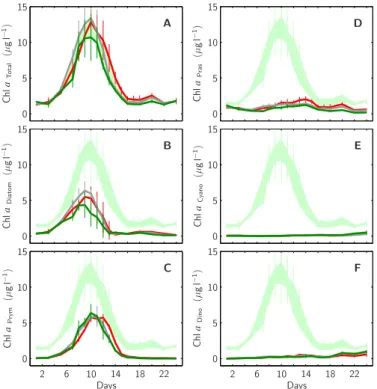
The draw-down in inorganic nutrients was reflected by a concomitant build-up of or-ganic matter. Total Chla concentrations increased from about 1.5µg l−1 on day t0 to
∼11.0, 13.5 and 13.0 µg l−1on day t10 in the 1x, 2x and 3x CO2mesocosms, respec-tively (Fig. 7a). From then on Chla continuously decreased in all mesocosms, reaching
5
again starting concentrations around day t16. Separating total Chla concentrations into
individual contributions by selected phytoplankton taxa showed that diatoms (mostly
Skeletonema sp. and Nitzschia sp.) and prymnesiophytes (including Emiliania huxleyi)
were of major importance, both reaching up to ∼5 µg l−1in all mesocosms. However, diatom associated Chla peaked about day t9while that of prymnesiophytes coincided
10
with the total Chla maximum on day t10 (Fig. 7b, c). During and after the decline of
the phytoplankton bloom, from day t10 onwards, prasinophyte, cyanobacteria and
di-noflagellate Chla concentrations were slightly increasing in all mesocosms (Fig. 7d, e, f).
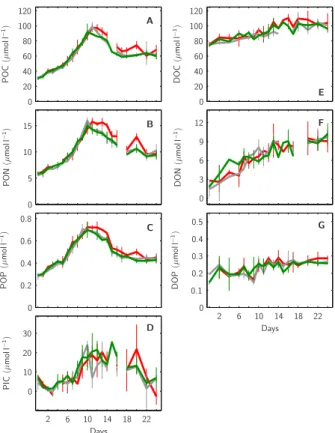
The build-up of particulate organic carbon, nitrogen and phosphorus was very
simi-15
lar to that of Chla with maximum values reached between days t10–t12. However POC, PON and POP concentrations did not decrease to starting values after the decline of the bloom. During the first 10 to 12 days, until the peak of the bloom, about 60– 65 µmol l−1of POC, 9–10 µmol l−1of PON and 0.4 µmol l−1of POP accumulated in the upper 5.7 m of all mesocosms of which about 30–35 µmol l−1of POC, 3.5–4.5 µmol l−1
20
of PON and 0.15 µmol l−1 of POP remained until the end of the experiment (Fig. 8a, b, c). Due to CaCO3 production of coccolithophores during the phytoplankton bloom
(compare Fig. 8c), also about 15 µmol l−1 of PIC was built-up until the peak of the bloom, however almost all CaCO3 produced was lost from the upper mixed layer
to-wards the end of the experiment (Fig. 8d). On the other hand, concentrations of all
25
dissolved organic compounds increased steadily from day t0 to day t24 in all
meso-cosms, DOC from about 75 to 100 µmol l−1, DON from about 2.5 to 9.5 µmol l−1 and DOP from about 0.2 to 0.25 µmol l−1(Fig. 8e, f, g).
BGD
4, 4539–4570, 2007
Build-up and decline of organic matter
during PeECE III K. Schulz et al. Title Page Abstract Introduction Conclusions References Tables Figures ◭ ◮ ◭ ◮ Back Close Full Screen / Esc
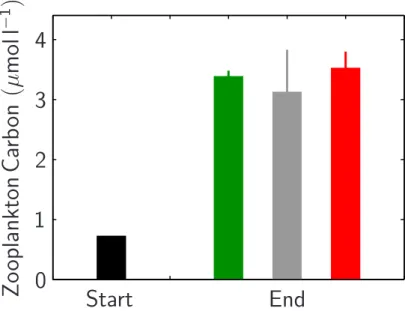
Printer-friendly Version Interactive Discussion of about 0.7 µmol carbon per liter at the beginning of the experiment to about 3.1–
3.5 µmol l−1towards the end (Fig. 9).
3.3 Element ratios of particulate and dissolved organic matter
Individual build-up and removal of both, particulate and dissolved organic matter in the mixed surface waters lead to specific temporal variations in the respective
ele-5
ment ratios. The ratio of carbon to nitrogen to phosphorus of particulate matter ac-cumulating in the upper 5.7 m of all mesocosms was close to Redfield with 106/16/1 (POC/PON/POP) until about day t9. From then on only POC/PON remained close to
6.625 while POC/POP and PON/POP increased about 2-fold to values of ∼200 and 30, respectively (Fig. 10a, b, c). This can be the result of preferential POP removal from
10
the upper surface waters. The individual element ratios of the dissolved organic matter build-up during the experiment, however, did not seem to change with time but sig-nificantly deviated from Redfield in all mesocosms. DOC/DON was relatively low with about 3, while DOC/DOP and DON/DOP were relatively high with values around 300 and 100, respectively (Fig. 10d, e, f). About 2x lower DOC/DON, 3x higher DOC/DOP
15
and 5x higher DON/DOP in comparison to the corresponding Redfield ratios can be the result of either relatively higher DOP than DOC than DON removal or relatively lower DOP than DOC than DON build-up within the upper surface waters.
The ratios of carbon to nitrogen to phosphorus of the particulate organic material collected in the sediment traps reflect processes of accumulation and remineralization.
20
In all mesocosms sedimentary POC/PON was close to Redfield ratios throughout the experiment (Fig. 11) as were the corresponding values in the upper surface waters (compare Fig. 10a, b, c). Sedimentary POC/POP and PON/POP increased after about 14 days to higher ratios, however, apparently higher in the 3x than 2x than 1x CO2 mesocosms.
BGD
4, 4539–4570, 2007
Build-up and decline of organic matter
during PeECE III K. Schulz et al. Title Page Abstract Introduction Conclusions References Tables Figures ◭ ◮ ◭ ◮ Back Close Full Screen / Esc
Printer-friendly Version Interactive Discussion
EGU
4 Discussion
4.1 Mesocosm performance
The 2005 PeECE III mesocosm experiment differs in several aspects but one substan-tial from many previous studies, the establishment of a halocline. This was thought to create two distinct water masses in which pelagic key processes such as primary
pro-5
duction (surface waters) and remineralization (deep waters) are separated. Any water exchange between these two realms can make data interpretation difficult as most ef-forts were directed towards sampling in the upper surface waters. Hence, the stability and location of the halocline was monitored on a daily basis. However, even without the storm event on day t12, substantial deep water mixing into the upper surface would 10
have occured. This could have been caused by wind force acting on the mesocosm bags being transmitted into depth. This would also explain the observed over-trapping of the sediment traps caused by significant resuspension of settled particulate organic matter. Complete element budgets and process assessment of primary production and remineralization therefore require sampling in both water masses. Sedimentation
pro-15
cesses on the other hand appear to be difficult to evaluate with this kind of mesocosm setup.
4.2 Inorganic nutrient uptake and organic material build-up
The draw-down of the major nutrients nitrate, phosphate and silicate during the bloom phase of the experiment followed the same temporal pattern in all mesocosms,
irre-20
spective of pCO2 (for details see Bellerby et al., 2007). The concomitant build-up of
organic material, reflected by increasing Chla concentrations showed also no treatment effect, although at the peak of the bloom total and diatom associated Chla concentra-tions were seemingly higher in the 2x and 3x compared to the 1x CO2mesocosms. The
build-up of particulate organic matter (POC, PON, POP), however, appeared slightly
25
BGD
4, 4539–4570, 2007
Build-up and decline of organic matter
during PeECE III K. Schulz et al. Title Page Abstract Introduction Conclusions References Tables Figures ◭ ◮ ◭ ◮ Back Close Full Screen / Esc
Printer-friendly Version Interactive Discussion in dissolved organic material (DOC, DON, DOP) on the other hand, was again not
significantly different between CO2 treatments. Also the build-up of metazooplankton
(>90 µm) biomass was not significantly different between treatments. In summary, the temporal development of nutrient uptake, build-up and decline of particulate organic matter and increase of dissolved organic matter during the experiment followed the
5
same patterns in all mesocosms, irrespective of CO2condition (compareEngel et al.,
2005). The similarity of nutrient uptake and corresponding organic matter build-up between treatments could be caused by phytoplankton nutrient utilization (nitrate and phosphate) and division rates which are insensitive to changes in seawater pCO2.
In-deed, although there is a critical CO2concentration for all phytoplankton species below
10
which their growth decreases, in the CO2range of the present study (350–1050 µatm) division rates of diatoms, coccolithophores and cyanobacteria have been found to be rather constant (Burkhardt et al.,1999a;Rost et al.,2002;Langer et al.,2006; Barce-los e Ramos et al.,2007). Changes in phytoplankton C/N and C/P stoichiometry due to variations of seawater pCO2would then have to explained by changes in inorganic 15
carbon utilization (see below).
Another interesting finding is that deep water ammonium concentrations towards the end of the experiment increased to lower values in the 3x than in the 2x and than in the 1x CO2mesocosms (corresponding surface layer values show the same trend and
in-creased from day t12onwards due to deep water mixing). This can be explained by
dif-20
ferences in remineralization rates of organic nitrogen compounds at depth. Ammonium regeneration in sediments appears to be oxygen dependent with steadily decreasing rates at decreasing oxygen concentrationsChapelle(1995);Serpa et al. (2007). But what could be the mechanisms responsible for reduced deep water oxygen concentra-tions at elevated CO2? Although standing stocks of dissolved and particulate organic 25
carbon in the upper surface waters were quite similar in all mesocosms, significantly more dissolved inorganic carbon was utilized in the 3x than in the 2x and than in the 1x CO2mesocosms (for details seeRiebesell et al.(2007) andBellerby et al.,2007).
wa-BGD
4, 4539–4570, 2007
Build-up and decline of organic matter
during PeECE III K. Schulz et al. Title Page Abstract Introduction Conclusions References Tables Figures ◭ ◮ ◭ ◮ Back Close Full Screen / Esc
Printer-friendly Version Interactive Discussion
EGU ters, about twice as much in the 3x compared to the 1x CO2mesocosms. The process
operating could be enhanced TEP formation which has been shown to be higher at ele-vated CO2(Engel,2002), leading to intensified particle coagulation and hence organic
carbon export from the surface to depth. Intensified organic carbon sedimentation at higher CO2levels could have fueled organic carbon remineralization by heterotrophic 5
bacteria, leading to stronger oxygen reduction at depth in the 3x than in the 2x and than in the 1x CO2mesocosms. If only half of the additional organic carbon exported in the 3x CO2mesocosms would have been remineralized in the lower 1.5 m of of the
mesocosms, oxygen would have been considerably stronger depleted at depth in com-parison to the 2x and 1x CO2 mesocosms, by about 100 µmol kg−1 at the end of the
10
experiment. This could explain reduced ammonia regeneration at elevated CO2. 4.3 Element ratios of particulate and dissolved organic matter
While in the surface layer element ratios of particulate and dissolved organic matter reflect processes of production and removal, corresponding ratios in the deep water of the mesocosms are indicative for processes of accumulation and remineralization.
15
Until day t9 element ratios of particulate organic matter were close to corresponding
Redfield ratios. As from then on inorganic phosphorus was depleted while nitrate and dissolved inorganic carbon could still be assimilated, POC/POP and PON/POP steadily increased. The same trend was found for dissolved organic matter, although due to relatively high standard deviations statistically not significant. Interestingly, however,
20
DOC/DON was considerably lower than the Redfield ratio , indicating preferential loss of dissolved organic carbon compared to dissolved organic nitrogen in all mesocosms. This can be the result of TEP formation, favoring preferential DOC export from the surface waters to depth (compare Sect. 5.2). In this context it is also important to note that the loss of organic matter from the surface, defined as the difference between
25
organic matter build-up and the inorganic counterparts drawn-down, seems to be a process in operation right from the start of the experiment (data not shown but compare Riebesell et al.,2007).
BGD
4, 4539–4570, 2007
Build-up and decline of organic matter
during PeECE III K. Schulz et al. Title Page Abstract Introduction Conclusions References Tables Figures ◭ ◮ ◭ ◮ Back Close Full Screen / Esc
Printer-friendly Version Interactive Discussion Balancing the processes of accumulation and remineralization at depth is difficult
because of the problems associated with sediment trap sampling and the lack of dis-solved organic matter data in deep waters. However, the scenario described above of 1) increased loss of organic carbon from surface waters to depth at elevated CO2,
resulting in 2) increased respiration of this organic carbon and hence increased oxygen
5
consumption at depth, and hence in 3) reduced organic nitrogen remineralization (am-monium regeneration) is not at odds with the observed patterns in sedimentary organic matter ratios. Constant sedimentary POC/PON, for instance, could indicate increased organic carbon remineralization at elevated CO2. Furthermore, increased sedimentary
PON/POP in the 3x and 2x in comparison to the 1x CO2 mesocosms could be the 10
result of decreased PON remineralization.
4.4 The pelagic ocean in a high CO2world: indications from mesocosm studies
Bulk parameters of natural phytoplankton blooms, especially those representative for biomass such as POC, PON, POP, Chla, but also DOC, DON and DOP appear to a great extent insensitive to changing CO2conditions (compareEngel et al.,2005). Also
15
corresponding elemental ratios of these standing stocks appear largely unaffected by seawater pCO2. However, in this study there were pronounced treatment differences
in the calculated amount of organic carbon lost from upper surface waters, with higher values in the 3x compared to the 2x and 1x CO2mesocosms (compareRiebesell et al.,
2007). This was fueled by significantly increased dissolved inorganic carbon (DIC) to
20
inorganic nutrient (nitrate, phosphate) uptake ratios at elevated CO2(compareBellerby et al.,2007). Hence, elemental ratios of organic matter exported from surface to depth must have been enriched in organic carbon compared to nitrogen and phosphorus under elevated CO2 conditions. Furthermore, this “extra” organic carbon could have resulted in higher bacterial respiration and oxygen consumption at depth, reducing
25
ammonium regeneration in the 3x compared to the 2x and to the 1x CO2mesocosms.
In summary, mesocosm studies have identified various processes in pelagic ecosys-tems potentially sensitive to increasing atmospheric CO (for details see Riebesell
BGD
4, 4539–4570, 2007
Build-up and decline of organic matter
during PeECE III K. Schulz et al. Title Page Abstract Introduction Conclusions References Tables Figures ◭ ◮ ◭ ◮ Back Close Full Screen / Esc
Printer-friendly Version Interactive Discussion
EGU et al., 20071): 1) higher inorganic carbon consumption in the euphotic zone, 2) higher
export production, 3) reduced ammonium regeneration at depth, 4) increases in climate relevant trace gas production (Wingenter et al.,2007), 5) reduced CaCO3 production by coccolithophores such as Emiliania huxleyi (Delille et al.,2005) and 6) diminished growth and survival rates of calcifying molluscs (Antia et al.,2007). All these processes
5
are part of feedback mechanisms impacting CO2partitioning between atmosphere and ocean. However, whether changes in these processes will dampen or enhance global climate change is still impossible to forecast.
Acknowledgements. We greatfully acknowledge the staff of the Espegrend Marine Biological Station, University Bergen, in particular T. Sørlie and A. Aadnesen, and the Bergen Marine
10
Research infrastructure (RI) for helping organize and set up the mesocosm experiment. We also thank J. Barcelos e Ramos for processing the salinity data, and H.-P. Grossart, M. Vogt and J. Williams for helpful comments on the manuscript.
References
Antia, A., Suffrian, K., Holste, L., M ¨uller, M. N., Nejstgaard, J. C., Simonelli, P., Carotenuto, Y.,
15
and Putzeys, S.: Dissolution of coccolithophorid calcite by microzooplankton and copepod grazing, Biogeosciences Discuss., accepted, 2007.4553,4558
Barcelos e Ramos, J., Biswas, H., Schulz, K. G., LaRoche, J., and Riebesell, U.: Effect of rising atmospheric carbon dioxide on the marine nitrogen fixer Trichodesmium, Glob. Biogeochem. Cycles, 21, doi:10.1029/2006GB002898, 2007. 4550
20
Bellerby, R. G. J., Schulz, K. G., Riebesell, U., Neill, C., Nondal, G., Johannessen, T., and Brown, K. R.: Marine ecosystem community carbon and nutrient uptake stoichiometry un-der varying ocean acidification during the PeECE III experiment, accepted, Biogeosciences Discuss., 2007. 4549,4550,4552,4558
1
Riebesell, U., Bellerby, R. G. J., Grossart, H.-P., and Thingstad, T. F.: Mesocosm CO2 per-tubation studies: from organism to community level, Biogeosciences Discuss., in preparation, 2007.
BGD
4, 4539–4570, 2007
Build-up and decline of organic matter
during PeECE III K. Schulz et al. Title Page Abstract Introduction Conclusions References Tables Figures ◭ ◮ ◭ ◮ Back Close Full Screen / Esc
Printer-friendly Version Interactive Discussion
Burkhardt, S. and Riebesell, U.: CO2availability affects elemental composition (C:N:P) of the marine diatom Sceletonema costatum, Mar. Ecol. Prog. Ser., 155, 67–76, 1997. 4541
Burkhardt, S., Riebesell, U., and Zondervan, I.: Effects of growth rate, CO2 concentration,
and cell size on the stable carbon isotope fractionation in marine phytoplankton, Geochim. Cosmochim. Acta, 63, 3729–3741, 1999a. 4550
5
Burkhardt, S., Zondervan, I., and Riebesell, U.: Effect of CO2concentration on the C:N:P ratio
in marine phytoplankton: A species comparision, Limnol. Oceanogr., 44, 683–690, 1999b.
4541
Caldeira, K. and Wicket, M. E.: Anthropogenic carbon and ocean pH, Nature, 425, p. 365, 2003. 4541
10
Carotenuto, Y., Putzeys, S., Simonelli, P., Paulino, A., Meyerh ¨ofer, M., Suffrian, K., Antia, A., and Nejstgaard, J. C.: Feeding and reproduction of the copepod Calanus finmarchicus in nutrient-induced phytoplankton blooms under different CO2regimes: the Pelagic Ecosystem
CO2Enrichment III (PeECE III) Mesocosm Experiment, Biogeosciences Discuss., 4, 3913– 3936, 2007,
15
http://www.biogeosciences-discuss.net/4/3913/2007/. 4558
Chapelle, A.: A preliminary model of nutrient cycling in sediments of a Mediterranean lagoon, Ecol. Mod., 80, 131–147, 1995.4550
Delille, B., Harlay, J., Zondervan, I., Jacquet, S., Chou, L., Wollast, R., Bellerby, R. G. J., Frankignoulle, M., Borges, A. V., Riebesell, U., and Gattuso, J.-P.: Response of primary
20
production and calcification to changes of pCO2 during experimental blooms of the coc-colithophorid Emiliania huxleyi, Glob. Biogeochem. Cycl., 19, doi:10.1029/2004GB002318, 2005. 4553
Egge, J. K., Thingstad, T. F., Engel, A., and Riebesell, U.: Primary production during nutrient-induced blooms at elevated CO2 concentrations, Biogeosciences Discuss.,4, 4385–4410,
25
2007. 4558
Engel, A.: Direct relationship between CO2 uptake and transparent exopolymer particles pro-duction in natural phytoplankton, J. Plankt. Res., 24, 49–53, 2002. 4541,4551
Engel, A., Thoms, S., Riebesell, U., Rochelle-Newall, E., and Zondervan, I.: Polysaccharide aggregation as a potential sink of marine dissolved organic carbon, Nature, 428, 929–932,
30
2004. 4541
Engel, A., Zondervan, I., Aerts, K., Beaufort, L., Benthien, A., Chou, L., Delille, B., Gattuso, J.-P., Harlay, J., Heemann, C., Hoffmann, L., Jacquet, S., Nejstgaard, J., Pizay, M. D.,
Rochelle-BGD
4, 4539–4570, 2007
Build-up and decline of organic matter
during PeECE III K. Schulz et al. Title Page Abstract Introduction Conclusions References Tables Figures ◭ ◮ ◭ ◮ Back Close Full Screen / Esc
Printer-friendly Version Interactive Discussion
EGU
Newall, E., Schneider, U., Terbrueggen, A., and Riebesell, U.: Testing the direct effect of CO2concentration on a bloom of the coccolithophorid Emiliania huxleyi in mesocosm exper-iments, Limnol. Oceanogr., 50, 493–507, 2005. 4542,4545,4550,4552
Gattuso, J.-P., Frankignoulle, M., Bourge, I., Romaine, S., and Buddemeier, R. W.: Effect of calcium carbonate saturation of seawater on coral calcification, Global Planet. Change, 18,
5
37–46, 1998. 4541
Hansen, H. P. and Koroleff, F.: Determination of nutrients, in: Methods of seawater analysis, 3. Edition, edited by: Grasshoff, K., Kremling, K., and Ehrhardt, M., 159–228, Wiley VCH, Weinheim, 1999.4544,4545
Holmes, R. M., Aminot, A., K ´erouel, R., Hooker, B. A., and Peterson, B. J.: A simple and precise
10
method for measuring ammonium in marine and freshwater ecosystems, Can. J. Fish. Aquat. Sci., 56, 1801–1808, 1999.4544
IPCC: Climate Change 2001: The Scientific Basis. Contribution of Working Group I to the Third Assessment Report of the Intergovernmental Panel on Climate Change, edited by: Houghton, J. T., Ding, Y., Griggs, D. J., Nougher, M., van der Linden, P. J., Dai, X., Maskell,
15
K. and Johnson, C. A., Cambridge University Press, Cambridge, United Kindom and New York, NY, USA, 2001.4540,4542
IPCC: Climate Change 2007: The Physical Science Basis. Contribution of Working Group I to the Fourth Assessment Report of the Intergovernmental Panel on Climate Change, edited by: Solomon, S., Qin, D., Manning, M., Chen, Z., Marquis, M., Averyt, K. B., Tignor, M., and
20
Miller, H. L., Cambridge University Press, Cambridge, United Kindom and New York, NY, USA, 2007. 4540
Kleypas, J. A., Buddemeier, R. W., Archer, D., Gattuso, J.-P., Langdon, C., and Opdyke, B. N.: Geochemical consequences of increased atmospheric carbon dioxide on coral reefs, Sci-ence, 284, 118–120, 1999.4541
25
Langer, G., Geisen, M., Baumann, K. H., Kl ¨as, J., Riebesell, U., Thoms, S., and Young, J. R.: Species-specific responses of calcifying algae to changing seawater carbonate chemistry, Geochem. Geophys. Geosystems, 7, doi:10.1029/2005GC001227, 2006.4541,4550
Mackey, M. D., Mackey, D. J., Higgins, H. W., and Wright, S. W.: CHEMTAX – a program for estimating class abundances from chemical markers: application to HPLC measurements of
30
phytoplankton, Mar. Ecol. Progr. Ser., 144, 265–283, 1996.4544
Orr, J. C. Fabry, V. J., Aumont, O., Bopp, L., Doney, S. C., Feely, R. A., Gnanadesikan, A., Gruber, N., Ishida, A., Joos, F., Key, R. M., Lindsay, K., Maier-Reimer, E., Matear, R.,
Mon-BGD
4, 4539–4570, 2007
Build-up and decline of organic matter
during PeECE III K. Schulz et al. Title Page Abstract Introduction Conclusions References Tables Figures ◭ ◮ ◭ ◮ Back Close Full Screen / Esc
Printer-friendly Version Interactive Discussion
fray, P., Mouchet, A., Najjar, R. G., Plattner, G. K., Rodgers, K. B., Sabine, C. L., Sarmiento, J. L., Schlitzer, R., Slater, R. D., Totterdell, I. J., Weirig, M. F., Yamanaka, Y., and Yool, A.: Anthropogenic ocean acidification over the twenty-first century and its impact on calcifying organisms, Nature, 437, 681–686, 2005. 4541
Qian, J. and Mopper, K.: Automated High-Performance, High-Temperature Combustion Total
5
Organic Carbon Analyzer, Anal. Chem., 68, 3090–3097, 1996. 4545
Riebesell, U.: Effects of CO2Enrichment on Marine Phytoplankton, J. Oceanogr., 60, 719–729,
2005. 4541
Riebesell, U., Zondervan, I., Rost, B., Tortell, P. D., Zeebe, R. E., and Morel, F. M. M.: Reduced calcification of marine plankton in response to increased atmosphe ric CO2, Nature, 407,
10
364–367, 2000. 4541
Riebesell, U., Schulz, K. G., Bellerby, R. G. J., Botros, M., Fritsche, P., Meyerh ¨ofer, N., Neill, C., G., N., Oschlies, A., Wohlers, J., and Z ¨ollner, E.: Enhanced biological carbon consumption in a high CO2ocean, Nature, 450, 545–548, doi: 10.1038/nature06267, 2007. 4550,4551,
4552
15
Rost, B., Zondervan, I., and Riebesell, U.: Light-dependent carbon isotope fractionation in the coccolithophorid Emiliania huxleyi, Limnol. Oceanogr., 47, 120–128, 2002. 4550
Russel, A. D., H ¨onisch, B., Spero, H. J., and Lea, D. W.: Effects of seawater carbonate ion concentration and temperature on shell U, Mg, and Sr in cultured planktonic foraminifera, Geochim. Cosmochim. Acta, 68, 4347–4361, 2004. 4541
20
Serpa, D., Falc ˜ao, M., Duarte, P., Cancela da Fonseca, L., and Vale, C.: Evaluation of am-monium and phosphate release from intertidal and subtidal sediments of a shallow coastal lagoon (Ria Formosa – Portugal): a modelling approach, Biogeochem., 82, 291–304, 2007.
4550
Sinha, V., Williams, J., Meyerh ¨ofer, M., Riebesell, U., Paulino, A. I., and Larsen, A.: Air-sea
25
fluxes of methanol, acetone, acetaldehyde, isoprene and DMS from a Norwegian fjord fol-lowing a phytoplankton bloom in a mesocosm experiment, Atmos. Chem. Phys., 7, 739–755, 2007,
http://www.atmos-chem-phys.net/7/739/2007/. 4558
Vogt, M., Steinke, M., Turner, S., Paulino, A., Meyerh ¨ofer, M., Riebesell, U., Le Qu ´ere, C., and
30
Liss, P.: Dynamics of dimethylsulphoniopropionate and dimethylsulfide under different CO2
concentrations during a mesocosm experiment, Biogeosciences ,4(5), 3673–3699, 2007a.
BGD
4, 4539–4570, 2007
Build-up and decline of organic matter
during PeECE III K. Schulz et al. Title Page Abstract Introduction Conclusions References Tables Figures ◭ ◮ ◭ ◮ Back Close Full Screen / Esc
Printer-friendly Version Interactive Discussion
EGU
Wingenter, O. W., Haase, K. B., Zeigler, M., Blake, D. R., Sherwood Rowland, F. S., Sive, B. C., Paulino, A., Thyrhaug, R., Larsen, A., Schulz, K., Meyerh ¨ofer, M., and Riebesell, U.: Un-expected consequences of increasing CO2and ocean acidity on marine production of DMS and CH2ClI: Potential climate impacts, Geophys. Res. Lett., 34, doi:10.1029/2006GL028139, 2007. 4553,4558
BGD
4, 4539–4570, 2007
Build-up and decline of organic matter
during PeECE III K. Schulz et al. Title Page Abstract Introduction Conclusions References Tables Figures ◭ ◮ ◭ ◮ Back Close Full Screen / Esc
Printer-friendly Version Interactive Discussion
Table 1. Measured parameters.
Parameter Method Reference
Temperature CTD† This article
Salinity CTD† This article
Alkalinity Potentiometric Titration Bellerby et al.(2007)
DIC Coulometry Bellerby et al.(2007)
δ13CDIC Mass spectrometry U. Ninnemann et al.
pCO2 Infrared analyzer Li-Cor 6262 Bellerby et al.(2007)
Nutrients Autoanalyzer† This article
Trace metals Voltammetry Breitbarth et al.(2007)1
Phytoplankton cell counts Microscopy V. Martin, unpubl. data
Phytoplankton and bacteria cell counts Flowcytometry Paulino et al.(2007)2
Pigments HPLC† This article
TPC, POC, PON Elemental Analyzer† This article
POP Colorimetry† This article
PIC TPC-POC This article
DOC, DON HTCO† This article
DOP Colorimetry† This article
TEP Colorimetry J. Wohlers unpl. data
Mono-, Polysaccharides Colorimetry J. Wohlers unpubl. data
Phosphorus uptake/affinity 33PO3−4 Tanaka et al.(2007)3
Primary Production 14C incubation, oxygen L/D method Egge et al.(2007)
C-fluxes 13C labelling of biomarkers J. Middelburg unpl. data
Micro and mesozooplankton Microscopy Antia et al.(2007), Suffrian et al.(2007)4
Copepod eggs and fecal pellets Microscopy Carotenuto et al.(2007)
Bacterial diversity/production DGGE Allgaier et al.(2007)5
Glucose, APA affinity/turnover 14C labelling / Fluorometry Tanaka et al.(2007)3
Viral density/diversity Flowcytometry / DGGE,PFGE Larsen et al.(2007)6
VOC in headspace PTR-MS Sinha et al.(2007)
Organohalogens in headspace GC-MS –
DMS, DMSP, DMSP lyase GC Vogt et al.(2007a); Vogt et al.(2007b)7
Organic sulfur compounds, halocarbons,
hydrocarbons, alkyl nitrates GC-FID-ECD-MS Wingenter et al.(2007)
BGD
4, 4539–4570, 2007
Build-up and decline of organic matter
during PeECE III K. Schulz et al. Title Page Abstract Introduction Conclusions References Tables Figures ◭ ◮ ◭ ◮ Back Close Full Screen / Esc
Printer-friendly Version Interactive Discussion
EGU
Table 1. Continued.
†
for details see Materials and Methods section of this article.
1Breitbarth, E., Bellerby, R. J., Neill, C., Ardelan, M. V., Meyerh ¨ofer, M., Z ¨ollner, E., Croot, P. L., and Riebesell, U.: Ocean acidification increases bioavailability of iron, Science (in review), 2007.
2
Paulino, A., Egge, J., and Larsen, A.: Dynamics of small and intermediate sized osmotrophs at different CO2levels, Biogeosciences Discuss., in preparation, 2007.
3Tanaka, T., Thingstad, T. F., Allgaier, M., Egge, J. K., Grossart, H.-P., Larsen, A., Løvdal, T., Meyer ¨ofer, M., Riebesell, U., Schulz, K. G., Wohlers, J., and Z ¨ollner, E.: Implications of reduced phosphate availability for phytoplankton and bacteria at higher pCO2levels in a mesocosm study, Biogeosciences Discuss., in preparation, 2007.
4
Suffrian, K., Simonelli, P., Antia, A., Putzeys, S., Carotenuto, Y., and Nejstgaard, J. C.: Phytoplankton-zooplankton grazing and growth interactions during the PeECE III mesocosm study 2005, Biogeosciences Discuss., in preparation, 2007.
5Allgaier, M., Riebesell, U., and Grossart, H.-P.: Coupling of heterotrophic bacteria to phytoplankton bloom develop-ment at different pCO2levels: a mesocosm study, Biogeosciences Discuss., in preparation, 2007.
6Larsen, J. B., Larsen, A., Thyrhaug, R., Bratbak, G., and Sandaa, R.-A.: Marine viral populations at elevated nutrient and pCO2levels, Biogeosciences Discuss., in preparation, 2007.
7Vogt, M., Turner, S., Yassaa, N., Steinke, M., Williams, J., and Liss, P.: Laboratory inter-comparison of dissolved dimethyl sulfide (DMS) measurements using purge-and-trap and solid-phase microextraction techniques during a mesocosm experiment, submitted to Marine Chemistry, 2007b.
BGD
4, 4539–4570, 2007
Build-up and decline of organic matter
during PeECE III K. Schulz et al. Title Page Abstract Introduction Conclusions References Tables Figures ◭ ◮ ◭ ◮ Back Close Full Screen / Esc
Printer-friendly Version Interactive Discussion PSU ≈ 30.5 PSU ≈ 32.0 S E D ∼ 5.7 m ∼ 9.5 m 2 .0 m
Fig. 1. Mesocosm design and setup. PSU denotes Salinity and SED the sediment trap. See text for details.
BGD
4, 4539–4570, 2007
Build-up and decline of organic matter
during PeECE III K. Schulz et al. Title Page Abstract Introduction Conclusions References Tables Figures ◭ ◮ ◭ ◮ Back Close Full Screen / Esc
Printer-friendly Version Interactive Discussion EGU M1 12% 35% 10% 38% 21% 58% 8% 31% 8% 29% 36% 50% 13% 42% 14% 32% 16% 33% M2 M3 M4 M5 M6 M7 M8 M9 0 0 0 0 0 0 1 1 1 2 2 2 2 2 2 3 3 3 4 4 4 4 4 4 5 5 5 6 6 6 6 6 6 7 7 7 8 8 8 8 8 8 10 10 1012141618202224 12141618202224 12141618202224 30.5 31 31.5 32 Days D ep th (m )
Fig. 2. Temporal changes in the vertical distribution of salinity within each mesocosm during the experiment. The black vertical lines mark the “storm event” around day 12. The loss of deep water into the upper 5.7 m by mixing was calculated from a simple mass balance. Numbers prior to day 12 denote the loss until day 10 while numbers after day 12 denote the loss until the end of the experiment.
BGD
4, 4539–4570, 2007
Build-up and decline of organic matter
during PeECE III K. Schulz et al. Title Page Abstract Introduction Conclusions References Tables Figures ◭ ◮ ◭ ◮ Back Close Full Screen / Esc
Printer-friendly Version Interactive Discussion Days D ep th (m ) 0 0 1 2 2 3 4 4 5 6 6 7 8 8 10 10 12 12 14 16 18 20 22 24 9.5 10.5 11.5 9 11
Fig. 3. Temporal changes in the vertical temperature distribution averaged along all nine meso-cosms. Standard deviation between mesocosms was generally less than 0.1◦C. The vertical black line marks the “storm event” around day 12.
BGD
4, 4539–4570, 2007
Build-up and decline of organic matter
during PeECE III K. Schulz et al. Title Page Abstract Introduction Conclusions References Tables Figures ◭ ◮ ◭ ◮ Back Close Full Screen / Esc
Printer-friendly Version Interactive Discussion EGU 2 2 Days P F D (µ m o lm − 2s − 1) E n er g y (W m − 2 ) 0 0 500 1000 1500 2000 4 4 66 88 1010 1212 1414 1616 1818 2020 2222 2424 250 500 750 1000
Fig. 4. Photon flux density (PFD) of incident photosynthetic active radiation between 400 and 700 nm (PAR) as measured on the raft (black line) and total amount of energy received as measured by the Geophysical Institute of the University of Bergen (grey line). See results section for details on PFDs within the mesocosms headspace and mixed surface water.
BGD
4, 4539–4570, 2007
Build-up and decline of organic matter
during PeECE III K. Schulz et al. Title Page Abstract Introduction Conclusions References Tables Figures ◭ ◮ ◭ ◮ Back Close Full Screen / Esc
Printer-friendly Version Interactive Discussion Days Days N it ra te (µ m o lk g − 1) S il ic a te (µ m o lk g − 1) Ph o sp h a te (µ m o lk g − 1) A m m o n iu m (µ m o lk g − 1) A m m o n iu md e e p (µ m o lk g − 1) 0 0 0 0 0 1 1 2 2 2 2 3 3 5 6 6 10 10 10 14 14 15 18 18 22 22 0.3 0.9 1.2 0.2 0.4 0.6 0.6 0.8 A B C D E
Fig. 5. Temporal development of major nutrient concentrations within the mesocosms’ upper mixed layer. Green, grey and red lines illustrate average concentrations of (A) nitrate, (B) phos-phate, (C) silicate and (D) ammonium within the 1x, 2x and 3x CO2mesocosms, respectively. (E) Ammonium concentrations measured in deep waters at the beginning of the experiment (t0) and selected days towards the end (t20and t25). Vertical lines denote standard deviations within each CO2treatment (1x, 2x, 3x CO2).
BGD
4, 4539–4570, 2007
Build-up and decline of organic matter
during PeECE III K. Schulz et al. Title Page Abstract Introduction Conclusions References Tables Figures ◭ ◮ ◭ ◮ Back Close Full Screen / Esc
Printer-friendly Version Interactive Discussion EGU
Days
p
C
O
2(µ
a
tm
)
0
2
6
10
14
18
22
200
400
600
800
1000
1200
Fig. 6. Temporal development of CO2partial pressures (pCO2) within the mesocosms’ upper mixed layer. Style and color-coding follow that of Fig. 5.
BGD
4, 4539–4570, 2007
Build-up and decline of organic matter
during PeECE III K. Schulz et al. Title Page Abstract Introduction Conclusions References Tables Figures ◭ ◮ ◭ ◮ Back Close Full Screen / Esc
Printer-friendly Version Interactive Discussion Days Days C h l aT o ta l (µ g l − 1) C h l a P ra s (µ g l − 1) C h l a P ry m (µ g l − 1) C h l aC y a n o (µ g l − 1) C h l aD ia to m (µ g l − 1) C h l a D in o (µ g l − 1) 0 0 0 0 0 0 2 2 5 5 5 5 5 5 6 6 10 10 10 10 10 10 10 10 14 14 15 15 15 15 15 15 18 22 18 22 A B C D E F
Fig. 7. Temporal development of Chla concentrations within the mesocosms’ upper mixed layer. Total Chla concentrations (A) were measured by HPLC, while individual Chla contributions by diatoms (B), prymnesiophytes (C), prasinophytes (D), cyanobacteria (E) and dinoflagellates (F) have been calculated using the CHEMTAX algorithm (see methods for details). Shaded light green area depicts the temporal and spatial range of total Chla within all mesocosms. Style and color-coding follow that of Fig. 5.
BGD
4, 4539–4570, 2007
Build-up and decline of organic matter
during PeECE III K. Schulz et al. Title Page Abstract Introduction Conclusions References Tables Figures ◭ ◮ ◭ ◮ Back Close Full Screen / Esc
Printer-friendly Version Interactive Discussion EGU Days Days P O C (µ m o ll − 1) D O C (µ m o ll − 1) D O N (µ m o ll − 1) P IC (µ m o ll − 1) P O N (µ m o ll − 1) P O P (µ m o ll − 1) D O P (µ m o ll − 1) 0 0 0 0 0 0 0 0.2 0.2 0.4 0.4 0.6 0.8 0.1 0.3 0.5 2 2 3 5 6 6 6 9 10 10 10 10 12 14 14 15 18 18 20 20 20 22 22 30 40 40 60 60 80 80 100 100 120 120 A B C D E F G
Fig. 8. Temporal development of organic matter within the mesocosms’ upper mixed layer. Standing stocks of particulate organic matter POC (A), PON (B), POP (C) and PIC (D) are shown in comparison to those of dissolved organic matter DOC (E), DON (F) and DOP (G). Style and color-coding follow that of Fig. 5.
BGD
4, 4539–4570, 2007
Build-up and decline of organic matter
during PeECE III K. Schulz et al. Title Page Abstract Introduction Conclusions References Tables Figures ◭ ◮ ◭ ◮ Back Close Full Screen / Esc
Printer-friendly Version Interactive Discussion
Z
o
o
p
la
n
k
to
n
C
ar
b
o
n
(µ
m
o
ll
− 1)
0
1
2
3
4
Start
End
Fig. 9. Average metazooplankton (>90 µm) organic carbon at the start (black) and at the end of the experiment in the 1x CO2(green), 2x CO2(grey) and 3x CO2(red) mesocosms. Vertical lines denote standard deviations.
BGD
4, 4539–4570, 2007
Build-up and decline of organic matter
during PeECE III K. Schulz et al. Title Page Abstract Introduction Conclusions References Tables Figures ◭ ◮ ◭ ◮ Back Close Full Screen / Esc
Printer-friendly Version Interactive Discussion EGU Days Days P O C / P O N P O C / P O P P O N / P O P D O C / D O N D O C / D O P D O N / D O P 0 0 0 0 0 0 2 2 5 5 6 6 10 10 10 10 14 14 15 15 18 18 20 20 20 22 22 40 60 100 100 100 200 200 300 300 400 50 150 A B C D E F
Fig. 10. Temporal development in element ratios of particulate organic and dissolved organic matter produced in the mesocosms’ upper surface waters. Ratios shown are POC/PON (A), POC/POP (B), PON/POP (C), DOC/DON (D), DOC/DOP (E), and DON/DOP (F). Ratios of particulate organic matter were determined from organic matter build-up starting from t0−t1 averages in each mesocosm (A, B and C). Ratios of dissolved organic matter were estimated from corresponding build-up until the peak and end of the bloom, t11−t12and t20−t24, respec-tively, starting from t0−t4 averages (D, E and F). Style and color-coding follow that of Fig. 5. Black horizontal lines denote respective Redfield ratios.
BGD
4, 4539–4570, 2007
Build-up and decline of organic matter
during PeECE III K. Schulz et al. Title Page Abstract Introduction Conclusions References Tables Figures ◭ ◮ ◭ ◮ Back Close Full Screen / Esc
Printer-friendly Version Interactive Discussion Days se d. P O C / P O N se d. P O C / P O P se d. P O N / P O P 0 0 0 2 5 6 10 10 14 15 18 20 22 26 40 60 100 200 300 A B C
Fig. 11. Temporal development in elemental ratios of particulate organic matter sampled by sediment traps. Shown are sedimentary ratios of POC/PON (A), POC/POP (B), and PON/POP (C). Style and color-coding follow that of Fig. 5. Black horizontal lines denote respective Red-field ratios.