HAL Id: insu-02878311
https://hal-insu.archives-ouvertes.fr/insu-02878311
Submitted on 23 Nov 2020
HAL is a multi-disciplinary open access
archive for the deposit and dissemination of
sci-entific research documents, whether they are
pub-lished or not. The documents may come from
teaching and research institutions in France or
abroad, or from public or private research centers.
L’archive ouverte pluridisciplinaire HAL, est
destinée au dépôt et à la diffusion de documents
scientifiques de niveau recherche, publiés ou non,
émanant des établissements d’enseignement et de
recherche français ou étrangers, des laboratoires
publics ou privés.
Stretching and folding sustain microscale chemical
gradients in porous media
Joris Heyman, Daniel Lester, Régis Turuban, Yves Méheust, Tanguy Le
Borgne
To cite this version:
Joris Heyman, Daniel Lester, Régis Turuban, Yves Méheust, Tanguy Le Borgne. Stretching and
folding sustain microscale chemical gradients in porous media. Proceedings of the National Academy
of Sciences of the United States of America , National Academy of Sciences, 2020, 117 (24),
pp.13359-13365. �10.1073/pnas.2002858117�. �insu-02878311�
DRAFT
Stretching and folding sustain microscale
chemical gradients in porous media
Heyman J.a,1, Lester D. R.b,2, Turuban R.a,3, Méheust Y.a,4, and Le Borgne T.a,5
aUniv Rennes, CNRS, Géosciences Rennes, UMR 6118, 35000 Rennes, France.;bSchool of Engineering, RMIT University, 3000 Melbourne, Victoria, Australia. This manuscript was compiled on April 19, 2020
Fluid flow in porous media drives the transport, mixing and reaction of molecules, particles and microorganisms across a wide spectrum of natural and industrial processes. Current macroscopic models that average pore-scale fluctuations into an effective dispersion co-efficient have shown significant limitations in the prediction of many important chemical and biological processes. Yet, it is unclear how three-dimensional flow in porous structures govern the microscale chemical gradients controlling these processes. Here we obtain high-resolution experimental images of microscale mixing patterns in three-dimensional porous media and uncover an unexpected and general mixing mechanism that strongly enhances concentration gradients at pore-scale. Our experiments reveal that systematic stretching and folding of fluid elements are produced by grain con-tacts, through a mechanism that leads to efficient microscale chaotic mixing. These insights form the basis for a general kinematic model linking chaotic mixing rates in the fluid phase to the generic struc-tural properties of granular matter. The model successfully predicts the resulting enhancement of pore-scale chemical gradients, which appear to be orders of magnitude larger than predicted by dispersive approaches. These findings offer new perspectives for predicting and controlling the vast diversity of reactive transport processes in natural and synthetic porous materials, beyond the current disper-sion paradigm.
Porous Media | Mixing | Lagrangian Chaos
Introduction
F
luid mixing in porous media plays a key role in a range of natural and industrial systems (1–3). In these confined environments, mixing enables or limits reactions controlling the degradation of contaminants in the subsurface, the cycles of biogeochemical elements such as nitrogen, iron and carbon, and the sequestration of CO2in deep reservoirs (4–10). Mixingalso shapes the nutrient landscapes and chemical gradients seen by bacteria evolving in soils or medical systems (11,12) and facilitates chemical processes in drug delivery, packed bed reactors, flow batteries, or catalysts (13–15). Increasing evidence of sustained chemical gradients and incomplete mix-ing below the pore-scale, along with associated impacts upon chemical reactions (3,16–18), have questioned the relevance of macroscopic dispersion coefficients to capture these processes (1). Yet, it is currently unknown how three-dimensional flow topologies in porous structures control microscale mixing rates and concentration gradients.
Recent theories (19,20) have suggested that laminar flow through three-dimensional porous media may possess the basic ingredients for chaotic advection, which would represent a pos-sible mechanism for the enhancement of microscale chemical gradients, and the persistence of incomplete mixing at the pore-scale. These chaotic dynamics may have particularly important consequences for microbial processes, a broad range
of which are hosted in porous environments (21). Biological processes in turbulent flows have been shown to be deeply altered by chaotic advection, which promotes coexistence of competitive microbial species (22) and affects the chemotactic responses of micro-organisms (23). However, whether such chaotic dynamics can spontaneously develop in laminar flows through porous media remains on open question.
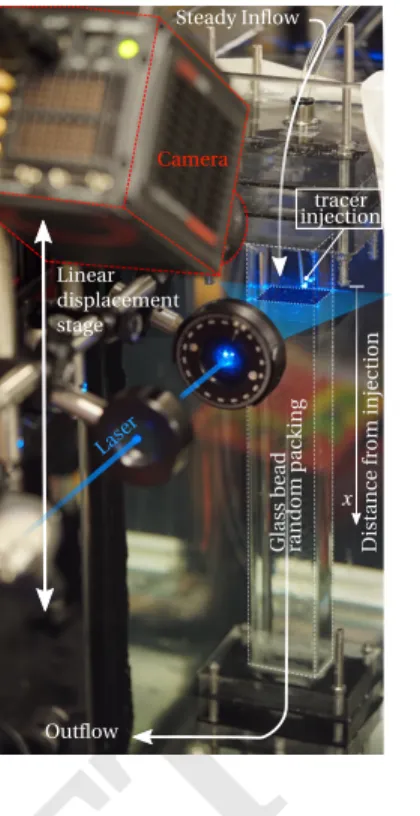
A key experimental barrier to the direct imaging of solute advection in three-dimensional porous materials is their pre-dominantly opaque nature. Whilst X-ray micro-tomography technologies have progressed significantly (24), they still can-not resolve the fine structures produced below pore-scale. In contrast, use of visible spectrum refractive index matching between the solid and the fluid phases represents a viable alternative to observe solute mixing, as obtained with hy-drogel beads in water (25). However, as molecular diffusion eventually masks the deformation of dyed fluid elements, a direct measurement of fluid deformation in random porous media is an outstanding challenge. Here we overcome these limitations by performing high-resolution laser imaging of the evolution of a low diffusivity fluorescent dye plume through a column of optically transparent borosilicate spheres via high precision refractive index matching (Fig. 1). This technique allows reconstruction of the three-dimensional dye plume at unprecedented resolution, thus providing direct experimen-tal observation of pore-scale fluid deformation and mixing in
Significance Statement
Porous media flows are central to environmental, industrial, and biological systems, where they transport molecules, particles, and microorganisms and trigger important bio-geo-chemical reactions. There is increasing evidence that many of these processes are highly sensitive to chemical gradients below the pore-scale. But it is unknown how porous architectures control microscale concentration heterogeneities. Here, we provide high-resolution experimental images that fully resolve 3D pore-scale mixing dynamics. We show that grain contacts control the folding of fluid elements in the pore-space, which, in addition to fluid stretching as stagnation points, leads to the exponen-tial enhancement of microscale concentration gradients. We use these insights to derive a kinematic model linking mixing rates to pore geometry, opening new perspectives for reactive transport modelling.
J.H did the experiments, the data analysis and model and wrote the paper. D.R.L. and Y.M. con-tributed to data and model interpretation and redaction. RT performed the numerical simulations discussed in section A of the S.I. T.L.B formulated the idea and contributed to analysis, interpreta-tion and redacinterpreta-tion.
The authors declare no competing interests.
1Joris Heyman. E-mail: joris.heymanuniv-rennes1.fr
1 2 3 4 5 6 7 8 9 10 11 12 13 14 15 16 17 18 19 20 21 22 23 24 25 26 27 28 29 30 31 32 33 34 35 36 37 38 39 40 41 42 43 44 45 46 47 48 49 50 51 52 53 54 55 56 57 58 59 60 61 62 63 64 65 66 67 68 69 70 71 72 73 74 75 76 77 78 79 80 81 82 83 84 85 86 87 88 89 90 91 92 93 94 95 96 97 98 99 100 101 102 103 104 105 106 107 108 109 110 111 112 113 114 115 116 117 118 119 120 121 122 123 124
DRAFT
(b.0) Before contact (b.1) After contact (x=+0.1d) (b.2) After contact(x=+0.5d)2 2 1 3 2 (b.3) Next contact(x=+0.6d) 3 4 2 (a) 1 2 3 4 x 1
Fig. 1. (a) Experimental dye plume
with backbone filament (red lines) at selected stages of the folding mech-anism (run III, SI Video S4). Beads have been shrunk by 40% and white lines depict the contact line joining bead centres; surrounding beads are not shown. (b) Cross-sections detail-ing the typical folddetail-ing stages (run I, SI Video S3). Upon passing the contact point 1-2 (b.0), the filament is stretched (diverging arrows) along the contact plane (dashed line) and compressed in the perpendicular direction (converg-ing arrows). After contact (b.1), the directions of stretching and compres-sion are inverted, and a cusp forms, creating a fold (b.2) which is advected over the subsequent contact 3-4 (b.3). Other experimental runs and numerical simulations are reported in SI Figures S1, Fig. S2 and SI Video S5.
porous media. These novel data reveal the hitherto unknown role of grain contacts in controlling folding and stretching of fluid elements, a mechanism that generates strong chaotic advection and significantly enhances chemical gradients at the microscale. Since grain contacts are inherent to all granular porous materials, we deduce that chaotic mixing is ubiquitous in flow through all such materials, potentially impacting a large range of fluid-borne phenomena in natural and engineered systems.
3D imaging of mixing patterns in porous media
We observed three-dimensional fluid deformation and solute mixing in laminar flows through monodispersed random bead packs of diameters d = 7, 10 and 20 mm, optically matched into a glycerol-water fluid mixture (Fig.5). A fluorescent dye is continuously injected upstream of the transparent column as a thin tube of radius L0 d (Fig. 2a), and advected
downstream by the porous flow at the mean longitudinal advection velocity u. Cross-stream concentration patterns of the dye plume are imaged in the pore-space via a translational scan using a laser sheet and a camera. The dye cross-section rapidly evolves into a highly elongated (Fig.2b) and striated filamentous structure (Fig. 2c) due to transverse stretching and folding of fluid elements in pores (SI Videos S1,S2,S3). The combination of a highly viscous fluid mixture and a high molecular weight dye results in laminar flows of low diffusivity, characterized by Reynolds numbers on the order of Re=7·10−3 and Péclet numbers on the order of Pe=104(SI Table S1). The
deformation of the dye plume (Fig.1a) thus closely shadows that of the advected fluid, facilitating direct visualization of pore-scale fluid deformation. We use spline fitting on the images to reconstruct the backbone of the cross-sectional dye footprint, called a filament, and estimate its total length L(x) for 9 to 14 bead diameters downstream from the injection point (see Fig.2, SI Video S3).
The mean total filament elongation L/L0, averaged over the
18 statistically equivalent packings (SI Table S1), exhibits clear exponential growth with normalized longitudinal distance x/d (Figure3). The dimensionless exponent µ ≡ ln(L/L0)/(x/d) =
0.29 ± 0.01 is independent of both bead diameter and flow
rate and is known as the topological entropy of the flow (26). Via the central limit theorem, µ is related to the mean λ and variance σ2λof the dimensionless stretching rate (see Methods)
µ = λ + σ2λ/2. [1]
The dimensionless parameter λ is also known as the Lyapunov exponent (26), which can be converted into a mean stretching rate per unit time as λu/d. In addition to stretching, the filament also undergoes highly localised folding events which result in closely foliated striations (Fig.2c). These fluid defor-mations are the hallmarks of chaotic mixing, and permit thus permitting exponential elongation of material elements in a finite-sized domain.
The role of grain contacts in folding
Folding of dye filaments is consistently initiated downstream of contact points between two beads (Fig. 1b and SI Figure S1). The cusp-shaped geometry near grain contacts means that when crossing a contact point (b.0), fluid elements are first compressed in the direction joining the two bead centres and stretched in the perpendicular direction. Downstream of the contact point, the direction of compression and stretching are exchanged and a cusp forms locally in the dye filament (b.1). This cusp is stretched in the following pore space, leading to a folded filament made of two straight segments (b.2). This stretching and folding process is repeated sequentially as the folded filament encounters other contact points (b.3), leading to thin solute dye foliations that are the hallmarks of chaotic advection (26) (Fig.2c).
Recent studies (19,20) identified the role of separation and reattachment points on open grain boundaries (saddle points) in generating exponential stretching of fluid elements. Here, we uncovered the distinct role of contact points between grains in generating systematic folding of fluid elements. Simulations of laminar flow in periodic bead packings (see SI Text section A) show that attracting and repelling stream surfaces (unstable and stable manifolds) produced by these saddles indeed control stretching of material lines in the pore space. We found that these manifolds intersect orthogonally at grain contacts (SI
2 | www.pnas.org/cgi/doi/10.1073/pnas.XXXXXXXXXX 125 126 127 128 129 130 131 132 133 134 135 136 137 138 139 140 141 142 143 144 145 146 147 148 149 150 151 152 153 154 155 156 157 158 159 160 161 162 163 164 165 166 167 168 169 170 171 172 173 174 175 176 177 178 179 180 181 182 183 184 185 186 187 188 189 190 191 192 193 194 195 196 197 198 199 200 201 202 203 204 205 206 207 208 209 210 211 212 213 214 215 216 217 218 219 220 221 222 223 224 225 226 227 228 229 230 231 232 233 234 235 236 237 238 239 240 241 242 243 244 245 246 247 248 Heyman et al.
DRAFT
1 cm
a) b)
c)
1 cm 1 cm
Fig. 2. Cross-stream sections of the fluorescent dye plume at increasing distances
from the injection:x/d = 0(a),3.2(b) and9.3(c)(run II, SI Video S1 and S2). Colors represent local dye concentrations. Beads appear in deep blue. A spline curve (dotted black lines) is used to fit the filament backbone on each cross-section image; from which the total filament lengthLis obtained.
Figure S2 and SI Video S5), where both the local flow velocity
and the stretching rate vanish and manifold stabilities are exchanged, so that repelling stream surfaces become attracting and vice-versa. Hence, over a contact point, the local flow structure imparts finite curvature to fluid elements, which results in the sharp folds observed experimentally (Fig. 1). The repetition of this basic stretching and folding sequence over successive contact points offers a simple geometric framework to relate stretching rates to granular structure.
Linking stretching statistics to the porous structure
Sharp folding of dye filament in between contact points pro-duces a number nc of localised cusps of strong curvature,
separated by straight segments of moderate curvature (Fig.6). We define the mean segment length as Lc = L/nc and the
average area swept out by a segment between two succes-sive contact points as Sc = S/nc, where S is the total area
swept by the filament. We find that Lc and Scboth converge
to stationary values (inset of Figure3). Hence, the average advection distance between two successive contact points is statistically constant and equal to Xc= Sc/Lc≈ 3.45 d. Over
this distance, a single elementary segment folds, giving rise to two new straight elementary segments. Thus, over the same distance, its length `(X) must doubles to maintain h`i = Lc
constant, so that `(X) = 2(X/Xc). Hence, the average
dimen-sionless stretching rate λ of elementary fluid segments can be estimated as λ ≡ d(log `) d(X/d) = log 2 Xc/d ≈ 0.21. [2] This rate is larger than found in synthetic porous media, such as random pore networks (λ ≈ 0.12 (19)) and body cen-tered cubic assemblies of spheres (λ ≈ 0.128 (27)), reflecting the remarkably efficient stretching and folding process occur-ring in random granular media. The variance of the stretching rate can be estimated from Eq. (1) as σλ2 ≈ 0.16, a value
Fig. 3. Total filament
elongationL/L0with respect to the nor-malized pore advec-tion distancex/dfrom the dye injection point. Inset: Convergence of the mean segment lengthLc = L/nc
and areaSc= S/nc
toward constant val-ues, withnc, the
num-ber of cusps.
comparable to the mean stretching rates λ, as it is typically the case in space-filling chaotic flows (28).
As shown by Eq. (2), the strength of chaotic advection is entirely governed by the spatial frequency Xc−1 with which
segments encounter grain contacts. We show in Methods that in isotropic packings Xc ≈ 8 log 2φzcdp/3, with zc the
coordination number (the mean number of contacts per bead),
φ the solids volume fraction and dpthe mean pore diameter.
This yields a simple geometric estimate of the dimensionless Lyapunov exponent
λ ≈ 3
8
φzcdp
d . [3]
Equation 3 is applicable to non-isotropic packings with a prefactor that quantifies the distribution of orientations of the contact lines joining bead centres with respect to the mean flow direction (see Methods). Insertion of the experimental values zc= 6, φ = 0.5 and dp/d = 0.24 in Eq. (3) yields λ ≈
0.27 which is in reasonable agreement with the experimental estimate of 0.21, given the slight anisotropic nature of our experimental packings (see Methods). Equation3provides the first quantitative link between microscopic fluid stretching rates and porous media structural properties.
Discussion
Stretching and folding sustain microscale chemical
gradients. Repeated sequences of stretching and folding
leads to exponential compression of fluid elements that can sustain concentration gradients at the pore-scale (Fig. 2). These concentration gradients are locally controlled byé the balance between diffusive spreading rate (Dm/s2), with Dmthe
molecular diffusivity, and the mean compression rate (λu/d), which is equal to the stretching rate in steady incompressible flows. These two rates equilibrate at the Batchelor scale
sB=
p
Dmd/(λu), [4]
which represents characteristic length scale of solute concen-tration fluctuations. Pore-scale mixing is thus characterized by the dimensionless length scale s∗B= sB/d, which is related
to the macroscopic Péclet number Pe = ud/Dmas, s∗B= (λPe)
−1/2
. [5]
For s∗B > 1, the length scale of solute concentration
fluc-tuations are larger than the grain diameter and therefore 249 250 251 252 253 254 255 256 257 258 259 260 261 262 263 264 265 266 267 268 269 270 271 272 273 274 275 276 277 278 279 280 281 282 283 284 285 286 287 288 289 290 291 292 293 294 295 296 297 298 299 300 301 302 303 304 305 306 307 308 309 310 311 312 313 314 315 316 317 318 319 320 321 322 323 324 325 326 327 328 329 330 331 332 333 334 335 336 337 338 339 340 341 342 343 344 345 346 347 348 349 350 351 352 353 354 355 356 357 358 359 360 361 362 363 364 365 366 367 368 369 370 371 372
DRAFT
concentration fields are expected to be well-mixed at the pore-scale. Our estimation of the Lyapunov exponent λ implies that the transition to incomplete pore-scale mixing occurs at Péclet number above 5, values commonly encoun-tered in many natural and industrial contexts (29). This suggests that a broad range of biogeochemical processes are possibly affected by incomplete pore-scale mixing and chaotic advection. From results established on chemical and microbial processes in turbulent and chaotic flows at comparable mixing rates (22,23), it is possible to anticipate a range of possible effects of chaotic mixing in porous media, including altered effective kinetics and microbial growth dynamics, increased biodiversity and enhanced benefit of sensing. Because they can only develop in three-dimensional topologies under steady conditions (26), these chaotic dynamics are generally absent in quasi two-dimensional microfluidic experiments used to investigate the microscale interactions between flow, concentration gradients, chemical reactions and microbial processes (3,11,30). Novel experiments in three-dimensional porous media and new modelling frameworks are thus needed to explore these dynamics.
Microscale mixing model. The experiments in this
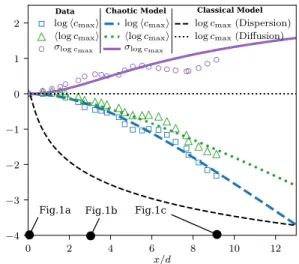
study have used high Péclet numbers to uncover the rate and kinematics of mixing in porous media. These results may be extended to prediction of macrosocopic mixing rates and concentration statistics at arbitrary Peclet numbers via lamellar mixing models that couple stretching and diffusion (31–33). In SI Text section C, we derive such mixing model and compare its predictions in terms of dye concentration statistics to the experimental data. The lamellar model successfully captures the measured exponential decay of the mean maximum solute concentration of dye filaments with longitudinal distance cmax ∼ exp(−(λ + σ2/2)x/d)
(Fig.4), as well as the growth of concentration fluctuations caused by variability of the Lagrangian stretching history. These predictions provide an independent validation of the estimated mean and variance of the stretching rate, λ ≈ 0.21 and σ2
λ ≈ 0.16. In contrast, conventional mixing models
based upon macroscopic dispersion coefficients (1) ignore incomplete mixing at the pore-scale and predict an algebraic decay of concentrations cmax∼ (x/d)−1/2 (SI Text section B).
From the normalized Batchelor scale (Eq. (5)), pore-scale concentration fluctuations predicted by the lamellar model will persist for all Péclet numbers larger than five. In this range, macroscopic dispersion models fails to resolve pore-scale concentration gradients, leading to incorrect predictions of a broad range of reactive transport dynamics (3, 16–18). Coupling lamellar mixing models with reactive processes is therefore a promising avenue to capture the effect of pore-scale incomplete mixing on biogeochemical dynamics.
Porous materials as mixers. From Eq. (3), the
mix-ing efficiency of steady laminar flows through random bead packs (defined as the ratio of the average stretching rate to the average strain rate) is found to be 3% (SI Text section D). This value is comparable to the performance of industrial mixers (26) and an order of magnitude larger than that of micro-fluidic chaotic mixers (34), thus opening new opportu-nities for exploiting the mixing properties of porous materi-als. Chaotic advection is known to both increase dispersion
Data Chaotic Model Classical Model
Fig.1a Fig.1b Fig.1c
Fig. 4. Experimental average (triangles) and standard deviation (circles) of the local
maximum concentrationcmaxalongx. Values are normalized by the initial maximum concentrationc0. Classical model predictions are shown as black dashed and dotted lines. Lamellar mixing model predictions for the average and standard deviation of
cmaxare shown respectively as the green dotted line and the purple continuous line (see SI Text sections B and C for derivations).
transverse to the mean flow direction and retard longitudinal dispersion (35). It also alters the transport of finite-sized particles such as colloids and micro-organisms (36) and may thus control their clustering in the pore space and deposition on grain boundaries. In relating stretching rates to the porous micro-structure, Eq. (3) offers a possible pathway to the design of engineered porous materials with optimum mixing charac-teristics. This concept may find important applications in the design of heat exchangers, packed bed filters and reactors, where transverse dispersion and mixing act to enhance pro-cess efficiency, and for continuous flow chemistry (15), such as pressure-driven chromatography, where product selectivity and yield strongly depends upon the minimization of longi-tudinal dispersion. These applications would first require a validation Eq. (3) over a large range of packing geometries.
Conclusions
Using high resolution experimental imaging of microscale mix-ing in three-dimensional granular media we have demonstrated the existence of efficient stretching and folding of fluid elements at the pore-scale. We use these insights into the kinematics of mixing to develop a stochastic model for the prediction of the Lyapunov exponent from the geometric properties of the grain pack, and validate this model against experimental observa-tions. The formalization of these observations into a chaotic mixing model, coupling stretching and diffusion, demonstrates that incomplete mixing persists at pore-scale for Péclet num-bers above five. This model captures the processes governing microscale chemical gradients, opening new perspectives for understanding, predicting and controlling a large spectrum of physical, chemical, and biological processes, in natural and engineered porous systems.
The discovery of systematic and efficient chaotic mixing in single phase laminar flows through random bead packs— the archetype of porous media—calls for deeper investigation of this phenomenon in a broad range of systems, including polydisperse packings, consolidated soils and rocks, and more
4 | www.pnas.org/cgi/doi/10.1073/pnas.XXXXXXXXXX 373 374 375 376 377 378 379 380 381 382 383 384 385 386 387 388 389 390 391 392 393 394 395 396 397 398 399 400 401 402 403 404 405 406 407 408 409 410 411 412 413 414 415 416 417 418 419 420 421 422 423 424 425 426 427 428 429 430 431 432 433 434 435 436 437 438 439 440 441 442 443 444 445 446 447 448 449 450 451 452 453 454 455 456 457 458 459 460 461 462 463 464 465 466 467 468 469 470 471 472 473 474 475 476 477 478 479 480 481 482 483 484 485 486 487 488 489 490 491 492 493 494 495 496 Heyman et al.
DRAFT
complex flows, such as multiphase, inertial or non-Newtonian flows. While these cases may act to modify the rate of mixing, the fundamental kinematics described in this study should persist as they arise from basic fluid-grain interactions. The investigation of these system-specific modulations of chaotic mixing in porous matter form promising research perspectives.
Materials and Methods
Experimental protocol. The porous column consists of a
vertically-oriented rectangular column of cross section 48×48 mm (Fig.5),
containing monodisperse borosilicate glass beads (Sigmund Lindner GmbH) of diameter d = 7,10 or 20mm that are loosely and randomly packed via gravitational settling. The pore space between the beads is filled with a glycerol-water mixture (1.4%w/w water) at controlled temperature (T=25◦C). Fluid flow is driven by a constant pressure difference imposed between the inlet and outlet ports, respectively at the top and bottom of the column. The flow rate is continuously monitored at the outlet by a scale. Together with the knowledge of the packing porosity, this provides an estimate of the mean pore velocity, u. To visualize fluid flow and deformation through the bead pack, a solute fluorescent dye (PromoFluor-488LSS) is continuously injected in the upper part of the cell through a needle of internal
diameter L0 = 0.5 mm. The injected dye develops into a steady
plume downstream of the injection point. The mean flow velocity u is chosen to be sufficiently low to get small Reynolds numbers and
laminar flows (Re= ud/ν ≈ 5 · 10−3 1, where ν ≈ 700 cP is the
kinematic fluid viscosity), and fast enough for the dye Péclet number to be large and for fluid deformation to be measured from the dye backbone (Pe= ud/Dm≈ 8.6 · 103, where Dm≈ 2 · 10−11m2s−1is the molecular diffusivity of the dye in the glycerol-water mixture). For representativeness, experiments are repeated for multiple dye injection locations and for various packing realisations and bead
diameters, as summarised in SI Table S1. The coordinates of
the bead centres are determined via a three-dimensional Hough transform on the image stack obtained by the translational laser scan, where the background fluid fluorescence allows distinguishing the grains. From these coordinates, several structural properties of the porous media are obtained : φ , the solid volume fraction (the ratio of volume occupied by the beads over the total column
volume); zc, the coordination number (the number of neighbouring
beads whose centres lie d ± 5% away from the reference bead); dp,
the mean diameter of the largest sphere inscribed in the pore space, obtained by a distance transform computed on a voxelized image of the fluid phase.
Reconstruction of the dye filament backbone. In each cross-stream
section of the solute dye plume, a one-dimensional backbone of the dye filament is reconstructed via the adjustment of spline curves and its total length L is computed (Fig.2and Fig.6a). In experimental
run II (Fig. 2 and SI Video S1), the tracking is possible until
downstream distance x = 9.27 d (beyond which the diffusive filament
merges with itself), corresponding to a total elongation of L/L0≈
167 (Fig.2c), where L0 is the initial length of the dye filament
backbone.
Distribution of elongations. The sequential stretching and folding
process leading to exponential growth of the total filament back-bone length L implies that the length l of a fluid element follows
a multiplicative random process (28,32), such that l grows as
dl/dx∗= γl, where x∗= x/d and γ is a random, statistically
sta-tionary stretching rate of mean λ and variance σ2
λ. The length l
thus results from the product of the successive stretching rates γ, such that log l is the sum of a series of independent and identically distributed random variables. From the central limit theorem, the distribution of log l must then converge with downstream distance towards a normal distribution of mean λx0and variance σλ2x∗. This convergence is obtained after a few bead diameters since i) the dye filaments length increase exponentially and thus sample an increasingly large number of independent stretching rates in the pore space and ii) the stretching rates are distributed within pores, so that several independent stretching rates are experienced over
Camera
Outflow
Glass bead random packing
Steady Inflow Laser tracer injection Linear displacement stage x
Distance from injectio
n
Fig. 5. Experimental setup for
three-dimensional imaging of the mixing of a fluorescent solute dye in optically matched porous bead packs. The dye is contin-uously injected through a thin needle upstream of the gran-ular column, while maintaining a steady background laminar flow. After stabilisation of the solute dye plume, transverse cross-sections of concentrations are obtained by displacing a laser sheet (Oxxius, wavelength 488 nm, beam waist 50 µm) in thexdirection while recording the emmited fluorescence with a CMOS camera (Hamamatsu ORCA-Flash4.0 16bits) mounted with a band pass filter (Midopt BN532) and oriented at an an-gle of 45 degrees from the laser plane. The perspective view is then ortho-rectified by a projec-tive transform.
a unit diameter distance. The mean value of l is thus such that hli ∼ exp(µx∗) with µ = λ + σ2
λ/2, which sets the growth rate of
the total filament length to hL/L0i = exp(µx∗).
Number of high curvature regions. As shown in Fig. 1b, when the filament is advected through contact points between beads, localized regions of very high curvature develop in the filament backbone. We define cusps as isolated regions of the filament backbone where the curvature κ of the spline curve exceeds the threshold κ = 103d−1. We find (Fig.6c) that the total number ncof cusps in the filament
backbone increases exponentially with the downstream distance
x/d at a rate similar to that of the total filament length L. This
suggests that stretching and folding events occurs in proportion of each other and that the resulting process is statistically stationary.
Prediction of the mean stretching rates from the porous media prop-erties. Based on the consistently observed sequence of stretching
and folding in the pore space and its control by grain contacts
(Fig.1), we derive a general expression for the magnitude of the
Lyapunov exponent in random granular media as a function of the coordination number zc, the solid volume fraction φ, the grain
diam-eter d and the mean pore diamdiam-eter dp. Since segment lengths must
double, on average, each times the segment encounters a contact, that is for each distance Xc, the Lyapunov exponent can be derived
from equation Eq. (2) as λ = d log 2/Xc= d log 2/(Sc/Lc), which
requires estimating the mean segment length Lcand the mean
sur-face area Scswept by segments between successive contact points.
A geometric estimate for the mean segment length Lcis obtained
by assuming that an individual segment doubles its length at the constant exponential rate λ until it reaches the mean pore diameter
dpwhere it inevitably collides with a contact point located at Xc
downstream, e.g. Lc(x) = dp/2 exp(log 2 x/Xc). This expression
yields the average value
Lc≈
dp
2 log 2. [6]
From tomographic reconstruction of all the experimental runs, the
average pore diameter is dp ≈ 0.24 d (see Methods). Thus, we
estimate Lc ≈ 0.17d which is in excellent agreement with the
observations (Fig.3). To develop an estimate of Sc, we consider the
volume density ρV of contact points in the three-dimensional bead
pack. As the number of grains per unit volume is 6φ/(πd3) and
there are zc/2 independent contacts per grain, the volume density
of contact points is then ρV = 3φzc/(πd3). Conversely, Scis equal
497 498 499 500 501 502 503 504 505 506 507 508 509 510 511 512 513 514 515 516 517 518 519 520 521 522 523 524 525 526 527 528 529 530 531 532 533 534 535 536 537 538 539 540 541 542 543 544 545 546 547 548 549 550 551 552 553 554 555 556 557 558 559 560 561 562 563 564 565 566 567 568 569 570 571 572 573 574 575 576 577 578 579 580 581 582 583 584 585 586 587 588 589 590 591 592 593 594 595 596 597 598 599 600 601 602 603 604 605 606 607 608 609 610 611 612 613 614 615 616 617 618 619 620
DRAFT
a.
b.
c.
Fig. 6. a. Reconstruction of
fila-ment backbone (black line) from dye distribution and localisation of high curvature regions (red circles). b. Local curvature along the fila-ment backbone (black line) with isolated cusps (red circles) and threshold valueκ = 103d−1for cusp detection (dashed line). Note that the end-points of filaments are considered as cusps, explaining why red circles can exist below
κ. c. Exponential growth of the number (nc) of cusps in the
fila-ment backbone as a function of the advection distance (x/d) from the injection point. The fitted ex-ponent fornc(grey line) is similar
to that for the total filament length (dashed line), suggesting station-arity of the stretching and folding processes.
to the inverse of the areal density ρAof contact points in a filament
sheet. To develop a relationship between ρV and ρA, we consider a
series of filament sheets that arise from continuously injected line sources and extend along length Z in the cross-stream z-coordinate of the column, and are advected over distances X. These series of injection lines are also distributed along distance Y in the other cross-stream y-direction. If we consider the average number nV of
contact points in the volume V = XY Z, then the number nA of
contact points contained within a filament sheet is nA= ¯`/Y nV,
where ¯` is the average span of filament sheet in the y-direction that
pass through a common contact point. The simplest estimate for ¯`
is obtained by considering the behaviour of filament sheets in a open laminar flow over two spheres in contact at an angle α with the mean flow direction x. From symmetry arguments, the horizontal span `(α) is given by the projection in the plane normal to x of the contact line connecting the two sphere centres. Thus `(α) = d sin α, and ¯` is given by the mean of `(α) over the distribution of contact
angles. As ρV ≡ nV/(XY Z) and ρA≡ nA/(XY ), then ρA= ¯`ρV.
For isotropic packings, contact lines are uniformly orientated in the space, and α is distributed as p(α) = sin α. Averaging over this distribution then yields ¯` ≡ d sin α = dπ/4. From the results above, Scfor isotropic packings is then estimated as
Sc= 1/ρA=
πd3 3¯`φzc
. [7]
For anisotropic packings the distribution of contact orientations may deviates from sin α, thus yielding different values for ¯`. Eq. (7) and Eq. (6), provide the value of the mean fold distance Xc= Sc/Lc
and from Eq. (2), the Lyapunov exponent reads
λ = ¯`3φzcdp
2πd2 . [8]
Using the estimates of φ, zc and dp obtained from tomographic
reconstruction and ¯`/d = π/4 ≈ 0.78 for isotropic packings, equation
Eq. (8) yields λ = 0.27, a value comparable to the experimental estimate (λ = 0.21). The slight overestimate of λ can be explained by the anisotropy introduced by the gravitational packing of the
beads and the finite size of the experimental column. Indeed,
independent measurements of ρV = 2.86d−3 and of Sc= 0.58d2
(Fig. 3) indicate that, experimentally, ¯`/d = (dρVSc)−1 ≈ 0.6,
instead of ¯`/d = 0.78 expected for isotropic packings. Using this
value in Eq. (8) yields λ ≈ 0.21, in much better agreement with the experimental estimate.
ACKNOWLEDGMENTS. This research was funded by the Eu-rope Research Council grant ReactiveFronts (648377), ANR project Subsurface mixing and reactions (ANR-14-CE04-0003) and CPER project BUFFON. We thank J. Jimenez-Martinez and B. Geraud for their contributions in the early experimental design and con-struction.
1. Dentz M, Le Borgne T, Englert A, Bijeljic B (2011) Mixing, spreading and reaction in hetero-geneous media: A brief review. J. Cont. Hydrol. 120-121:1–17.
2. Rolle M, Le Borgne T (2019) Mixing and reactive fronts in the subsurface. Reviews in Miner-alogy and Geochemistry 85(1):111–142.
3. Valocchi AJ, Bolster D, Werth CJ (2019) Mixing-limited reactions in porous media. Transport in Porous Media 130(1):157–182.
4. Kitanidis PK, McCarty PL (2012) Delivery and mixing in the subsurface: processes and de-sign principles for in situ remediation. (Springer Science & Business Media) Vol. 4. 5. Gomez-Velez JD, Harvey JW, Cardenas MB, Kiel B (2015) Denitrification in the mississippi
river network controlled by flow through river bedforms. Nature Geoscience 8(12):941–945. 6. Datta S, et al. (2009) Redox trapping of arsenic during groundwater discharge in sediments
from the meghna riverbank in bangladesh. Proceedings of the National Academy of Sciences 106(40):16930–16935.
7. Matter JM, et al. (2016) Rapid carbon mineralization for permanent disposal of anthropogenic carbon dioxide emissions. Science 352(6291):1312–1314.
8. Szulczewski ML, MacMinn CW, Herzog HJ, Juanes R (2012) Lifetime of carbon capture and storage as a climate-change mitigation technology. Proc. Natl. Acad. Sci. 109(14):5185– 5189.
9. Stegen JC, et al. (2016) Groundwater–surface water mixing shifts ecological assembly pro-cesses and stimulates organic carbon turnover. Nature communications 7:11237. 10. Bochet O, et al. (2020) Iron-oxidizer hotspots formed by intermittent oxic–anoxic fluid mixing
in fractured rocks. Nature Geoscience pp. 1–7.
11. Borer B, Tecon R, Or D (2018) Spatial organization of bacterial populations in response to oxygen and carbon counter-gradients in pore networks. Nat. Commun. 9(1):769. 12. Drescher K, Shen Y, Bassler BL, Stone HA (2013) Biofilm streamers cause catastrophic
disruption of flow with consequences for environmental and medical systems. Proceedings of the National Academy of Sciences 110(11):4345–4350.
13. Anglin EJ, Cheng L, Freeman WR, Sailor MJ (2008) Porous silicon in drug delivery devices and materials. Adv. Drug Deliver. Rev. 60(11):1266–1277.
14. Braff WA, Bazant MZ, Buie CR (2013) Membrane-less hydrogen bromine flow battery. Nature communications 4(1):1–6.
15. Meirer F, Weckhuysen BM (2018) Spatial and temporal exploration of heterogeneous cata-lysts with synchrotron radiation. Nature Rev. Mater. p. 1.
16. Gramling CM, Harvey CF, Meigs LC (2002) Reactive transport in porous media: A compar-ison of model prediction with laboratory visualization. Environ. Sci. Technol. 36(11):2508– 2514.
17. Berkowitz B, Dror I, Hansen SK, Scher H (2016) Measurements and models of reactive trans-port in geological media. Reviews of Geophysics 54(4):930–986.
18. Wright EE, Richter DH, Bolster D (2017) Effects of incomplete mixing on reactive transport in flows through heterogeneous porous media. Physical Review Fluids 2(11):114501. 19. Lester DR, Metcalfe G, Trefry MG (2013) Is chaotic advection inherent to porous media flow?
Phys. Rev. Lett. 111(17):174101.
20. Turuban R, Lester DR, Le Borgne T, Méheust Y (2018) Space-group symmetries generate chaotic fluid advection in crystalline granular media. Phys. Rev. Lett. 120(2):024501. 21. Whitman WB, Coleman DC, Wiebe WJ (1998) Prokaryotes: the unseen majority. Proc. Natl.
Acad. Sci. 95(12):6578–6583.
22. Tel T, de Moura A, Grebogi C, Károlyi G (2005) Chemical and biological activity in open flows: A dynamical system approach. Phys. Rep. 413:91–196.
23. Stocker R (2012) Marine microbes see a sea of gradients. Science 338:6107.
24. Boon M, Bijeljic B, Niu B, Krevor S (2016) Observations of 3-D transverse dispersion and dilution in natural consolidated rock by x-ray tomography. Adv. Water Resour. 96:266 – 281. 25. Kree M, Villermaux E (2017) Scalar mixtures in porous media. Phys. Rev. Fluids
2(10):104502.
26. Ottino J (1990) Mixing, chaotic advection, and turbulence. Annu. Rev. Fluid Mech. 22:207– 253.
27. Turuban R, Lester DR, Heyman J, Borgne TL, Meheust Y (2019) Chaotic mixing in crystalline granular media. J. Fluid Mech. 871:562–594.
28. Meunier P, Villermaux E (2010) The diffusive strip method for scalar mixing in two dimensions. J Fluid Mech. 662:134–172.
29. Cushman JH (2013) The physics of fluids in hierarchical porous media: Angstroms to miles. (Springer Science & Business Media).
30. de Anna P, et al. (2013) Mixing and reaction kinetics in porous media: an experimental pore scale quantification. Environ. Sci. Technol. 48(1):508–516.
31. Le Borgne T, Dentz M, Villermaux E (2013) Stretching, coalescence and mixing in porous media. Phys. Rev. Lett. 110:204501.
32. Le Borgne T, Dentz M, Villermaux E (2015) The lamellar description of mixing in porous media. J. Fluid Mech. 770:458–498.
33. Lester DR, Dentz M, Le Borgne T (2016) Chaotic mixing in three-dimensional porous media. J. Fluid Mech. 803:144–174.
34. Stroock AD, et al. (2002) Chaotic mixer for microchannels. Science 295(5555):647–651. 35. Jones S, Young W (1994) Shear dispersion and anomalous diffusion by chaotic advection. J.
Fluid Mech. 280:149–172.
36. Ouellette NT, O’Malley P, Gollub JP (2008) Transport of finite-sized particles in chaotic flow. Phys. Rev. Lett. 101(17):174504.
6 | www.pnas.org/cgi/doi/10.1073/pnas.XXXXXXXXXX 621 622 623 624 625 626 627 628 629 630 631 632 633 634 635 636 637 638 639 640 641 642 643 644 645 646 647 648 649 650 651 652 653 654 655 656 657 658 659 660 661 662 663 664 665 666 667 668 669 670 671 672 673 674 675 676 677 678 679 680 681 682 683 684 685 686 687 688 689 690 691 692 693 694 695 696 697 698 699 700 701 702 703 704 705 706 707 708 709 710 711 712 713 714 715 716 717 718 719 720 721 722 723 724 725 726 727 728 729 730 731 732 733 734 735 736 737 738 739 740 741 742 743 744 Heyman et al.