HAL Id: hal-00330913
https://hal.archives-ouvertes.fr/hal-00330913
Submitted on 19 Dec 2005
HAL is a multi-disciplinary open access
archive for the deposit and dissemination of
sci-entific research documents, whether they are
pub-lished or not. The documents may come from
teaching and research institutions in France or
abroad, or from public or private research centers.
L’archive ouverte pluridisciplinaire HAL, est
destinée au dépôt et à la diffusion de documents
scientifiques de niveau recherche, publiés ou non,
émanant des établissements d’enseignement et de
recherche français ou étrangers, des laboratoires
publics ou privés.
casualties from explosive volcanic eruptions
R. J. S. Spence, I. Kelman, E. Calogero, G. Toyos, P. J. Baxter, J.-C.
Komorowski
To cite this version:
R. J. S. Spence, I. Kelman, E. Calogero, G. Toyos, P. J. Baxter, et al.. Modelling expected physical
impacts and human casualties from explosive volcanic eruptions. Natural Hazards and Earth System
Science, Copernicus Publications on behalf of the European Geosciences Union, 2005, 5 (6),
pp.1003-1015. �hal-00330913�
European Geosciences Union
© 2005 Author(s). This work is licensed under a Creative Commons License.
and Earth
System Sciences
Modelling expected physical impacts and human casualties from
explosive volcanic eruptions
R. J. S. Spence1, I. Kelman1, E. Calogero1, G. Toyos1, P. J. Baxter2, and J.-C. Komorowski3 1Department of Architecture, University of Cambridge, Cambridge, UK
2Institute of Public Health, University of Cambridge, Cambridge, UK
3Institut de Physique du Globe de Paris, CNRS UMR 7154, Volcanology Group, Paris, France
Received: 1 August 2005 – Revised: 26 September 2005 – Accepted: 10 October 2005 – Published: 19 December 2005
Abstract. A multi-hazard, multi-vulnerability impact model
has been developed for application to European volcanoes that could significantly damage human settlements. This im-pact model is based on volcanological analyses of the po-tential hazards and hazard intensities coupled with engineer-ing analyses of the vulnerability to these hazards of residen-tial buildings in four European locations threatened by ex-plosive volcanic eruptions. For a given case study site, in-puts to the model are population data, building characteris-tics, volcano scenarios as a series of hazard intensities, and scenarios such as the time of eruption or the percentage of the population which has been evacuated. Outputs are the rates of fatalities, seriously injured casualties, and destroyed buildings for a given scenario. These results are displayed in a GIS, thereby presenting risk maps which are easy to use for presenting to public officials, the media, and the public. Technical limitations of the model are discussed and future planned developments are considered. This work contributes to the EU-funded project EXPLORIS (Explosive Eruption Risk and Decision Support for EU Populations Threatened by Volcanoes, EVR1-2001-00047).
1 Introduction
Several European settlements are at risk from the impact of explosive volcanic eruptions. A response to this threat is re-quired from national and local Civil Protection authorities. Civil Protection agencies need to develop an understanding of both the scale of eruption which could take place (most probable scenarios and extreme but less probable scenar-ios) and their associated hazards. They need also to know what impact each possible style of eruption may have on the territory and the human settlements which it will affect, in terms of possible damage to buildings and other built facil-Correspondence to: R. J. S. Spence
ities along with casualties amongst the population who may remain in the area during an eruption.
Increasingly, eruption models are able to provide, for an assumed eruption scenario, a detailed map of the possible ge-ographical distribution of the eruption products, with point-by-point estimates of the key parameters: depth and compo-sition of tephra fall (Macedonio and Costa, 2005); dynamic pressure, velocity and particle concentration in pyroclastic flows (Esposti Ongaro et al., 2004); and time sequences of these variables. Where these parameters are known, it be-comes possible to develop estimates of the impact of the eruption on buildings and infrastructure, and also on their occupants.
Previous studies, concentrating on Vesuvius, Italy have shown how, given an understanding of the distribution of a pyroclastic flow’s dynamic pressure with distance from the volcano, the possible impact of an explosive eruption involv-ing pyroclastic flows can be assessed, and how consequent human casualties might be estimated (Spence et al., 2004a, b). This work was based on an earlier 2-dimensional model of the volcano and the run-out of its eruption products (Es-posti Ongario et al., 2002; Todesco et al., 2002).
Work under the EU-funded EXPLORIS project (Explo-sive Eruption Risk and Decision Support for EU Popula-tions Threatened by Volcanoes, EVR1-2001-00047) has de-veloped a new 3-dimensional eruption model for Vesuvius (Esposti Ongaro et al., 2004), as well as a new, more detailed tephra dispersion and fallout model for the same volcano (Macedonio and Costa, 2005). EXPLORIS also extends the eruption modelling to three other European volcanoes: Teide on the Spanish island of Tenerife, Soufri`ere on the French is-land of Guadeloupe, and Sete Cidades on S˜ao Miguel in the Portuguese Azores.
This volcanic hazard research has been complemented by the development of a new computer model for the estimation of the impacts on the potentially affected territories. This paper describes this model. During the project, it is antic-ipated to apply the model to look at impacts from possible eruptions at each of the four volcanoes, and to consider the
Population and building exposure Building vulnerability relationships Human vulnerability relationships
GIS maps of tephra, pyroclastic flow, and earthquake intensity levels
GIS maps of population distribution and building
stock classifications
Impact definition: GIS map and database
Mitigation measures and policy recommendations Volcanic hazard scenario definition
Fig. 1. The general structure of the impact model.
effectiveness of alternative mitigation options, producing re-sults of direct relevance to the needs of Civil Protection agen-cies in each location.
The overall aims of the model are to develop a tool for estimating property damage and human casualties resulting from defined volcanic hazard scenarios. The model is de-signed to be applicable to the somewhat diverse conditions of the four volcanoes in terms of possible eruption styles and the types of buildings and settlements that could be affected. It is also designed to consider the impact of three separate types of volcanic hazards which can be expected to occur – tephra fall, pyroclastic flows and volcanogenic earthquakes – as well as to estimate property damage and human casualties. It is linked to a GIS mapping tool that enables maps of the inputs and the outputs to be displayed.
At the present time, the model is concerned with impacts on buildings (primarily residential buildings) and does not in-clude effects on other infrastructure. It concentrates on haz-ards which are likely to accompany explosive eruptions, and therefore does not consider lava flows while also excluding post-eruption hazards such as floods, lahars and mudslides. Additionally, it produces a single composite estimate of dam-age and casualties as a result of an eruption which may last for some period of time.
In this paper, the model’s structure is described and an ex-ample is given of applying the model to part of the poten-tially affected area for one of the four volcanoes, Soufri`ere of Guadeloupe. The structure of the data to input into the model is described; the way in which ground surveys were used to create the data needed is explained; the approach to vulnera-bility assessment for each of the hazards is briefly reviewed; and the results of two hypothetical eruption scenarios are pre-sented. Other papers give more detail on the development of the vulnerability functions (Spence et al., 2005a, b1).
Apply-1Spence, R. J. S., Kelman, I., Brown, A., Purser, D., Baxter, P. J.,
and Calogero, E.: Residential building and occupant vulnerability to pyroclastic flow hazards, in preparation, 2005b.
ing the model to realistic eruption scenarios will be presented in future papers.
The work described in this paper was conducted within the EU-funded project EXPLORIS.
2 Structure of the model
Figure 1 shows the overall structure of the impact model. The impacted area is divided into several impact zones. The number of zones depends on the level of definition of the input data (on volcanic hazards, building stock, and popula-tion exposure) and on the output required. In the applicapopula-tion described here, used to test the model, five impact zones in Guadeloupe were used. This is sufficient to capture the prin-cipal differences in building stock with limited hazard data available. As the volcanic hazard data become more detailed, a larger number of zones would be needed.
For each impact zone, three different types of input are required:
– Volcanic hazard scenario definitions, – Exposure data for buildings and population,
– Vulnerability data for building damage and human
ca-sualties.
2.1 Volcanic hazard scenario definitions
The volcanic hazard scenario is defined in each zone by a single intensity value for each of the three principal hazards affecting building damage. A fourth intensity value primarily governs casualty generation, but does not significantly affect property damage.
The three hazards affecting building damage are tephra fall load, pyroclastic flow pressure, and earthquake ground shak-ing. An intensity scale for each of these three hazards has been devised, each intensity level defining a range of values of the principal measure of the parameter concerned. Ranges are not all of uniform interval, so that effects from the small-est hazard level, which will have some consequences, up to the largest foreseeable hazard level can be incorporated within a scale with a maximum of 7 scale points of 1 to 7. Each intensity can also be set to zero, implying that this haz-ard is not present, or is insignificant, in the chosen scenario.
For tephra fall, the parameter chosen is vertical gravita-tional load acting on the roofs in the area, measured in Pa. It is the load which directly influences the roof damage. Tephra fall eruption models do not always define load; commonly, only tephra fall depth is calculated. In this case, an assump-tion needs to be made about the density of the fallen tephra, which may or may not be wet, or alternative assumptions made in order to calculate load. This value is given as an av-erage value for the whole of the impact zone. The tephra fall intensity scale used is shown in Table 1. A tephra fall load of 10 kPa (intensity 7) is likely to cause virtually all roofs to collapse (see Sect. 5.1).
Table 1. Defined intensity levels for each hazard.
Intensity level 0 1 2 3 4 5 6 7
Tephra fall load (kPa) 0 1 2 3 4 6 8 10
Pyroclastic flow pressure (kPa) 0 0.5 1 1.5 2 3 4 6 External Heat Flux (EHF)
(min◦C) 0 200 400 600 800 1000 1500 2000
Earthquake Intensity (EMS) 0 V VI VII VIII IX
For pyroclastic flow pressure, the pressure level which needs to be defined is the pressure at the level of ground floor windows (Pa), generally 1–2 m above ground floor level. This value, again, is given as an average value for the whole of the impact zone. The effects of urban sheltering and flow turbulence ensure that there is wide variation in this value, even within a short distance. The use of a single value is therefore controversial. Alternative models of the local ef-fects of urban sheltering are currently being considered (Zuc-caro and Calogero, 20052), but a simple zonal model is not able to incorporate such detailed local variation at present. The model incorporates the assumption that the vertical pro-file of pyroclastic flow pressure, which is used to assess the impact on upper floor windows, is uniform. This assump-tion is discussed in Sect. 8. Table 1 shows the intensity scale used for pyroclastic flow pressure. The pressure associated with intensity 7 is not the maximum which could occur, but it would be enough to destroy most buildings in this area.
For earthquakes, the effects on buildings are reasonably well-defined by the use of well-known macroseismic inten-sity scales. This model uses the European Macroseismic Scale (EMS; Gr¨unthal, 1998) which divides the level of ground shaking into 12 scale points, I to XII. Since the scale’s lower levels do not affect buildings and since the upper lev-els are not thought likely to be experienced in volcanic erup-tions, a truncated version of the scale has been adopted for this model which has then been renumbered to yield intensity levels (see Table 1). Again, a uniform intensity throughout the impact zone is assumed.
The fourth input parameter needed to define human casu-alties is the External Heat Flux (EHF) which is a measure of the combined effect of flow temperature and duration on the buildings affected. EHF governs the internal conditions and survivability for occupants and is fully defined in Sect. 6. The EHF intensity scale adopted for this model is shown in Ta-ble 1. Again, an average value over the whole of the impact zone is required. An EHF value exceeding 2000 (intensity 7) would be lethal to all occupants, even in relatively well-sealed buildings.
2Zuccaro, G. and Calogero, E.: An Urban Sheltering Index for
pyroclastic flow impacts estimation, in preparation, 2005.
2.2 Exposure data
For each impact zone, exposure data are required in terms of numbers of buildings and their occupants. Because the impact of each of the hazards on any building is dependent on the building’s construction, several building classes have been defined, as described in Sect. 3. Typically, twenty sep-arate classes of buildings need to be defined to capture all the important differences arising from different forms of con-struction, age and number of stories. Thus, the exposure data required are the number of buildings of each class in each zone. Occupant data are also needed, which is defined in terms of the number of occupants in each building.
The way in which exposure data are collected depends on the availability of existing building stock databases or map-ping in any given location. This availability may influence the choice of impact zones. In any case, additional ground surveys are likely to be needed to identify all the important characteristics of each building class. The method imple-mented for Soufri`ere of Guadeloupe is discussed in Sect. 4. 2.3 Vulnerability data
To determine the impact of each volcanic hazard on the build-ings and occupants, vulnerability relationships are required to estimate the effects at each intensity level for each hazard. These are discussed in Sects. 5 and 6. Each vulnerability re-lationship is specific to a building class and is applicable to the whole area, without zone-by-zone variation.
2.4 Estimating impact
Given the hazard intensity level, the buildings and occu-pants at risk, and the vulnerability relationships, estimating impacts for each building type and each zone is relatively straightforward. These can be summed to estimate the im-pact in each zone. A joint probability approach is used to sum impacts from the separate hazards, treating them as in-dependent events. Implications are discussed in Sect. 7. The calculations are performed in an Excel spreadsheet.
Epistemic and aleatoric uncertainties in the model have been taken into account by allowing for each parameter (haz-ard, vulnerability and building classification) to be input as a probability distribution rather than as a single value, so that a range of impacts can be derived from multiple runs. GIS
Table 2. Classes of construction material for the vertical
load-bearing frame and their identifiers.
Field Type Other descriptive
name notes
CF Reinforced concrete, infilled frame CS Reinforced concrete, shear wall
MB Masonry, block/squared/cut stone unreinforced MC Masonry, confined or reinforced reinforced MR Masonry, rubble
ST Steel Frame
TI Timber with lightweight
cladding
maps of the results can then be produced directly from the output tables. Examples are shown in Sect. 7.
2.5 Evaluating mitigation options
Mitigation actions which can be defined in terms of a change in one or more of the input parameters – building stock, oc-cupancy or vulnerability – can be evaluated by examining the effects on the overall or local impacts of any given scenario. This can inform policy decisions such as the implementa-tion of early warning systems and evacuaimplementa-tion plans as well as long-term preventive and protective measures to buildings that can be managed by legislation such as building control or by insurance preconditions. Some possible options are discussed in Sect. 8.
3 Classification of the building stock
The aim of the building classification system was to devise a single system which could be used in all four of the EX-PLORIS volcanoes and which would also be applicable to other locations. The approach needed to be sufficiently de-tailed to allow for the main variations between buildings af-fecting their response to the volcanic hazards, but not so de-tailed as to lead to a huge number of classes. From surveys of building stock for similar work in many locations (e.g. Pomonis et al., 1999), it has been found that three principal characteristics of a building are often primary, and that other characteristics can be assumed to be subsidiary, or can be derived from the primary classification. The three primary characteristics are:
– Materials of construction of the vertical load-bearing
structure,
– Height (defined by number of storeys), – Age.
For each primary characteristic, to keep total numbers of classes to an acceptably small number, a small number of alternatives needs to be defined.
Table 3. Classes of building height and their identifiers.
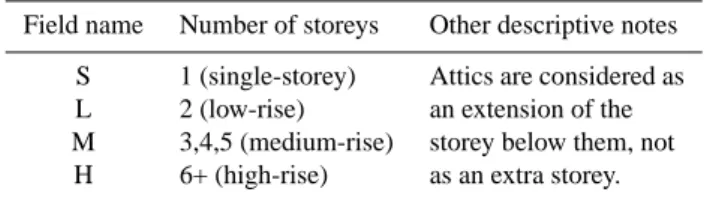
Field name Number of storeys Other descriptive notes S 1 (single-storey) Attics are considered as L 2 (low-rise) an extension of the M 3,4,5 (medium-rise) storey below them, not H 6+ (high-rise) as an extra storey.
Seven classes of construction material were considered significant (Table 2). A two-letter code was adopted for each class. Each of these classes can be considered to have differ-ent responses to both pyroclastic flow pressure and to earth-quakes.
Four alternative height ranges were distinguished (Ta-ble 3). The height of a building is significant for its response to pyroclastic flow pressure and for the impact of roof failure. Four possible age-groups were identified to allow for change in the probable performance of each building type as a result of changes in building technology or regulations. The epochs of construction and the dates of significant change were different in different locations (Table 4).
By combining the field name codes for each primary char-acteristic, each class has a four-letter identifier. Thus, for the Vesuvius region, MRLO, a significant class in the area, refers to rubble masonry, low rise (two-storey), and built be-fore 1920. In theory, this classification system leads to a total of 7×4×4=112 separate classes. In each area, some classes were empty or had insignificant numbers, leading to a total of around twenty significant separate classes for each vol-cano area.
Several characteristics of importance were not in the pri-mary classification, such as the type and sizes of opening and roof construction. These characteristics were considered to be derived from the principal classes by means of a set of probability distributions, determined through field work and engineering calculations. Thus, the class MRLO was considered to have an 80/20 split of roofs between the class “weak” and the class “medium-weak”, defining separate per-formance under tephra load (see Sect. 5).
Information on the distribution of primary and derived characteristics of the buildings in each volcanic area were derived by means of a field survey. An example of how such a survey was carried out, for a particular volcanic risk area, that of Soufri`ere Guadeloupe, is discussed in Sect. 4.
4 Developing the GIS building stock inventory
A field survey was undertaken for each of the four EX-PLORIS volcanoes. This section presents a sample proce-dure carried out on Guadeloupe to examine possible impacts from an eruption of the Soufri`ere volcano. The results of the survey were then used to classify the building stock accord-ing to the three primary characteristics presented in Sect. 3.
Table 4. Age groups adopted for specific volcanoes and their identifiers.
Field name Guadeloupe age band Vesuvius age band S˜ao Miguel age band Tenerife age band
O (old) pre-1930 pre-1920 pre-1950 pre-1930
I (intermediate) none 1920–1940 none none
M (modern) 1930–1976 1940–1990 1950–1990 1930–1980
R (recent) post-1976 post-1990 post-1990 post-1980
Table 5. Data collected from building surveys.
Data collected Sample categories Reasons for collection
Structural type CF, CS, TI, MB, MR See Sect. 3.
Building height 4 categories See Sect. 3.
Building age recent, medium, old See Sect. 3.
Air conditioning present or not For pyroclastic flow infiltration vulnerability. Building use residential or mixed For population estimation.
Roof type timber, concrete, coverings For tephra strength (see Sect. 5). Combustible materials present or not For fire hazard estimation. Distance between buildings <6 m, 6–10 m, >10 m For fire hazard estimation. Opening sizes small (<0.7 m2)
medium (0.7–1.5 m2)
large (>1.5 m2)
For pyroclastic flow vulnerability.
Types of window frames metal or timber For pyroclastic flow vulnerability. Type of shutters solid, louvred or roller For pyroclastic flow vulnerability. Condition of openings good or poor For pyroclastic flow vulnerability.
The survey data were entered into a georeferenced database that could be analysed to give spatial and graphical repre-sentations of building class distributions by zone. This GIS-based inventory would determine the exposure present in the areas most at risk to volcanic hazards. As a result, it would influence any impact estimation derived from it.
4.1 Sample survey
The survey was designed to collect data on not only the pri-mary characteristics defined in Sect. 3, but also additional information about subsidiary characteristics of significance in assessing impacts. A list of the information collected is shown in Table 5. Such information was collected by send-ing out teams of two people to at least twenty predefined lo-cation points where twenty buildings for each lolo-cation point were chosen to represent the area surveyed by the teams. 4.2 Mapping procedure
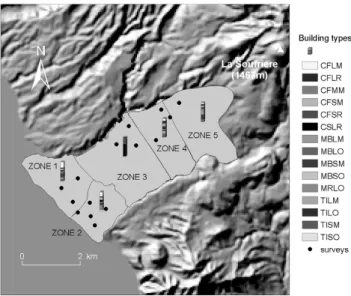
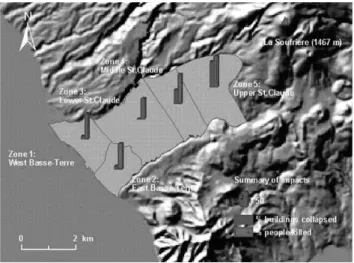
Survey location points were chosen and survey zones were defined by dividing the area under consideration, in this case Basse-Terre and St. Claude in Guadeloupe (see Fig. 2), into zones of comparable size that show differentiation in general urban morphological characteristics that also denote changes in construction typologies (see Fig. 2). In this case, it was considered that five zones would be sufficient for a robust characterisation of the distribution of building types present.
Fig. 2. Survey locations, vulnerability zones, and building class
distribution in Basse-Terre and St. Claude on Guadeloupe.
4.3 Example for Soufri`ere, Guadeloupe
Figure 2 further shows the results of the field survey, illus-trating the distribution of building classes among the five de-fined zones. The map shows that building typology distri-bution varies significantly from zone to zone, demonstrating the greater diversity of building classes in the downtown area
Table 6. Classification of roofs, typical design loads and mean collapse loads estimated.
Roof class Description Typical design
load range
Mean collapse load
WE (weak) Sheet roofs, old or in poor condition. Tiled roof, old or in poor condition. Masonry vaulted roof.
Pre-design code, or no design code.
2.0 kPa
MW (medium weak) Sheet roof on timber; average quality; average or good quality tiled roof on timber rafters or trusses.
Steel or precast reinforced concrete joists and flat ter-race roof.
1–2 kPa 3.0 kPa
MS (medium strong) Flat reinforced concrete roof not all above characteris-tics; sloping reinforced concrete roof.
Sheet roof on timber rafters or trusses, good quality and condition, designed for cyclone areas.
2–3 kPa 4.5 kPa
ST (strong) Flat reinforced concrete roof designed for access; re-cent, good quality construction, younger than 20 years.
>3 kPa 7.0 kPa
of Basse-Terre (zones 1 and 2) with a relatively high propor-tion of old and weak building types and greater urban den-sity. The suburban area between Basse-Terre and St. Claude with lower density shows a greater homogeneity of building types of more recent and robust construction (zone 3). St. Claude, a mix of both historic and recent settlements, also illustrates a diversity of building classes, but to a lesser de-gree than downtown Basse-Terre, with a higher proportion of robust and recent construction typologies (zones 4 and 5). Such information could play a significant role on the impact of a future eruption (see Sect. 7).
The complete residential building inventory in each im-pact zone was derived from a GIS map and building inven-tory made available by Guadeloupe’s Department of Build-ing and PlannBuild-ing (DDE Guadeloupe). From this map along with data from the INSEE (France) 1999 census for Guade-loupe, the number of residential buildings in each of the impact zones and the expected average building occupancy were determined. For each zone, the distribution of primary vulnerability classes was assumed to be the same as that of the buildings in the surveys carried out in that zone.
5 Defining physical vulnerability of buildings
Two different types of vulnerability needed to be defined, vulnerability of buildings to physical damage and vulnerabil-ity of occupants. Occupant vulnerabilvulnerabil-ity is in some respects dependent on physical damage to buildings and is considered in Sect. 6.
The physical vulnerability of buildings needs to defined in terms of damage states. A vulnerability function for a class of building defines the probability of that building being in a particular damage state, given the intensity level of the partic-ular hazard concerned. The important hazards as far as phys-ical damage is concerned (for explosive eruptions) are tephra fall, pyroclastic flow pressure, and earthquake ground
shak-ing. A detailed account of the development of the vulnerabil-ity relationships for each of these hazards is given elsewhere, (Spence et al., 2005b1) so the account in this section will be summarised.
5.1 Vulnerability to tephra fall
The approach to tephra fall used is described in Spence et al. (2005a). Separate vulnerability relationships are defined for four classes of roofs, defined as weak, medium-weak, medium-strong and strong. The relationship of these gen-eral classes to the specific roof types found in the European area is shown in Table 6. Table 6 also indicates the typical range of loads which the class might be designed for, and an estimate of the mean value of the collapse load.
The only damage state considered for tephra fall is the damage state of collapse, meaning “the failure of a major structural element” such that “the roof covering and the struc-tural members supporting it will fall inwards along with the thick tephra layer above” (Spence et al., 2005a). The col-lapse damage state will be reached even if the roof colcol-lapse is confined to part of the building, e.g. one room. The focus is on this damage state because it is only roof collapse which leads to significant casualties. Figure 3 shows the vulnera-bility of each of the four roof classes as a function of tephra load (from Spence et al., 2005a).
5.2 Vulnerability to pyroclastic flow
Four physical damage states are of importance for assess-ing the impact of pyroclastic flow pressure. As pressure increases, the first damage state occurs when glazed open-ings start to fail, allowing pyroclastic flow materials to in-vade building interiors. A second damage state occurs when shuttered openings and solid doors fail. As pressure further increases, wall panels without opening may begin to fail, a third damage state. As pressure increases still further, roofs
Table 7. Typical resistances of buildings and building elements to pyroclastic flow pressure (after Spence et al., 2004b).
Building elements Expected resistance (kPa)
Window glass of ordinary buildings. 1.0–2.5
Aluminium window in bad condition. 1.5
Aluminium window in good condition. 3.0
Old wooden door. 3.5
Old wooden window. 5.0
Weak non-aseismic reinforced concrete buildings (1 to 3 storeys). 4.5–8 Terracotta tile in-fill panel without window. 5.5 Strong non-aseismic reinforced concrete buildings (4 to 7 storeys). 5–9 Terra cotta tile in-fill panel with window. 7.6–8.9 Weak aseismic reinforced concrete buildings (multi-storey). 5–10
Tuff masonry wall (600 mm). 10–13
Strong aseismic reinforced concrete buildings (multi-storey). 6–14
Volcanic masonry wall (600 mm). 20–26
Fig. 3. Vulnerability curves for roof collapse from tephra fall (from
Spence et al., 2005a).
and whole buildings may fail, the fourth damage state. Ta-ble 7 (after Spence et al., 2004b) shows in broad terms what level of damage to different classes of buildings or compo-nents can be expected as a result of increasing peak flow pressures.
The development of vulnerability relationships for each of these damage states, based on both calculation and on exper-iment, is given in Spence et al. (2004a, b). Further develop-ment is given in Spence et al. (2005b)1. Different vulnerabil-ity curves apply to different types of construction and sizes of opening.
Two important modifiers are temperature and missiles. The effect of a high flow temperature is to expand and dis-tort glazed openings, reducing the lateral pressure needed to cause failure. Missiles carried by the pyroclastic flow will also increase the risk of glazing failure at any given flow pressure. The way in which these modifiers are taken into account is discussed elsewhere (Spence et al., 2005b1).
Fig-Fig. 4. Typical vulnerability curve for glazed openings (from Spence et al., 2004b).
ure 4 (from Spence et al., 2004b) shows an example of the vulnerability curves proposed for glazed openings. Figure 5 shows the curves for wall panel failure, based on particular conditions. Expected temperature and missile “availability” are needed as inputs to the model. Alternatively, a default can be used based on expert judgement.
5.3 Vulnerability to earthquake
For the purpose of estimating human casualties for earth-quakes, the only damage states of importance are collapse and partial collapse. For the different classes of buildings found in Europe, damage probability matrices have been de-veloped relating probability of collapse and partial collapse to the macroseismic intensity. These are presented, for the Vesuvian area, by Zuccaro et al. (2000). Table 8 shows characteristic data for rubble stone masonry buildings, giv-ing probability of collapse or partial collapse, derived from the European Macroseismic Scale.
Table 8. Probability of collapse or partial collapse of buildings of different vulnerability classes, based on the European Macroseismic Scale.
EMS vulnerability class EXPLORIS building classes Intensity VII Intensity VIII Intensity IX
A MR 5% 35% 70%
B MBO 2% 5% 35%
C MBR 0% 2% 5%
D, E CF, CS, TI 0% 0% 2%
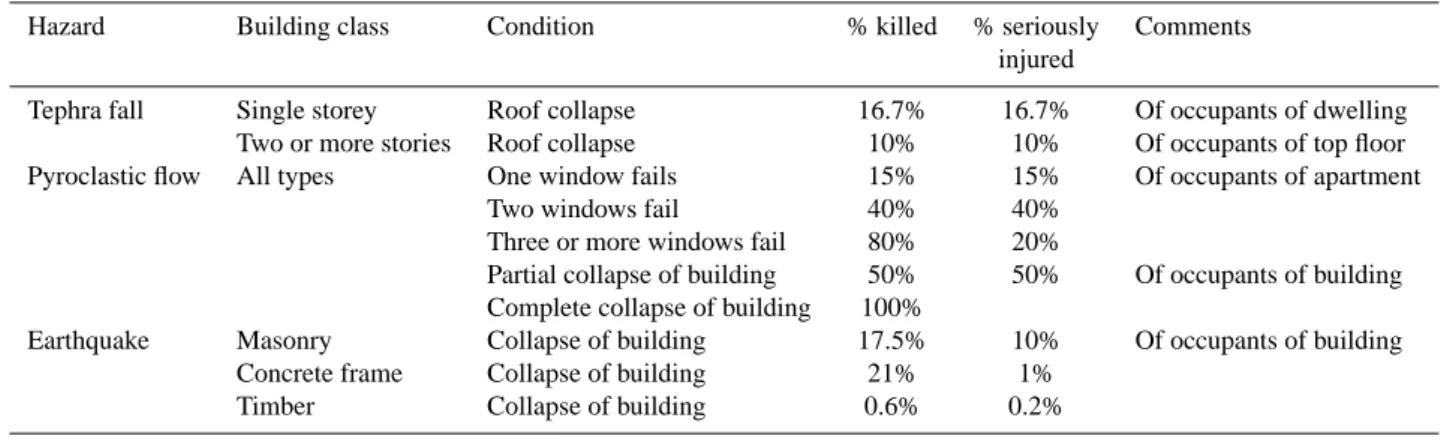
Table 9. Estimates of the human casualty consequences of volcanic hazards.
Hazard Building class Condition % killed % seriously Comments
injured
Tephra fall Single storey Roof collapse 16.7% 16.7% Of occupants of dwelling Two or more stories Roof collapse 10% 10% Of occupants of top floor Pyroclastic flow All types One window fails 15% 15% Of occupants of apartment
Two windows fail 40% 40%
Three or more windows fail 80% 20%
Partial collapse of building 50% 50% Of occupants of building Complete collapse of building 100%
Earthquake Masonry Collapse of building 17.5% 10% Of occupants of building
Concrete frame Collapse of building 21% 1%
Timber Collapse of building 0.6% 0.2%
Fig. 5. Typical vulnerability curves for failure of masonry walls or
infill wall panels under a pyroclastic flow’s dynamic pressure.
6 Human vulnerability
Given that the main purpose of the model is to estimate po-tential loss of life and serious injury (injuries requiring med-ical intervention for survival) from the volcanic hazards, es-timates are needed of the likely impacts on the building oc-cupants at the time of the event or events. For the three haz-ards discussed in the previous section, estimates have been made of the consequences, in terms both of deaths and seri-ous injuries, which would be likely to result from each level of physical damage. Table 9 summarises these estimates.
Justification for the casualty estimates presented in Ta-ble 9 is given elsewhere. For tephra fall casualties, estimates
derive from studies of the effects of roof collapse in earth-quakes, but also from evidence from the Mt Pinatubo erup-tion (Spence et al., 2005a). Estimates of casualties arising from invasion of ash into dwellings derive partly from obser-vations of the effects of ash invasion in the Montserrat erup-tion (Baxter et al., 2005). Casualties arising from collapse or partial collapse in earthquakes derive from casualty studies in tectonic earthquakes (Coburn and Spence, 2002). Other background is given in Spence et al. (2004a, b, 2005b1).
One important source of expected casualties in a pyro-clastic flow does not relate directly from building damage, but from the infiltration of the hot pyroclastic flow materials into the interior of buildings, through the normal ventilation process of air exchange between the inside and outside of a building. The flow’s potential to cause death and injury has been found to relate both to the temperature and duration of the pyroclastic flow, and also to the building’s ventilation rate.
A parameter, called the External Heat Flux (EHF), has been found to be a good predictor of the casualty rates for a building with a given ventilation rate. EHF is defined as EHF=∫t (T -175) dt where T is the temperature in◦C and t is the time.
A preliminary estimate of the expected casualty rate from this infiltration hazard is given in Fig. 6, for buildings with three different levels of ventilation rate. The full justification of these curves and a discussion of the EHF concept is found in Spence et al. (2005b)1.
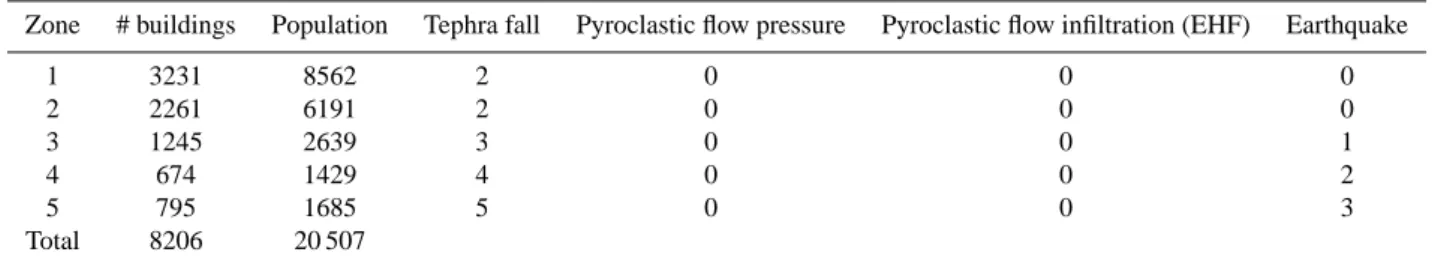
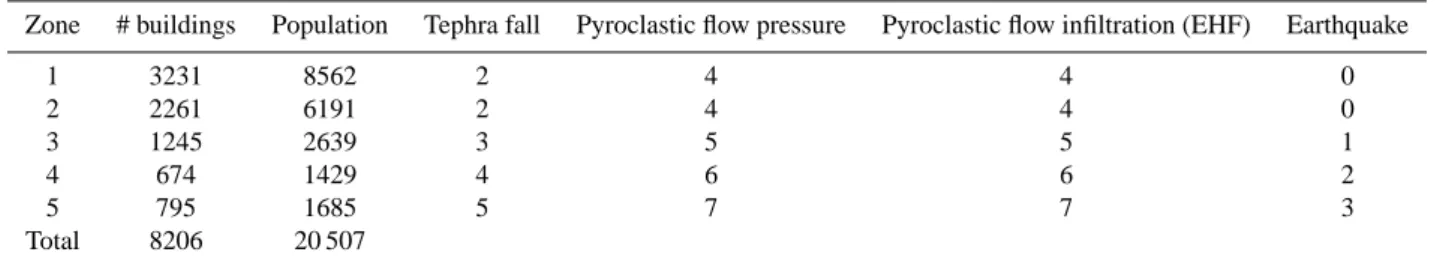
Table 10. Case 1’s model inputs, with the volcanic hazards defined as intensities (see Table 1).
Zone # buildings Population Tephra fall Pyroclastic flow pressure Pyroclastic flow infiltration (EHF) Earthquake
1 3231 8562 2 0 0 0 2 2261 6191 2 0 0 0 3 1245 2639 3 0 0 1 4 674 1429 4 0 0 2 5 795 1685 5 0 0 3 Total 8206 20 507
Table 11. Case 1’s model outputs.
Zone % buildings collapsed # buildings collapsed % killed # killed
1 9% 294 0% 40 2 12% 263 1% 51 3 0% 5 0% 1 4 45% 302 5% 77 5 78% 622 9% 147 Total 1487 316
7 Sample results for hypothetical eruption scenarios
Results for hypothetical eruption scenarios on Guadeloupe (see Fig. 2) are described in this section. The basis of such a prediction uses the building stock inventory described in Sect. 4, the vulnerability relationships described in Sects. 5 and 6, and an arbitrary designation of hazard for each zone intensity as set out in Sect. 3. These hazard inputs will need to be replaced with realistic hazard predictions when results are available. The hypothetical eruption scenarios used are not intended to be realistic. Further work will explore the application of the impact model to plausible eruption scenar-ios which are being developed within EXPLORIS based on the geological knowledge of the volcano’s past activity (Ko-morowski et al., 2005) and additional detailed studies under-way within EXPLORIS.
7.1 Case 1
In this hypothetical sample case, the hazard scenario corre-sponds to a volcanic eruption with volcanogenic earthquakes and tephra fall but with no pyroclastic flows. For tephra, the same intensity has been assumed in zones 1 and 2, while this increases in zones 3, 4 and 5, respectively. Earthquakes were assumed to affect zones 3, 4 and 5. The inputs have been set to values shown in Table 10. The outputs from the impact model are summarized in Table 11.
The results of the impact model for the first hypothetical scenario show that of 8206 buildings in the case study area, 1487 are predicted to collapse at a rate of ≈18% over the whole area surveyed. For the same area, the predicted num-ber of fatalities is 316 from a population of 20 507, i.e. ≈2% of the population.
Fig. 6. Expected casualty rates from pyroclastic flow infiltration
hazard for different ventilation rates.
The death and collapse rates vary from zone to zone. The minimum collapse rate is 0% and the maximum collapse rate is 78%. The minimum death rate is 0% and the maximum death rate reaches 9%. For this example, death and building collapse rates seem to follow a similar trend with a relatively stable proportional relationship between the two estimates. This is due to the way the model estimates deaths as a re-sult of earthquake and tephra hazard, which is estimated on the basis of building collapse. Figure 7 shows the estimated building collapses and fatalities. Such a representation may be a useful way of presenting the results of impact estimates to emergency planners and strategic decision-makers.
Table 12. Case 2’s model inputs, with the volcanic hazards defined as intensities (see Table 1).
Zone # buildings Population Tephra fall Pyroclastic flow pressure Pyroclastic flow infiltration (EHF) Earthquake
1 3231 8562 2 4 4 0 2 2261 6191 2 4 4 0 3 1245 2639 3 5 5 1 4 674 1429 4 6 6 2 5 795 1685 5 7 7 3 Total 8206 20 507
Table 13. Case 2’s model outputs.
Zone % buildings collapsed # buildings collapsed % killed # killed
1 9% 302 84% 7165 2 12% 275 83% 5142 3 0% 6 66% 1746 4 46% 310 95% 1352 5 82% 650 100% 1679 Total 1543 17 084
Fig. 7. Sample results for the Case 1 eruption scenario. For each
zone, the bar on the left is the % of buildings collapsed and the bar on the right is the % of people killed.
7.2 Case 2
In this hypothetical sample case, an eruption producing tephra fall, volcanogenic earthquakes and pyroclastic flows was assumed. The intensity of earthquakes and the tephra fall intensity have been left the same as in the previous case, so that the differences are solely due to the pyroclastic flow. The inputs have been set to values shown in Table 12 and the outputs from the impact model are summarized in Table 13.
The results of the impact model for the second hypothet-ical scenario show that of 8206 buildings in the case study area, 1543 are predicted to collapse at a rate of 19% over
the whole area surveyed. This is only a small increase (by 1%) over the results for Case 1, showing that the number of building collapses caused by pyroclastic flows are much less than for those of the other two hazards combined. For the same area, the predicted number of fatalities in a popula-tion of 20 507 is 17 084, i.e. 83% of the populapopula-tion. This is a huge leap from the estimates for a scenario without pyroclas-tic flows. The result highlights the devastation that would oc-cur in an unevacuated area in the event of such a hazard, a re-sult that is in agreement with the historical evidence (Blong, 1984).
The death and collapse rates vary from zone to zone. The minimum death rate is 66% and the maximum death rate is 100%. These results do not seem to follow the same trend as the building collapse rate – which ranges between 0% and 82% – because death caused by pyroclastic flows are not de-pendent on building collapse. Figure 8 shows the estimated building collapses and fatalities.
Different eruption scenarios tested on this building stock vulnerability database show how some impacts are mitigated by the presence of certain types of building stock. For ex-ample, in both cases, zone 3 shows greater resilience to all three volcanic hazards. This seems to result from the domi-nance of concrete shear wall constructions in the area (see Sect. 4, Fig. 2). Estimated casualties are greater in areas such as zones 1 and 2 with lower hazard intensities due to the vulnerability of the building stock and the density of the population in those areas.
8 Limitations of the model
In its present stage of development, the model has several limitations which need to be factored in when considering the
damage and human casualty estimates. These are discussed in this section.
First, it makes no allowance for damage and casualties from fires which might break out either within buildings or in the external environment as a result of the contact be-tween hot pyroclastic flow materials and combustible build-ing materials and contents. Such fires are expected when the temperature of the pyroclastic flow material is above about 300◦C. Their possible extent and consequences are a com-plex interaction between the temperature of flow materials, the combustibility and urban density of the building stock, the local vegetation and the environmental conditions. These issues are discussed by D. Purser in Kelman (2004) and will be considered in a simplified way in future model develop-ment.
Second, the model in its present stage takes no account of the effect of previous volcanic eruption impacts on the vulnerability of buildings to subsequent ones. For example, a damaging earthquake, even without complete destruction, will increase a building’s vulnerability to a subsequent py-roclastic flow. Given a knowledge of the likely sequence of hazards, these effects of combined vulnerabilities can be taken into account, and work is currently being done to achieve this (G. Zuccaro et al.’s work in Kelman, 2004). However, in the present model, each of the three princi-pal hazards is considered as an independent event, and the probability of damage or casualties from the combination of hazards has been calculated from a joint probability ap-proach which ensures that deaths and injuries are not double-counted.
Third, the vertical profile of the pyroclastic flow pressure on a building is considered uniform with height. Good rea-sons exist to believe that this assumption is inappropriate. Density of the flow materials is likely to increase towards ground level, but velocity will decrease towards ground level. Alternative shapes of pressure profile are possible depending on the relative importance of these two effects, but there is little direct evidence on which to base a better model. In a subsequent phase of the work, the impact of alternative plau-sible assumptions on the level of damage and casualties will be investigated.
A final limitation of the model is that the intensity of each of the hazards is averaged over a relatively large impact zone, within which variation will be significant for all hazards. A better model will not only look at substantially smaller im-pact zones than have been considered here, but will also con-sider the impact of urban sheltering on flow pressures and the effects of urban density on potential fire spread. On this topic too, further work is currently in progress which will be incorporated into future revisions of the impact model.
9 Evaluating mitigation options
As discussed above, the purpose of the impact model is to aid in evaluating and testing various mitigation options in or-der to determine the safest and most effective measures to
Fig. 8. Sample results for the Case 2 eruption scenario. For each
zone, the bar on the left is the % of buildings collapsed and the bar on the right is the % of people killed.
be taken to minimise the risk to human life in the event of an explosive volcanic eruption. This section discusses some possible measures, although further work on this subject is yet to be published (e.g. Spence et al., 2005b1). Here, three possibilities are investigated: evacuation, land-use planning and building control through legislation.
9.1 Evacuation: short-term population displacement Short-term evacuation is the core of emergency plans for many volcanic areas. Where successful, it can produce a 100% survival rate with no casualties as a result of volcanic activity. This action was carried out in the last volcanic crisis on Guadeloupe in 1976 when 73 422 people were officially evacuated from the danger zone, although it was estimated that as much as 3% of the population in the evacuated zone remained during the day and about 1% remained during the night (Lepointe, 1999).
Enforced evacuation of 100% of the population is feasible only if enough early warning is given where a sudden explo-sive volcanic eruption could leave the resident population ex-posed to a high risk of death. Potential false alarms, disbelief in warnings, inappropriate response actions, and legal action threats make the situation more complicated, meaning that future evacuation calls could be somewhat ineffective. The decisions of leaders in the time of crisis could be challenged, leading to the position of an unenforceable evacuation, an evacuation during an eruptive event, or an incomplete evacu-ation due to large numbers of people reluctant to evacuate.
Using the impact model could help in planning phased evacuations where time and resources are limited. It would allow the management of such an operation with the latest available hazard data in order to minimise the risk of death to the most vulnerable areas and to minimise casualty num-bers. The impact model’s quantitative probabilistic frame-work, closely linked to hazard and risk assessment, also
offers a tool by which the benefits of mitigation decision-making could be readily assessed on more objective bases with confidence intervals. This is a major advantage which can help crisis managers to take key decisions in front of a potentially reluctant population or in the presence of conflict-ing interests.
9.2 Land-use planning: long-term population displacement Long term land-use planning is another potential mitigation strategy that is already in use in the Vesuvius area: A new building moratorium is in place around the volcano and there are financial incentives for families to relocate outside of the zone deemed to be the most dangerous. Such a strategy takes a long-term view of reducing the risk to local populations around areas of volcanic hazard by reducing the exposure. Such strategies can be properly evaluated and measured by using the impact model which can evaluate the number of lives which would be saved as a result of long-term popula-tion relocapopula-tion, in the event of a future eruppopula-tion following the population relocation.
9.3 Building control through legislation
Another key risk reduction measure would be reinforcing and strengthening the building stock. In addition to preventing unnecessary economic loss, this option could save lives in the event of an eruption with little warning time. Such miti-gation actions have been detailed elsewhere (Pomonis et al., 1999; Spence et al., 2004a, b, 2005a) and might include pro-tecting openings, reducing ventilation rates, providing inter-nal shelters, and providing short-term props for vulnerable roofs. The impact model would assist in analysing the ef-fects on potential casualties if certain measures were widely adopted.
10 Conclusions
The impact model’s results demonstrate how different haz-ard scenarios affect the potential impact of an eruption on the resident population within the defined hazard zones. The results from the model are preliminary and are considered as sample estimates of damage and casualties for hypothetical scenarios rather than as realistic, definitive predictions. This is due to the absence of realistic hazard data for model in-puts as well as the fact that more research needs to be done into the relationship between casualties and fatalities for any given hazard. Any definitive results, would also include con-fidence intervals attached to all estimates that take into ac-count aleatoric and epistemic uncertainties.
The method presented, however, shows the importance of having a procedural framework for systematically analysing the influence of a variety of hazard scenarios on the even-tual impact of an eruption. It further illustrates how expo-sure varying across a geographic area, in terms of absolute population and resistance of that population to hazard, may influence decision-making in applying mitigating measures.
The format of the results, presented in GIS, should provide a valuable tool for civil protection and emergency planners to make decisions about short-term evacuation plans as well as longer-term disaster preparedness and planning.
Acknowledgements. The authors thank A. Neri, D. Purser, G.
Zuc-caro, IPGP, C. Badlou and staff from the Department of Buildings and Planning of the French Ministry of the Equipment (DDE) office in Basse-Terre for their ideas and information in support of this research. A. Brown, W. Fawcett, D. Haigh, C. Magill and J. Purser contributed to the field surveys. Topographic digital data, maps, and georeferenced airphotos were purchased from IGN (France). Population data is from the INSEE (France) 1999 census for Guadeloupe. A reviewer provided helpful suggestions and the EGU Editorial Office provided support. The European Union provided the funding which made this research possible through the project Explosive Eruption Risk and Decision Support for EU Populations Threatened by Volcanoes (EXPLORIS) EVR1-2001-00047.
Edited by: J. Marti Reviewed by: R. Blong
References
Baxter, P. J., Boyle, R., Cole, P., Neri, A., Spence, R. J. S., and Zuccaro, G.: The impacts of pyroclastic surges on buildings at the eruption of the Soufri`ere Hills volcano, Montserrat, B. Vol-canol., 67, 292–313, 2005.
Blong, R. J.: Volcanic Hazards: A Sourcebook on the Effects of Eruptions, Academic Press, London, UK, 1984.
Coburn, A. and Spence, R. J. S.: Earthquake Protection, John Wiley and Sons, 2002.
Esposti Ongario, T., Neri, A., Cavazzoni, C., and Erbacci, G.: 3D Multiphase Flow Simulation Outputs on a Large-Scale Do-main, Deliverable D3.4 for the project Explosive Eruption Risk and Decision Support for EU Populations Threatened by Vol-canoes (EXPLORIS) EVR1-2001-00047, INGV and CINECA, Italy, December, 2004.
Esposti Ongaro, T., Neri, A., Todesco, M., and Macedonio, G.: Py-roclastic Flow Hazard Assessment at Vesuvius by Using Numer-ical Modelling, 2. Analysis of flow variables, B. Volcanol., 64, 178–191, 2002.
Gr¨unthal, G. (Ed.): European Macroseismic Scale, Council of Eu-rope, Luxembourg, 1998.
Kelman, I. (Ed.): Residential Building and Occupant Vulnerabil-ity to Pyroclastic Flow, in Second Annual Report for the project Explosive Eruption Risk and Decision Support for EU Pop-ulations Threatened by Volcanoes (EXPLORIS) EVR1-2001-00047, Cambridge University Centre for Risk in the Built En-vironment, University of Cambridge, UK, December, 2004. Komorowski, J.-C., Boudon, G., Semet, M., Beauducel, F.,
Ant´enor-Habazac, C., Bazin, S., and Hammouya, G.: Guade-loupe, in: Volcanic Atlas of the Lesser Antilles, edited by: Lind-say, J. M., Robertson, R. E. A., Shepherd, J. B., and Ali, S., Seis-mic Research Unit, The University of the West Indies, Trinidad and Tobago, 65–102, 2005.
Lepointe, E.: Le r´eveil du volcan de la Soufri´ere en 1976: la popula-tion guadeloup´eenne `a l’´epreuve du danger, in: Les catastrophes naturelles aux Antilles – D’une Soufri´ere `a l’autre, edited by: Yacou, A., CERC Universit´e Antilles et de la Guyane, Editions Karthala, Paris, 15–71, 1999.
Macedonio, G. and Costa, A.: 3D Simulation Outputs of the Mesoscale and Advection-Diffusion Models, Deliverable D3.10 for the project Explosive Eruption Risk and Decision Support for EU Populations Threatened by Volcanoes (EXPLORIS) EVR1-2001-00047, Osservatorio Vesuviano – INGV, Italy, January, 2005.
Pomonis, A., Spence, R., and Baxter, P. J.: Risk Assessment of Residential Buildings for an Eruption of Furnas Volcano, S˜ao Miguel, the Azores, J. Volcanol., 92, 107–131, 1999.
Spence, R. J. S., Baxter, P. J., and Zuccaro, G.: Building vulner-ability and human casualty estimation for a pyroclastic flow: a model and its application to Vesuvius, J. Volcanol., 133, 321– 343, 2004a.
Spence, R. J. S., Zuccaro, G., Petrazzuoli, S., and Baxter, P. J.: Re-sistance of Buildings to Pyroclastic Flows: Analytical and Exper-imental Studies and Their Application to Vesuvius, Nat. Hazards Rev., 5, 48–59, 2004b.
Spence, R. J. S., Kelman, I., Baxter, P. J., Zuccaro, G., and Pe-trazzuoli, S.: Residential building and occupant vulnerability to Tephra Fall, Nat. Hazards Earth Syst. Sci., 5, 477–494, 2005b,
SRef-ID: 1684-9981/nhess/2005-5-477.
Todesco, M., Neri, A., Esposti Ongaro, T., Papale, P., Macedonio, G., Santacroce, R., and Longo, A.: Pyroclastic Flow Hazard As-sessment at Vesuvius by Using Numerical Modelling, 1. Large Scale Dynamics, J. Volcanol., 64, 155–177, 2002.
Zuccaro, G., Papa, F., and Baratta, A.: Aggiornamento delle mappe a scala nazionale di vulnerabilit`a sismica delle strutture edilizie, in: La vulnerabilit`a degli edifici: valutazione a scala nazionale della vulnerabilit`a sismica degli edifici ordinari, edited by: Bernardini, A., Gruppo Nazionale per la Difesa dai Terre-moti, Rome, Istituto Nazionale di Geofisica e Vulcanologia, Italy, 2000.