HAL Id: insu-02378051
https://hal-insu.archives-ouvertes.fr/insu-02378051
Submitted on 24 Nov 2019HAL is a multi-disciplinary open access
archive for the deposit and dissemination of sci-entific research documents, whether they are pub-lished or not. The documents may come from teaching and research institutions in France or abroad, or from public or private research centers.
L’archive ouverte pluridisciplinaire HAL, est destinée au dépôt et à la diffusion de documents scientifiques de niveau recherche, publiés ou non, émanant des établissements d’enseignement et de recherche français ou étrangers, des laboratoires publics ou privés.
Granular Rayleigh-Taylor Instability
Jan Ludvig Vinningland, Øistein Johnsen, Eirik Flekkøy, Renaud Toussaint,
Knut Jørgen Måløy
To cite this version:
Jan Ludvig Vinningland, Øistein Johnsen, Eirik Flekkøy, Renaud Toussaint, Knut Jørgen Måløy. Granular Rayleigh-Taylor Instability. AIP Conference Proceedings, American Institute of Physics, 2009, 1145, pp.1067. �insu-02378051�
Granular Rayleigh-Taylor instability
Jan Ludvig Vinningland , Øistein Johnsen , Eirik G. Flekkøy , Renaud Toussaint
†and Knut Jørgen Måløy
Department of Physics, University of Oslo, P.0.Box 1048, N-0316 Oslo, Norway
†Institut de Physique du Globe de Strasbourg, CNRS, Université Louis Pasteur, 5 rue Descartes, 67084
Strasbourg Cedex, France
Abstract. A granular instability driven by gravity is studied experimentally and numerically. The instability arises as grains
fall in a closed Hele-Shaw cell where a layer of dense granular material is positioned above a layer of air. The initially flat front defined by the grains subsequently develops into a pattern of falling granular fingers separated by rising bubbles of air. A transient coarsening of the front is observed right from the start by a finger merging process. The coarsening is later stabilized by new fingers growing from the center of the rising bubbles. The structures are quantified by means of Fourier analysis and quantitative agreement between experiment and computation is shown. This analysis also reveals scale invariance of the flow structures under overall change of spatial scale.
Keywords: granular flow, Rayleigh-Taylor instability, pattern formation, size invariance, simulation
INTRODUCTION
As grains become smaller the effect of the interstitial fluid becomes more important. The result is a combi-nation of dry granular dynamics and the hydrodynamics of the fluid. These systems give rise to a variety of ex-otic and most often poorly understood phenomena such as fluidization [1] and bubble instabilities [2], quicksand and jet formation [3], and sandwich structures in systems where different particle types segregate [4]. While the study of dry granular media has been extensive over the past decades, the exploration of fluid-granular systems has been of more limited scope.
A wide range of granular instabilities where various structures form along fluid-grain interfaces have been reported the last few years [2, 5, 6, 7, 8] The instabil-ity discussed here arises when a closed, vertical Hele-Shaw cell, partially filled with fine grains and air at at-mospheric pressure, is rapidly rotated to bring the dense packing of grains above a layer of air [9, 10]. Along the initially flat air-grain interface fine fingers emerge that subsequently develop into coarser finger-bubble struc-tures. In contrast to the classical Rayleigh-Taylor insta-bility [11] the coarsening process observed in the granu-lar case will right from the start bring about a reduction in the number of fingers and a corresponding increase in the size of the bubbles. New fingers will form in the centre of the rising bubbles as they reach a certain width, thus keeping the characteristic size of the bubbles at a stable value.
Our experimental and numerical data compare favor-ably both qualitatively and quantitatively, despite the simplifications of the numerical model: Only two spatial
dimensions, zero inter-particle friction, no gas inertia, and a grid resolution of 2.5 grain diameters. The finger-bubble structures further exhibit scale invariance under change of particle size, a feature which is supported both by observations and theoretical considerations.
EXPERIMENT
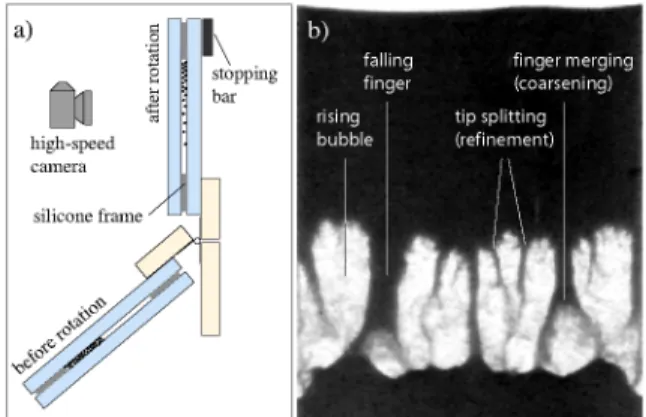
The experimental setup consists of a Hele-Shaw cell that can rotate vertically about its base, see Fig. 1(a). The Hele-Shaw cell is made of two 8-mm-thick glass plates separated by a silicone frame which defines the internal dimension of the cell. Before the second plate is attached,
Figure 1. (a) Side view of the experimental setup. (b)
Ex-perimental image of the granular Rayleigh-Taylor instability where a layer of monodisperse polystyrene beads of 140 µm in diameter (black) displaces air (white) in a Hele-Shaw cell of dimensions 56 mm × 86 mm × 1 mm.
the cell is filled with monodisperse polystyrene beads (Microbeads® from Dynoseeds) while in a horizontal
po-sition. To avoid electrostatic effects the humidity was kept constant at about 30% during the filling of the cells and throughout the experiment. Great care is taken to en-sure an air tight cell by using clamps and applying a layer of silicone paste along the outer edge. The cell is flipped and tilted a few times to obtain a random loose pack-ing of the grains and a presumably flat air-grain inter-face. The experiment starts by rotating the cell manually to an upright vertical position where a high speed digi-tal camera (Photron Fastcam-APX 120K) records images (512x1024 pixels) of the advancing instability at a rate of 500 frames per second.
Four cells were assembled and filled with polystyrene beads of respectively 80, 140, 230 and 570 µm in diam-eter. The dimensions of the cells scale proportionally to the diameters of the grains they contain. Hence, the num-ber of grains in the different cells is approximately con-stant. The experimental cells are somewhat taller than the numerical cells to account for the grains that settle dur-ing the rotation. The horizontal filldur-ing procedure makes it difficult to control the filling fraction and it may vary slightly among the four cells.
SIMULATION
The numerical model, first introduced by McNamara et
al. [12, 13], combines a continuum description of the
air with a discrete description of the granular phase. The granular phase is modeled as discrete, rigid spheres that collectively constitute a deformable porous medium. The pressure drop associated with the air flowing through the granular medium is given by a local Darcy’s law with the Carman-Kozeny relation for the permeability K [14]. The continuum gas phase is described solely by its pressure P. However, the velocity field of the gas may be obtained from the pressure gradient via Darcy’s law. In order to provide a continuum description of the pressure
P{x,y) on a grid (x,y), the continuum variables solid
fraction p(x,y) and granular velocity it(x,y) need to be calculated. This is done by a linear smoothing function which is illustrated in Fig.2.
From the continuity equations of air mass and grain mass, using the seepage velocity of the air (i.e uDarcy /<j>),
a pressure equation is derived, see [12, 13],
V dt / V jx J
where (j> = 1 - p is the porosity. This equation is valid for compressible flow since it assumes pa ^ <j>P (isothermal
ideal gas law) for the air-density, pa. If instead an
incom-pressible liquid is considered this assumption becomes
grid-nodes.
Figure2. Illustrating the smoothing function: p(x,y) (u(x,y))
is calculated by adding a fraction of the grain’s mass (velocity) to each of the four grid-nodes according to the relative position of the grain. The area of the four subdivisions corresponds to the fraction of mass (velocity) added to the node with a matching color.
pi oc (j) for the liquid density p. The pressure equation
(1) then simplifies to a Poisson equation for the pressure given by dP/dt = V • ( K ( 0 ) / J I VP) - V • u.
The grains are governed by Newton’s second law
dv ˜ VVP
m—=mg + FI , (2) dt p
where m, v, and V are respectively the mass, velocity, and volume of a grain. The inter-particle normal force FI acting between grains in contact is calculated iteratively using contact dynamics [15] (but a Hookean or Hertzian contact law could also have been used). The dynamics of the grains are simplified by neglecting particle-particle and particle-wall friction. A lower cutoff is imposed on the solid fraction because the Carman-Kozeny relation is not valid for a solid fraction less than 0.25 [16]. This cutoff causes the permeability of the most dilute regions of the system to be slightly underestimated. The effect is a slight overestimation of the pressure forces acting on grains in dilute regions.
RESULTS
Comparing simulation and experiment
To study the coarsening of the finger-bubble structures quantitatively, we use the Fourier spectrum of the solid fraction to obtain a characteristic average wave number(k). An average Fourier power spectrum, S(k), is
ob-tained from the individual power spectra calculated along each row of p{x,y). A mean wave number is then de-fined as (k) = Zk S(k) • k/ Zk S{k), where 1/fe is the wave-length. Likewise, the squared standard deviation is given b y <yk 2 = Lk S(k) • k2 j YJ, S(k) - (k)2. For the
experimen-tal data the image pixel values are used to estimate the solid fraction.
Figure 3 shows the temporal evolution of (k) and ak
simulation experiment experiment 0 0.1 0.2 0.3 0.4 0.5 0.6 0. 0.1 0.2 0.3 0.4 0.5 0.6 0.7 time (s)
Figure 3. Mean wave number (k) and standard deviation ak
(inset plot) for two experiments and one simulation, all using polystyrene beads of 140 µm in diameter.
initial discrepancy between the numerical and experi-mental data can be explained by difficulties in controlling the start conditions of the experiment, mainly caused by the manual rotation of the cell. After about 0.2 seconds the experimental and numerical data coincide and con-tinue to show a similar coarsening behavior. The fluctu-ations of (k) and ak are associated with the continuous
nucleation of new fingers and merging of existing fin-gers.
Scale invariance
We further investigate the behavior of the system as the overall spatial scale is changed. A series of seven simulations are performed using monodisperse packings with the grain diameter d ranging from 70 µm to 490 µm in steps of 70 µm. Each simulation starts with the same initial configuration of 160000 grains, but with a system size that scale proportionally to d.
In these simulations we have introduced the larger density of glass (2.5 g/cm3), rather than polystyrene, in
order to minimize the numerical artifacts associated with the solid fraction cutoff in the permeability. As the inertia of the grains decreases the overestimated pressure forces in the dilute regions of the system will act even stronger on the falling granular fingers.
Data-collapse plots of the rescaled mean wave number
d(k) are shown in Figs. 4(a) (simulation) and 4(b)
(exper-iment). These plots indicate that the characteristic size of the structures is invariant for a wide range of grain sizes when measured in units of d.
The convergence of the numerical data-collapse in Fig. 4(a) is quite good. The deviation of the 70 µm curve for small t is probably explained by the increase in the relative importance of the PV • w-term (see Ref. [9] for a theoretical interpretation of the scale invariance). The
di-0.08 0.06 0.04 0.02 0 • d = 80|im * d = 140|im • d = 230|im d = 570|im 0 • i . ' . ' f i i H i i n M 0 0.1 0.2 0.3 0.4 0.5
^mma
0 0 . 1 0 . 2 0 . 3 0 . 4 0 . 5 t i m e (s) 0 . 0 8 0 . 0 6 0 . 0 4 0 . 0 2 d = 70|im d = 140|im d = 210|im d = 280|im d = 350|im d = 420|im d = 490u ( b ) 0 . 1 0 . 2 0 . 3 t i m e (s) 0 . 4 0 . 5Figure 4. (a) Data-collapse plot of d{k) for experiments were
the cell-size scales with the grain diameter d. (b) Data-collapse plot of d(k) for the numerical data. The inset plots show the evolution of the unscaled (k).
vergences of the 350, 420, and 490 µm curves for greater
t in the same plot arise because the bubbles in the coarser
packings disappear before they reach the surface since the permeability increases as grain diameter squared. The experimental data in Fig. 4(b) have a wider distribution but collapses satisfactorily given the standard deviation error bars. The experimental data are obtained by averag-ing over three experiments for each diameter d. The stan-dard deviation is calculated over a time window of 0.025 seconds. The accuracy of the experiments is at its lowest during the initial coarsening of the structures, but as the mean wave number stabilizes around 0.2 seconds the ac-curacy improves. Nevertheless, the data points are, with a few exceptions, within a distance of one standard de-viation from one another. The loss of precision for small times is most likely caused by the inaccuracy involved with the manual rotation.
Container size effects
In the experiments and simulations presented so far the size of the grains and the size of the container are
4 3 * 2 0 0 0
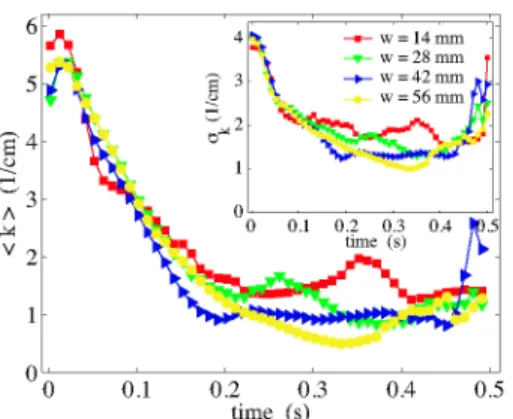
* \ • w = 14 mm - w = 28 mm • w = 42 mm • w = 56 mm '\^•25hl«r.*"'," " " > • 0.1 0.2 0.3 time (s) 0.4 0.5 Figure 5. Plot of the mean wave number (k) and standard
deviation ak (inset plot) obtained from simulations with grains
of diameter d = 140 µm in four containers of different width w.
changed proportionally. Hence, the scale invariance can in principle depend both on the scaling of the grains and on the scaling of the container. To address this question, four simulations are performed using a fixed grain size but different container widths. Figure 5 shows (k)(t) and ak{t) for four different simulations identified by the
width of the packing w. During the coarsening stage, i.e. from t = 0 s until t = 0.2 s, the four curves overlap quite well. For t > 0.2 s the curves are more spread due to two peaks in the w = 14 m m and 28 m m data. These peaks are most likely caused by fluctuations in the evolving structures which are not averaged out due to less statistics for the narrow geometries. However, the data in Fig. 5 shows no systematic dependence on container size. As a consequence, the scale invariance only depends on the grain diameter d and is not sensitive to the scaling of the container.
CONCLUSION
The granular Rayleigh-Taylor instability is presented ex-perimentally and numerically. The simulations reproduce the characteristic shape and size of the experimentally observed structures and provide fine patterns in the early phase of the process that are not resolved experimentally. Data-collapse plots of the mean wave number (k) indi-cate that the flow and the resulting structures are invari-ant when measured on a scale proportional to the grain diameter d for a range of diameters that spans from 70 µm to 570 µm.
ASI Series E: Applied Sciences, Dordrecht, 1998. Kluwer
Academic Publishers.
2. D. Gendron, H. Troadec, K. J. Måløy, and E. G. Flekkøy. Bubble propagation in a pipe filled with sand. Phys. Rev.
E, 64:021509, 2001.
3. D. Lohse, R. Rauhé, R. Bergmann, and D. van der Meer. Creating a dry variety of quicksand. Nature, 432(7018):689–690, December 2004.
4. C. Zeilstra, M. A. van der Hoef, and J. A. M. Kuipers. Simulation study of air-induced segregation of equal-sized bronze and glass particles. Phys. Rev. E, 74(1):010302(R), 2006.
5. Ø. Johnsen, R. Toussaint, K. J. Måløy, and E. G. Flekkøy. Pattern formation during air injection into granular materials confined in a circular hele-shaw cell. Phys. Rev.
E, 74(1):011301, 2006.
6. C. Völtz, W. Pesch, and I. Rehberg. Rayleigh-taylor instability in a sedimenting suspension. Phys. Rev. E, 65:011404, December 2001.
7. A. Wysocki, C. P. Royall, R. G. Winkler, G. Gompper, H. Tanaka, A. van Blaaderen, and H. Löwen. Direct observation of hydrodynamic instabilities in driven non-uniform colloidal dispersions. arXiv:0810.1258v1 [cond-mat.soft], 2008.
8. Ø . Johnsen, C. Chevalier, A. Lindner, R. Toussaint, E. Clément, K. J. Måløy, E. G. Flekkøy, and J. Schmittbuhl. Decompaction and fluidization of a saturated and confined granular medium by injection of a viscous liquid or gas. Phys. Rev. E, 78(5):051302, 2008. 9. J. L. Vinningland, Ø. Johnsen, E. G. Flekkøy, R. Toussaint,
and K. J. Måløy. Granular rayleigh-taylor instability: Experiments and simulations. Phys. Rev. Lett., 99(4):048001, 2007.
10. J. L. Vinningland, Ø. Johnsen, E. G. Flekkøy, R. Toussaint, and K. J. Måløy. Experiments and simulations of a gravitational granular flow instability. Phys. Rev. E, 76(5):051306, 2007.
11. G. Taylor. The instability of liquid surfaces when accelerated in a direction perpendicular to their planes. I.
Proc. Roy. Soc. A, 201(1065):192–196, March 1950.
12. S. McNamara, E. G. Flekkøy, and K. J. Måløy. Grains and gas flow: Molecular dynamics with hydrodynamic interactions. Phys. Rev. E, 61(4):4054–4059, 2000. 13. D.-V. Anghel, M. Strauß, S. McNamara, E. G. Flekkøy,
and K. J. Måløy. Erratum: Grains and gas flow: Molecular dynamics with hydrodynamic interactions. Phys. Rev. E, 74(2):029906(E), 2006.
14. P. C. Carman. Fluid flow through granular beds. Trans.
Inst. Chem. Eng., 15:150–66, 1937.
15. F. Radjai, M. Jean, J.-J. Moreau, and S. Roux. Force distributions in dense two-dimensional granular systems.
Phys. Rev. Lett., 77(2):274–277, 1996.
16. A. A. Zick and G. M. Homsy. Stokes-flow through periodic arrays of spheres. J. Fluid Mech., 115:13–26, 1982.
REFERENCES
Hans J. Herrmann, J.-P. Hovi, and Stefan Luding, editors.
Physics of Dry Granular Media, volume 350 of NATO 4
0