HAL Id: hal-00297740
https://hal.archives-ouvertes.fr/hal-00297740
Submitted on 6 Apr 2005HAL is a multi-disciplinary open access
archive for the deposit and dissemination of sci-entific research documents, whether they are pub-lished or not. The documents may come from teaching and research institutions in France or abroad, or from public or private research centers.
L’archive ouverte pluridisciplinaire HAL, est destinée au dépôt et à la diffusion de documents scientifiques de niveau recherche, publiés ou non, émanant des établissements d’enseignement et de recherche français ou étrangers, des laboratoires publics ou privés.
Pure stands of temperate forest tree species modify soil
respiration and N turnover
N. Brüggemann, P. Rosenkranz, H. Papen, K. Pilegaard, K. Butterbach-Bahl
To cite this version:
N. Brüggemann, P. Rosenkranz, H. Papen, K. Pilegaard, K. Butterbach-Bahl. Pure stands of temper-ate forest tree species modify soil respiration and N turnover. Biogeosciences Discussions, European Geosciences Union, 2005, 2 (2), pp.303-331. �hal-00297740�
BGD
2, 303–331, 2005
Pure stands of temperate forest tree
species N. Br ¨uggemann et al. Title Page Abstract Introduction Conclusions References Tables Figures J I J I Back Close
Full Screen / Esc
Print Version Interactive Discussion EGU Biogeosciences Discussions, 2, 303–331, 2005 www.biogeosciences.net/bgd/2/303/ SRef-ID: 1810-6285/bgd/2005-2-303 European Geosciences Union
Biogeosciences Discussions
Biogeosciences Discussions is the access reviewed discussion forum of Biogeosciences
Pure stands of temperate forest tree
species modify soil respiration and N
turnover
N. Br ¨uggemann1, P. Rosenkranz1, H. Papen1, K. Pilegaard2, and K. Butterbach-Bahl1
1
Forschungszentrum Karlsruhe, Institute for Meteorology and Climate Research, Atmospheric Environmental Research (IMK-IFU), Garmisch-Partenkirchen, Germany
2
Risø National Laboratory, Plant Biology and Biogeochemistry Department, Roskilde, Denmark
Received: 17 February 2005 – Accepted: 18 March 2005 – Published: 6 April 2005 Correspondence to: N. Br ¨uggemann ([email protected])
BGD
2, 303–331, 2005
Pure stands of temperate forest tree
species N. Br ¨uggemann et al. Title Page Abstract Introduction Conclusions References Tables Figures J I J I Back Close
Full Screen / Esc
Print Version Interactive Discussion
EGU
Abstract
The effects of five different tree species common in the temperate zone, i.e. beech (Fagus sylvatica L.), pedunculate oak (Quercus robur L.), Norway spruce (Picea abies [L.] Karst), Japanese larch (Larix leptolepis [Sichold and Zucc.] Gordon) and mountain pine (Pinus mugo Turra), on soil respiration, gross N mineralization and gross nitrifi-5
cation rates were investigated. Soils were sampled in spring and summer 2002 at a forest trial in Western Jutland, Denmark, where pure stands of the five tree species of the same age were growing on the same soil. Soil respiration, gross rates of N miner-alization and nitrification were significantly higher in the organic layers than in the Ah horizons for all tree species and both sampling dates. In summer (July), the highest 10
rates of soil respiration, gross N mineralization and gross nitrification were found in the organic layer under spruce, followed by beech > larch > oak > pine. In spring (April), these rates were also higher under spruce compared to the other tree species, but were significantly lower than in summer. For the Ah horizons no clear seasonal trend was observed for any of the processes examined. A linear relationship between soil 15
respiration and gross N mineralization (r2=0.77), gross N mineralization and gross ni-trification rates (r2=0.72), and between soil respiration and gross nitrification (r2=0.81) was found. The results obtained underline the importance of considering the effect of forest type on soil C and N transformations.
1. Introduction
20
Forests in general have a greater influence on soil conditions than most of the other plant ecosystem types, e.g. by a well developed O horizon, moderating temperature and humidity at the soil surface, input of litter with high lignin content, but also by high total net primary production and high water and nutrient demand (Binkley and Giardina, 1998). Moreover, different tree species can differ significantly in their influence on soil 25
BGD
2, 303–331, 2005
Pure stands of temperate forest tree
species N. Br ¨uggemann et al. Title Page Abstract Introduction Conclusions References Tables Figures J I J I Back Close
Full Screen / Esc
Print Version Interactive Discussion
EGU
quantity and quality of litter input to the soil, the influence on the physical soil properties (temperature, water content, pH), the amount of atmospheric deposition of S, N and H+ in polluted areas, in promoting mineral weathering by exudates and pedogenesis, and in N2 fixation (Binkley and Giardina, 1998). An effect of tree species on soil microbial biomass has also been described, with concentrations of microbial C and N being lower 5
in forest floor beneath conifers than beneath deciduous tree species (Bauhus et al., 1998). Likewise, soils of deciduous stands showed higher N mineralisation than soils of coniferous stands (Cot ´e et al., 2000), probably due to differences in foliage litter quality, as net N mineralisation was found to decrease strongly with increasing lignin content and with increasing lignin to N ratio (Scott and Binkley, 1997). A comparable pattern 10
has been found for net nitrification rates, i.e. high rates under deciduous species and low or not detectable rates under coniferous tree stands (Ste-Marie and Par ´e, 1999).
To our knowledge, only few studies have been made in which different N transfor-mation processes in soils under different tree species/forest types were investigated simultaneously. E.g., Erickson et al. (2002) studied net rates of N mineralisation and 15
nitrification in dry tropical forest, and Menyailo et al. (2003) investigated basal and substrate-induced respiration rates, net N mineralization and net nitrification rates, den-itrification as well as production and consumption of N2O in a Siberian afforestation experiment. A similar comprehensive study for the temperate climate region has not been reported up to now. Therefore, the aim of the present work was to assess a po-20
tential effect of pure stands of five different temperate tree species on soil respiration as well as on gross rates of mineralisation and nitrification in samples of the organic layers and the Ahhorizons to reduce the uncertainty about the influence of tree species on soil C and N turnover processes and of the associated formation of C and N trace gases. This knowledge is essential for the development of reliable process-oriented 25
biogeochemical models for the simulation of ecosystem C and N turnover, C and N trace gas exchange, as well as of vegetation dynamics.
BGD
2, 303–331, 2005
Pure stands of temperate forest tree
species N. Br ¨uggemann et al. Title Page Abstract Introduction Conclusions References Tables Figures J I J I Back Close
Full Screen / Esc
Print Version Interactive Discussion
EGU
2. Materials and methods
2.1. Location of the sampling area
The study site is part of a tree species trial in Western Jutland, Denmark (56◦1702700N, 8◦2504000E), established in 1965 on a sandy heathland by ploughing the soil 50–60 cm deep, fertilizing it with approx. 240 kg P ha−1 and sowing 100 kg ha−1 lupine seeds. 5
For soil improvement black alder (Alnus glutinosa L.) plants were added to each of the different tree species, but were removed during the following few years, result-ing in monospecific tree stands (50 m×60 m). The samplresult-ing area is part of the cool-temperate climate region, with an annual mean air temperature of 7.7◦C and an annual mean precipitation of 960 mm. The soils of the region are dominated by podzols on 10
sandy siliceous substrate. The mean annual wet deposition of N to the soil amounts to approx. 15 kg N ha−1(Andersen et al., 2003).
2.2. Soil sampling
Soil samples were taken on 23 April, 2002, and on 2 July, 2002 from soils under beech (Fagus sylvatica L.), pedunculate oak (Quercus robur L.), Norway spruce (Picea abies 15
[L.] Karst), Japanese larch (Larix leptolepis [Sichold and Zucc.] Gordon) and mountain pine (Pinus mugo Turra). On each date samples were taken from six defined locations (Fig. 1) under each of the tree species, differentiating between the organic layer and the Ah horizon to a depth of 5 cm. Each sample consisted of approx. 2 kg of organic layer and of Ah horizon, respectively, and was temporally stored in plastic bags, perfo-20
rated with small holes to ensure gas exchange, but to minimize drying of the soil. The soil samples were transferred within 1 d to the microbiological labs of the Institute for Meteorology and Climate Research, Garmisch-Partenkirchen, Germany, and stored in a dark room at 4◦C until analysis. In each of the following weeks, samples from identi-cal sampling positions in each of the five tree stands were processed, so that within 6 25
BGD
2, 303–331, 2005
Pure stands of temperate forest tree
species N. Br ¨uggemann et al. Title Page Abstract Introduction Conclusions References Tables Figures J I J I Back Close
Full Screen / Esc
Print Version Interactive Discussion
EGU
2.3. Determination of soil variables
Soil temperatures at 5 cm depth were determined at both samplings and at each sam-pling location with a soil thermometer (TTX 290S, Ebro, Ingolstadt, Germany). The thickness of the organic layer under each of the tree species was measured at the first sampling.
5
The maximum water holding capacity (MWHC), the total organic C and the N con-tents of the different soils were determined on three mixed samples of the organic layers and the Ahhorizons, respectively, for each of the different stands. For the deter-mination of the MWHC, the C and N contents, but also for the analysis of soil C and N turnover rates, the samples of the Ah horizon were sieved <3.15 mm, whereas the 10
samples of the organic layers were sieved <4 mm. Two different mesh sizes were used in order to (i) homogenize the samples for a reproduceable analysis especially of gross N mineralization rates, as the 15N label solution had to be distributed evenly within the samples, and (ii) preserve as much of the soil structure as possible to minimize disturbance of the samples.
15
The MWHC was quantified as follows: approx. 50 g of the sieved soil was transferred into a filter mask (Sanifil, Roth, Karlsruhe, Germany) that was placed in a funnel closed with a stopcock at the bottom. Thereafter the soil was covered with water and allowed to become water-saturated. The stopcock was opened, so that the excess of water could run off. When there was no more water released by the soil samples within 1 h, 20
they were transferred into a glass vial, weighed, oven-dried for 24 h at 105◦C, and then their dry weights were determined. The difference between water-saturated and dry soil, calculated for 100 g dry soil, was taken as the MWHC. Aliquots of the soil samples were sent out to a commercial laboratory (Laboratory Dr. Janssen, Gillersheim, Ger-many), where the total organic C and the N contents of the samples were quantified. 25
The pH values of the soil samples were determined as follows: 10 g soil were taken from each sample, sieved and transferred into a closable polyethylene (PE) test tube. Then 25 ml of 10 mM CaCl2solution were added, and the mixture was stirred for 30 min
BGD
2, 303–331, 2005
Pure stands of temperate forest tree
species N. Br ¨uggemann et al. Title Page Abstract Introduction Conclusions References Tables Figures J I J I Back Close
Full Screen / Esc
Print Version Interactive Discussion
EGU
on a rotary shaker at 200 rev min−1. The pH value of the suspension was determined with a pH meter (WTW, Weilheim, Germany).
2.4. Determination of gross N mineralization rates
Gross N mineralisation rates were determined using the15N isotope pool dilution tech-nique, modified after Davidson et al. (1991). Prior to15N labeling the soils were sieved 5
manually and moistened to a water content of 60% of their respective MWHC. For15N labeling a 2.5 mM (15NH4)2SO4 solution with 6 at%15N was used. The solution was prepared by mixing ammonium sulfate with natural abundance of 15N (Merck, Darm-stadt/Germany) with ammonium sulfate with an enrichment of 95 at% 15N (Chemo-trade, Leipzig/Germany). For labeling approx. 200 g soil was spread out in a plastic 10
tray, and 3 ml labeling solution per 100 g of soil were added in a grid pattern with a 5 ml PE syringe equipped with a 0.4 mm steel cannula. During the labeling procedure the soil was mixed several times to ensure homogenous labeling with15N. Immediately after labeling the exact water content of the soil was determined gravimetrically. Subse-quently, six PE test tubes were filled each with 20 g of the labeled soil and sealed with 15
Parafilm (American National Can, Greenwich, USA). The test tubes were stored in a refrigerator at 12◦C for at least 20 h to condition the soil to the assay conditions. Then (t1) three of the six parallels were transferred to 250 ml wide-necked PE flasks, and 60 ml of 1 M KCl solution were added. The samples were stirred on a rotary shaker at 150 rev min−1 for 30 min. The suspension was filtered through a fiber glass filter 20
(Whatman GF/A, Springfield Mill, UK). 10 ml of the filtrate were removed with a 30 ml PE syringe equipped with a syringe filter (0.2 µm, Schleicher & Schuell, Dassel, Ger-many), transferred to a 15 ml PE test tube, stored at −20◦C and sent out for colori-metric analysis of the ammonium concentration (Laboratory Dr. Janssen, Gillersheim, Germany). Another 30 ml of the filtrate were transferred with the same syringe into a 25
250 ml wide-necked glass flask for the analysis of the14/15N isotope ratio. The other three parallels were kept in the refrigerator at 12◦C for additional 24 h (t2), and then
BGD
2, 303–331, 2005
Pure stands of temperate forest tree
species N. Br ¨uggemann et al. Title Page Abstract Introduction Conclusions References Tables Figures J I J I Back Close
Full Screen / Esc
Print Version Interactive Discussion
EGU
treated in the same way as the first set.
The14/15N isotope ratio was determined according to the diffusion method of Brooks
et al. (1989), by which the NH+4 is driven out into the gas phase as NH3under alkaline conditions and captured by an acidified solid phase. To alkalize the solution 250 mg of MgO (Merck, Darmstadt, Germany), annealed for 12 h at 1000◦C prior to use to 5
remove any N compounds, and a small glass ball to ensure an even distribution of the MgO were added to the 30 ml of filtrate. The flasks were closed air-tight with a silicone seal ring, a stainless steel cap with a hook at the bottom and finally with a screw cap. A small piece of fiber glass filter (Whatman GF/A, Springfield Mill, UK), punched out of a filter with an office puncher and treated with 10 µl of 2.5 M KHSO4, was attached 10
to the hook in the interior of the flask. The closed flasks were shaken on a rotary shaker at 140 rev min−1 for 24 h in the dark at 28◦C. Thereafter the small filter pieces were removed carefully and transferred into a 96-well microplate, which was placed into a desiccator. The filter pieces were dried in the dark over silica gel at 4◦C. Finally,
the14/15N isotope ratio of the NH+4 was determined at the Risoe National Laboratory
15
(Roskilde, Denmark) with an elemental analyzer (EA 1110, Carlo Erba Instruments, Milan, Italy) connected to an isotope ratio mass spectrometer (MAT Delta Plus, Thermo Finnigan, Bremen, Germany). Gross N mineralization rates were calculated according to the equations of Kirkham and Bartholomew (1954).
2.5. Determination of soil respiration and gross nitrification rates 20
Soil CO2 formation and gross nitrification rates were determined using the barometric process separation method (BaPS, Ingwersen et al., 1999). This method is based on the determination of the CO2-, O2- and total gas balance of well aerated soil samples in an isothermal gas tight soil system. In such a system the processes of nitrification (net consumption of O2 – pressure decrease), denitrification (net CO2 production and net 25
production of NO, N2O and N2– pressure increase), soil respiration (pressure neutral if the respiration coefficient equals 1) and CO2 dissolution in the soil water (pressure
BGD
2, 303–331, 2005
Pure stands of temperate forest tree
species N. Br ¨uggemann et al. Title Page Abstract Introduction Conclusions References Tables Figures J I J I Back Close
Full Screen / Esc
Print Version Interactive Discussion
EGU
decrease) are the only pressure relevant processes. Based on the total gas balance of such a system an inverse balancing approach can be used to calculate rates of nitrification, denitrification and C mineralization. For further details see Ingwersen et al. (1999), Breuer et al. (2002) and Kiese et al. (2002).
For the BaPS experiments approx. 700 ml of sieved soil were moistened to 60% 5
MWHC. After covering the soil with perforated plastic foil, the soil was placed into a refrigerator at 12◦C for 12 h to allow the soil to adapt to the incubation temperature. Thereafter the soil was filled into the reaction chamber of the BaPS instrument (UMS, M ¨unchen, Germany). After gas-tight closure of the lid the instrument was placed in a thermostatic water bath at 12◦C for at least 7 h. During the entire duration of the mea-10
surements air and soil temperature as well as the values for air pressure and for CO2 and O2 concentration were monitored continuously by the instrument sensors. The data were aggregated as 10 min means. At the end of the measurements the exact water content of the soil was determined gravimetrically. Rates of soil respiration and gross nitrification were calculated using the software delivered with the BaPS instru-15
ment (UMS, M ¨unchen, Germany) on the theoretical basis described by Ingwersen et al. (1999).
2.6. Statistical analysis
Statistical analyses of the significance of differences between the different soils orig-inating from the different tree stands, the two different sampling dates and the two 20
different soil layers were performed using SPSS 8.0 for Windows (SPSS Inc., Chicago, USA). For the analyses of variance between the different tree species and the different sampling dates a one-way ANOVA, including the Bonferroni Post-Hoc test, was applied, and for the differences between the organic layer and the mineral layer the paired t-test was used.
BGD
2, 303–331, 2005
Pure stands of temperate forest tree
species N. Br ¨uggemann et al. Title Page Abstract Introduction Conclusions References Tables Figures J I J I Back Close
Full Screen / Esc
Print Version Interactive Discussion
EGU
3. Results
3.1. Soil variables
The thickness of the organic layer was considerably different between the tree species studied (Table 1), with the organic layer under larch being thickest, followed by beech, spruce, pine and oak. The organic layer under oak was approximately half as thick as 5
under larch. Soil temperatures were also different between the different stands and the two sampling dates (Table 1). In April as well as in July the values were significantly lower for the soil under spruce and beech as compared to oak, pine and larch. The water contents at the time of sampling were always higher in the organic layers than in the respective Ah horizons (Table 2), and were always higher in the July samples 10
than in the April samples. In April as well as in July the water content in the organic layer under beech was highest, whereas it was lowest in the Ah horizon under spruce in April and under larch in July. Similar tendencies were found for the MWHC (Table 2). The values of MHWC of the organic layer were also always significantly higher than those of the Ah horizon at both sampling dates, and the MWHC of the organic layer 15
samples taken in July were always higher than those taken in April. With 741.8 g H2O g−1soil dry weight (sdw) the organic layer under larch had the highest MWHC in April, being significantly higher than the MWHC of soil under all other tree species studied. In July the organic layer under beech showed the highest value (832.8 g H2O g−1sdw), followed by larch, spruce, pine and oak. For the Ah horizon no such clear tendencies 20
could be observed: whilst spruce had the lowest MWHC in April (56.7 g H2O g−1), it showed the highest value in July (62.8 g H2O g−1sdw).
The pH values of all soil samples were in the range of 3.1 to 3.5, thus being very acidic, and with the pH of the organic layers always being slightly lower than that of the Ah horizons (Table 3). The total organic C contents of the organic layers ranged 25
between 29.3% for pine and 49.3% for larch, those of the Ah horizons between 2.5% (larch) and 4.4% (beech), albeit the differences within each of the layer types were
BGD
2, 303–331, 2005
Pure stands of temperate forest tree
species N. Br ¨uggemann et al. Title Page Abstract Introduction Conclusions References Tables Figures J I J I Back Close
Full Screen / Esc
Print Version Interactive Discussion
EGU
not significant (Table 3). The total N contents of the organic layers were in the range of 1.4% to 2.3%, with the lowest value for pine and the highest value for beech. The lowest N content of the Ah horizons was found for larch (0.13%), whereas the highest was found again for beech (0.21%). Also the differences in N contents were not significant in both the organic layers and the Ah horizons. The resulting C to N ratios of the 5
organic layers as well as in the Ah horizons were in the range of 17.6 to 23.3, except for the organic layer under larch, where the C to N ratio amounted to 28.6, which was significantly higher than all other values.
3.2. Soil respiration rates
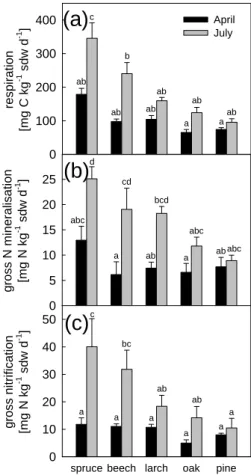
Soil respiration rates in the organic layer were considerably higher in July than in 10
April under all five tree species (Fig. 2a). In April, the highest rates were de-termined for organic layer samples from the spruce site (178.7 mg C kg−1sdw d−1), followed by larch, beech, pine and oak, but the differences remained insignificant (P >0.05). In July, organic layer samples from the spruce site exhibited the signifi-cantly highest rates (345.7 mg C kg−1sdw d−1), followed by samples from the beech 15
site (240.2 mg C kg−1sdw d−1), which in turn showed a significantly higher respiration than the organic layers under larch, oak and pine.
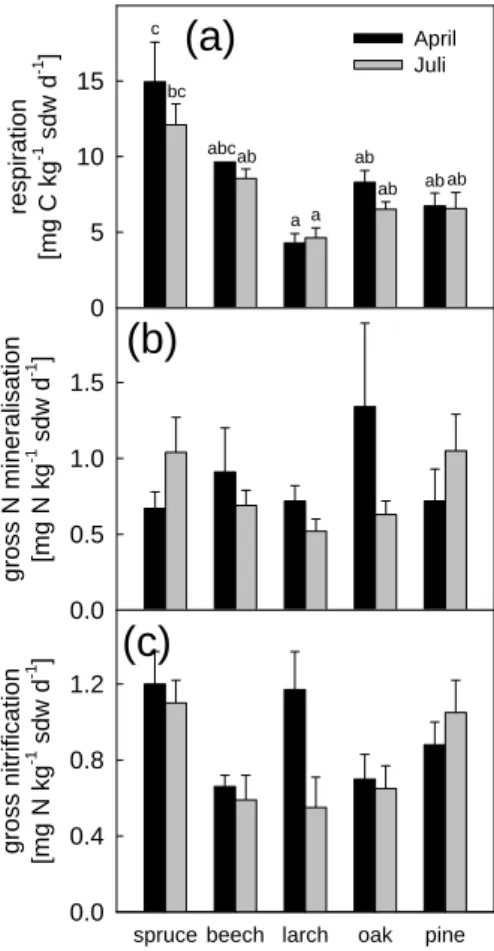
In the Ahhorizons, respiration rates were 8-fold (oak in April) to 35-fold (larch in July) lower than in the respective organic layers. In contrast to the organic layers, no clear seasonal change of respiration rates was detected (Fig. 3a), but again the mineral soil 20
under spruce had the highest rates in April (14.9 mg C kg−1sdw d−1) as well as in July (12.1 mg C kg−1sdw d−1), being significantly higher than in the mineral soils from oak, pine and larch in April, and only larch in July.
3.3. Gross N mineralization rates
In soils from all stands gross N mineralization rates in the organic layers were, like the 25
BGD
2, 303–331, 2005
Pure stands of temperate forest tree
species N. Br ¨uggemann et al. Title Page Abstract Introduction Conclusions References Tables Figures J I J I Back Close
Full Screen / Esc
Print Version Interactive Discussion
EGU
for the beech and spruce stands being significant (P <0.05). The lowest gross N min-eralization rate in April was determined for soil under beech (6.2 mg N kg−1sdw d−1), whereas the highest rate was found for soil under spruce (12.9 mg N kg−1sdw d−1), al-beit being not significantly higher than those found for the other tree species. The low-est gross N mineralization rate in July was detected under pine (8.9 mg N kg−1sdw d−1), 5
being significantly lower than in the organic layer under spruce, that again exhibited the highest rate (25.1 mg N kg−1sdw d−1).
Gross N mineralization rates in the Ah horizons were highly significantly (P <0.001) lower than rates in the organic layers under all tree species studied (Fig. 3b), with the rates in the organic layers being up to 35-fold (larch in July) higher than in the respective 10
Ah horizons. There was also no clear seasonal tendency for the magnitude of gross N mineralization in the Ah horizons. The lowest value was found under larch in July (0.5 mg N kg−1sdw d−1), whereas the highest value was determined for soil under oak in April (1.3 mg N kg−1sdw d−1). For soils under beech, oak and larch, the rates were higher in April than in July, in contrast to the results obtained for the Ahhorizons under 15
spruce and pine.
3.4. Gross nitrification rates
Gross nitrification rates in the organic layers showed a seasonal pattern similar to those of soil respiration and gross N mineralization rates (Fig. 2c), i.e. with higher rates in July than in April. The differences in rates of gross nitrification were signifi-20
cantly different between beech and spruce (P <0.05). In April, the gross nitrification rates were lower for the soil under oak (5.0 mg N kg−1sdw d−1) than for the soils of the other four species, with the maximum value found for spruce (11.8 mg N kg−1sdw d−1). In July, the lowest gross nitrification rate was observed in the organic layer under pine (10.5 mg N kg−1sdw d−1), being lower than under oak and larch, and significantly lower 25
than under beech and spruce. Just as for the soil respiration and gross N mineraliza-tion rates, the organic layer under spruce exhibited also the highest gross nitrificamineraliza-tion rates (40.0 mg N kg−1sdw d−1).
BGD
2, 303–331, 2005
Pure stands of temperate forest tree
species N. Br ¨uggemann et al. Title Page Abstract Introduction Conclusions References Tables Figures J I J I Back Close
Full Screen / Esc
Print Version Interactive Discussion
EGU
Gross nitrification rates in the Ah horizons under the five tree species studied were in the range of 0.5 to 1.2 mg N kg−1sdw d−1 (Fig. 3c), and again in all cases highly significantly (P <0.001) lower than in the respective organic layer, that showed up to 54-fold higher gross nitrification rates (beech in July). Analogous to the soil respiration and gross N mineralization rates in the Ahhorizons, there was no clear seasonal change in 5
gross nitrification rates. Although the values for pine were higher in July than in April, they were lower at the same time for beech, oak, spruce, and larch. Again, spruce showed the highest rates (1.2 mg N kg−1sdw d−1 in April, and 1.1 mg N kg−1sdw d−1 in July), followed by larch, pine, oak and beech in April, and by pine, oak, beech and larch in July. Like for the gross mineralization rates in the Ahhorizons, the differences 10
between the means were not significant on the P <0.05 level.
3.5. Relationships between soil respiration and gross N turnover rates
Analyzing the relationships between soil respiration, gross N mineralization and gross nitrification for the different tree stands and soil layers separately revealed a set of dif-ferent correlations (Table 4). In general, the interrelation between the three processes 15
was more pronounced in the organic layer than in the Ah horizon. Significant corre-lations between soil respiration and gross N mineralization were found for the organic layers under beech, larch and spruce. The weakest correlation between the two pro-cesses was observed for the organic layer under pine and for the Ah horizon under oak. The highest, significant or even highly significant correlation coefficients were 20
determined for the relationship between soil respiration and gross nitrification in the organic layers under all five tree species. Even in the Ah horizons still close correla-tions between gross nitrification and soil respiration were found under beech and pine. The closest positive correlation between gross N mineralization and gross nitrification was found in the organic layer under beech, which was the only significant relationship, 25
followed by the Ahhorizon beneath larch and the organic layer under spruce. In all the other soil samples the correlation was less pronounced.
BGD
2, 303–331, 2005
Pure stands of temperate forest tree
species N. Br ¨uggemann et al. Title Page Abstract Introduction Conclusions References Tables Figures J I J I Back Close
Full Screen / Esc
Print Version Interactive Discussion
EGU
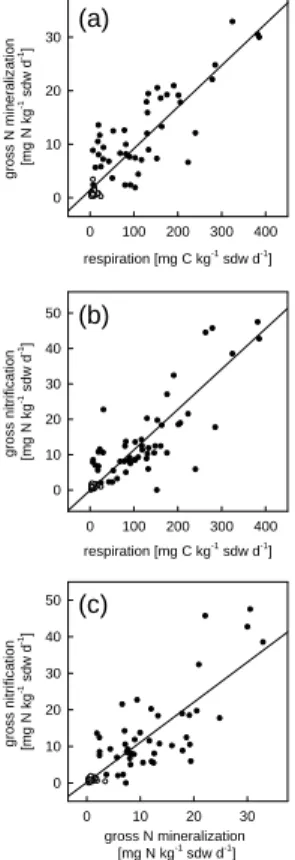
Pooling all available data for one regression analysis resulted in highly significant positive correlations (P <0.0001) between soil respiration and gross N mineralization (Fig. 4a), soil respiration and gross nitrification (Fig. 4b), and gross N mineralization and gross nitrification (Fig. 4c). Again, the closest relationship was found between gross nitrification and soil respiration (r2=0.81), followed by gross N mineralization vs. 5
soil respiration (r2=0.77) and gross nitrification vs. gross N mineralization (r2=0.72).
4. Discussion
4.1. Soil variables
The significant differences in soil respiration, gross N mineralization and gross nitrifi-cation rates observed in our work between the five tree species might be attributable 10
largely to the influences of the tree stands on the soil environment, since trees can determine the biological, chemical and physical conditions in the soil (e.g. Muys and Lust, 1992; Priha et al., 1998, 1999; Binkley and Giardina, 1998; Priha and Smolander, 1999; Augusto et al., 2002). One of the factors governing the soil microbial processes involved in decomposition and transformation of C and N containing compounds is the 15
composition of the litter of the stand-forming tree species, i.e. mainly the C to N ratio as well as the lignin to N ratio of the leaves and needles (Gower and Son, 1992; Stump and Binkley, 1993; Scott and Binkley, 1997). The relatively persistent lignin plays an im-portant role in N transformations, as it is converted preferentially into persistent humic substances during the process of humification, thereby additionally binding inorganic 20
nitrogen compounds and making them unavailable for plants and microbes (Thomas and Prescott, 2000). Besides the quality, the quantity and the timing of litter fall also have crucial effects upon ground vegetation and microbial processes, especially when comparing deciduous with evergreen forests (e.g. Ferrari, 1999). The differences in the thickness of the litter layers of the tree stands we examined reflected this tree species 25
BGD
2, 303–331, 2005
Pure stands of temperate forest tree
species N. Br ¨uggemann et al. Title Page Abstract Introduction Conclusions References Tables Figures J I J I Back Close
Full Screen / Esc
Print Version Interactive Discussion
EGU
The average soil temperature measured in our work during sampling was almost 5◦C lower in April than in July. The soil surfaces under more translucent tree species, such as pine, oak and larch, receive more light and warm up more during the vegetation period than the soils beneath shadier tree species, such as beech and spruce. These differences in the microclimate of the stands might be one of the potential causes for 5
species-specific differences in N turnover rates.
Most of the soil samples were drier in April than in July due to an exceptionally dry period prior to the spring sampling event and a rainy period during the summer sam-pling. The amount and distribution of precipitation reaching the forest floor depends upon the morphology of the stand-forming tree species. Especially needle-leaved trees 10
are characterized by high interception in the crown region, leaving the soil remarkably drier than under broad-leaved deciduous trees (Binkley and Giardina, 1998). Further-more, the spatial distribution of rainfall within a forest can vary greatly, depending on the tree species. For example, in a beech forest most of the precipitation entering the crown region will reach the soil as stem flow, thereby mainly wetting the areas around 15
the boles (Parker, 1983; Rothe, 1997). Although all soil samples were adjusted to the same moisture conditions 10 h before starting the experiments, it can take up to 16 d for microbial populations to adapt to the changed environmental conditions (Andrews et al., 2000). Thus, the history of both soil temperature and soil moisture were probably biasing C and N turnover rates, but the proportion of the bias attributable to one of the 20
two factors could not be quantified. A bias of storing the samples on the magnitude of soil C and N turnover processes can be excluded, because on the one hand samples were treated in the same way and processed within the same time period after each sampling. On the other hand samples from identical sampling positions in each of the five tree stands were processed at the same time to eliminate any effect of storage. 25
The C to N ratios of the organic layers and the Ahhorizons matched the range of C to N ratios described to be typical for temperate forest ecosystems (e.g. Priha et al., 1998; Rustad et al., 2001; Michel and Matzner, 2002), with the C to N ratio of the organic layer under larch being significantly higher than under all other four tree species.
BGD
2, 303–331, 2005
Pure stands of temperate forest tree
species N. Br ¨uggemann et al. Title Page Abstract Introduction Conclusions References Tables Figures J I J I Back Close
Full Screen / Esc
Print Version Interactive Discussion
EGU
The pH values of the soils of the species trial investigated in our study were generally so low that they probably superimposed any potential effect of the tree species on soil pH. However, in general the stand-forming tree species can have a significant influence on the pH at least in the upper layers of the forest soil due to differences in litter composition (Priha and Smolander, 1999). This influence on soil pH can have 5
consequences for soil C and N turnover, as the pH has crucial effects on soil microbial processes (Persson and Wiren, 1993).
4.2. Soil C and N turnover rates
The soil respiration rates in our study were in the range of data published in the litera-ture (e.g. Ross et al., 1999). This also applies for published gross rates of N mineraliza-10
tion (e.g. Hart et al., 1997; Tietema, 1998; Pedersen et al., 1999; Verchot et al., 2001). The gross rates of nitrification found in this work were basically of the same order of magnitude as other data reported by Barraclough and Puri (1995), Hart et al. (1997), Tietema (1998), Ingwersen et al. (1999) and Verchot et al. (2001). Only two values, de-termined in the July samples of the organic layers under beech (32 mg N kg−1sdw d−1) 15
and spruce (40 mg N kg−1sdw d−1) were higher than any previous value reported for temperate forests. Such high rates of gross nitrification have so far only been reported for tropical forest soils (Breuer et al., 2002). However, these two values were also afflicted with the highest standard error (Fig. 2c) due to a high small-scale variability of gross nitrification within the respective tree stand, with so-called hot spots of high 20
microbial activity bordering on areas with much lower N turnover rates (Hesselsoe et al., 2001). For the incubation conditions chosen denitrification rates were very low as compared to gross mineralization and gross nitrification rates and were therefore not shown.
We studied gross rates of N mineralisation and nitrification to assess the full dynam-25
ics of these two processes, although the significance of gross rates for a survey of an effect of forest type on soil N cycling has been questioned (Verchot et al., 2001). But to our understanding, applying the widely accepted hole-in-the-pipe concept (Firestone
BGD
2, 303–331, 2005
Pure stands of temperate forest tree
species N. Br ¨uggemann et al. Title Page Abstract Introduction Conclusions References Tables Figures J I J I Back Close
Full Screen / Esc
Print Version Interactive Discussion
EGU
and Davidson, 1989) for the assessment of N trace gas losses during N turnover re-quires the knowledge of gross rates. This view is also shared by other authors (e.g. Bengtsson et al., 2003).
4.3. Relationships between soil respiration and gross N turnover rates
In general, soil respiration, gross N mineralization and gross nitrification rates were 5
much higher in the organic layers than in the Ah horizons when expressed on a dry weight basis, which is also consistent with the literature (e.g. Pedersen et al., 1999; Ross et al., 1999; Verchot et al., 2001). This finding can be attributed to the much higher availability of fresh organic material and of NH+4 in the organic layer as com-pared to the mineral soil. The significant differences in rates of soil respiration, gross 10
N mineralization and gross nitrification rates between the spring and summer samples were accompanied by considerable differences in soil temperatures as well as in soil water contents between the two sampling dates. Both factors have been shown to have a significant influence on the magnitude of soil C and N turnover processes (e.g. Persson and Wiren, 1993; Breuer et al., 2002), with higher rates of mineralisation and 15
nitrification at higher temperatures and intermediate soil water content.
Soil respiration, gross N mineralization and gross nitrification rates showed a similar pattern with respect to differences between the organic layers and Ah horizons, be-tween spring and summer samples, and bebe-tween the different tree stands. The close relationship between soil respiration and gross nitrification rates points towards a tight 20
coupling of C and N transformations in soils of forest ecosystems, such as the pro-cess of heterotrophic nitrification. A similar coupling has been reported earlier for net nitrification rates and substrate-induced respiration in soil depths greater than 10 cm in Siberian forest (Menyailo et al., 2002). A close relationship between N mineraliza-tion and nitrificamineraliza-tion has also been observed e.g. by Hart et al. (1997) and Menyailo 25
et al. (2002). Nevertheless, the tendency to higher gross nitrification rates compared to the respective gross N mineralization rates, as observed in this work, is not in ac-cordance with data reported by Hart et al. (1997), Pedersen et al. (1999) and Verchot
BGD
2, 303–331, 2005
Pure stands of temperate forest tree
species N. Br ¨uggemann et al. Title Page Abstract Introduction Conclusions References Tables Figures J I J I Back Close
Full Screen / Esc
Print Version Interactive Discussion
EGU
et al. (2001). However, since the experimental plots are located in an area with sub-stantial stock farming, one possible explanation for this unexpected finding might be a significant long term atmospheric supply of NH3to the forest soil that enhances the soil NH+4 pool and, thus, allows higher nitrification than N mineralization rates at least under suitable conditions. Especially during northerly winds NH3is transported to the 5
forest from the surrounding agricultural area (Hovmand et al., 1998; Andersen et al., 1999). Another reason could be a promotion of nitrification compared to N mineral-ization under the experimental conditions chosen. Dissimilatory reduction of NO−3 to NH+4, thereby enhancing the ammonium pool, could be a third explanation. Although this process is observed only under strictly anaerobic conditions (Silver et al., 2001), 10
whilst nitrification is restricted to an aerobic environment, it cannot be excluded that both processes are active simultaneously, as soils can have well aerated macropores bordered by micropores with O2 deficiency (Smith, 1980). Furthermore, in soils with high microbial activity particularly active spots can suffer from O2 depletion (Parkin, 1987).
15
The significant differences in the C and N turnover between the different tree stands demonstrated that the dynamics of soil C and N transformation processes are indeed affected by different tree species. However, in this study we could not resolve to what extent different possible factors, such as differences in litter quality or soil temperature and moisture regimes, contributed to the observed differences in C and N transforma-20
tions. Further studies are required to clarify the contribution of each of the factors, and to establish a broader database for the transfer of the results to other temperate climate regions. They should focus on (i) regional differences due to differences in climate, (ii) year-round measurements to capture seasonal dynamics, and (iii) soils with higher pH to assess a possible tree-species effect on the pH of the soil. The results of these in-25
vestigations will lead to a better process understanding of soil C and N transformations and C and N trace gas production.
Acknowledgements. The work was supported by the European Commission’s fifth framework program in the form of the NOFRETETE project (contract No. EVK2-CT2001-00106).
BGD
2, 303–331, 2005
Pure stands of temperate forest tree
species N. Br ¨uggemann et al. Title Page Abstract Introduction Conclusions References Tables Figures J I J I Back Close
Full Screen / Esc
Print Version Interactive Discussion
EGU
References
Andersen, H. V., Hovmand, M., Hummelshøj, P., and Jensen, N. O.: Measurements of ammonia concentrations, fluxes and dry deposition velocities to a spruce forest 1991–1995, Atmos. Environ., 33, 1367–1383, 1999.
Andersen, H. V., Hovmand, M., Ro-Poulsen, H., Hansen, K., Pilegaard, K., Mikkelsen, T. N., 5
Hummelshøj, P., Jensen, N. O., and Stenholt, C.: Atmosfærisk deposition til skove, in: Næringsstofkredsløb i skove – Ionbalanceprojektet, edited by: Hansen, K., For. Landsc. Res., 33, 33-67, 2003.
Andrews, J. A., Matamala, R., Westover, K. M., and Schlesinger, W. H.: Temperature effects on the diversity of soil heterotrophs and the delta C-13 of soil-respired CO2, Soil Biol. Biochem., 10
32, 699–706, 2000.
Augusto, L., Ranger, J., Binkley, D., and Rothe, A.: Impact of several common tree species of European temperate forests on soil fertility, Ann. For. Sci., 59, 233–253, 2002.
Barraclough, D. and Puri, G.: The use of N-15 pool dilution and enrichment to separate the heterotrophic and autotrophic pathways of nitrification, Soil Biol. Biochem., 27, 17–22, 1995. 15
Bauhus, J., Pare, D., and Cote, L.: Effects of tree species, stand age and soil type on soil microbial biomass and its activity in a southern boreal forest, Soil Biol. Biochem., 30, 1077– 1089, 1998.
Bengtsson, G., Bengtson, P., and Mansson, K. F.: Gross nitrogen mineralization-, immobilization-, and nitrification rates as a function of soil C/N ratio and microbial activity, 20
Soil Biol. Biochem., 35, 143–154, 2003.
Binkley, D. and Giardina, C.: Why do tree species affect soils? The Warp and Woof of tree-soil interactions, Biogeochem., 42, 89–106, 1998.
Breuer, L., Kiese, R., and Butterbach-Bahl, K.: Temperature and moisture effects on nitrification rates in tropical rain-forest soils, Soil Sci. Soc. Am. J., 66, 834–844, 2002.
25
Brooks, P. D., Stark, J. M., McInteer, B. B., and Preston, T.: Diffusion method to prepare soil extracts for automated N-15 analysis, Soil Sci. Soc. Am. J., 53, 1707–1711, 1989.
Cot ´e, L., Brown, S., Pare, D., Fyles, J., and Bauhus, J.: Dynamics of carbon acid nitrogen mineralization in relation to stand type, stand age and soil texture in the boreal mixedwood, Soil Biol. Biochem., 32, 1079–1090, 2000.
30
Davidson, E. A., Hart, S. C., Shanks, C. A., and Firestone, M. K.: Measuring gross nitrogen mineralization, immobilization, and nitrification by N-15 isotopic pool dilution in intact soil
BGD
2, 303–331, 2005
Pure stands of temperate forest tree
species N. Br ¨uggemann et al. Title Page Abstract Introduction Conclusions References Tables Figures J I J I Back Close
Full Screen / Esc
Print Version Interactive Discussion
EGU
cores, J. Soil Sci., 42, 335–349, 1991.
Erickson, H., Davidson, E. A., and Keller, M.: Former land-use and tree species affect nitrogen oxide emissions from a tropical dry forest, Oecologia, 130, 297–308, 2002.
Ferrari, J. B.: Fine-scale patterns of leaf litterfall and nitrogen cycling in an old-growth forest, Can. J. For. Res., 29, 291–302, 1999.
5
Firestone, M. K. and Davidson, E. A.: Microbiological basis of NO and N2O production and consumption in soil, in: Exchange of Trace Gases Between Terrestrial Ecosystems and the Atmosphere, edited by: Andreae, M. O. and Schimel, D. S., John Wiley, Chichester, pp. 7–21, 1989.
Gower, S. T. and Son, Y.: Differences in soil and leaf litterfall nitrogen dynamics for 5 forest 10
plantations, Soil Sci. Soc. Am. J., 56, 1956–1966, 1992.
Hart, S. C., Binkley, D., and Perry, D. A.: Influence of red alder on soil nitrogen transformations in two conifer forests of contrasting productivity. Soil Biol. Biochem., 29, 1111–1123, 1997. Hesselsoe, M., Pedersen, A., Bundgaard, K., Brandt, K. K., and Sorensen, J.: Development
of nitrification hot-spots around degrading red clover (Trifolium pratense) leaves in soil, Biol. 15
Fert. Soils, 33, 238–245, 2001.
Hovmand, M. F., Andersen, H. V., Løfstrøm, P., Ahleson, H., and Jensen, N. O.: Measurements of the horizontal gradient of ammonia over a conifer forest in Denmark, Atmos. Environ., 32, 423–429, 1998.
Ingwersen, J., Butterbach-Bahl, K., Gasche, R., Richter, O., and Papen, H.: Barometric process 20
separation: New method for quantifying nitrification, denitrification, and nitrous oxide sources in soils, Soil Sci. Soc. Am. J., 63, 117–128, 1999.
Kiese, R., Papen, H., Zumbusch, E., and Butterbach-Bahl, K.: Nitrification activity in tropical rain forest soils of the Coastal Lowlands and Atherton Tablelands, Queensland, Australia, J. Plant Nutr. Soil Science-Zeitschrift f ¨ur Pflanzenern ¨ahrung und Bodenkunde, 165, 682–685, 25
2002.
Kirkham, D. and Bartholomew, W. V.: Equations for following nutrient transformations in soil utilizing tracer data, Soil Sci. Soc. Am. Pro., 18, 33–34, 1954.
Menyailo, O. V., Hungate, B. A., and Zech, W.: The effect of single tree species on soil microbial activities related to C and N cycling in the Siberian artificial afforestation experiment – Tree 30
species and soil microbial activities, Plant Soil, 242, 183–196, 2002.
Menyailo, O. V., Hungate, B. A., Lehmann, J., Gebauer, G., and Zech, W.: Tree species of the central Amazon and soil moisture alter stable isotope composition of nitrogen and oxygen in
BGD
2, 303–331, 2005
Pure stands of temperate forest tree
species N. Br ¨uggemann et al. Title Page Abstract Introduction Conclusions References Tables Figures J I J I Back Close
Full Screen / Esc
Print Version Interactive Discussion
EGU
nitrous oxide evolved from soil, Isot. Environ. Health Stud., 39, 41–52, 2003.
Michel, K. and Matzner, E.: Nitrogen content of forest floor Oalayers affects carbon pathways
and nitrogen mineralization, Soil Biol. Biochem., 34, 1807–1813, 2002.
Muys, B. and Lust, N.: Inventory of the earthworm communities and the state of litter decom-position in the forests of Flanders, Belgium, and its implications for forest management, Soil 5
Biol. Biochem., 24, 1677–1681, 1992.
Parker, G. G.: Throughfall and stemflow in the forest nutrition cycle, Adv. Ecol. Res., 13, 57– 133, 1983.
Parkin, T. B.: Soil microsites as a source of denitrification variability, Soil Sci. Soc. Am. J., 51, 1194–1199, 1987.
10
Pedersen, H., Dunkin, K. A., and Firestone, M. K.: The relative importance of autotrophic and heterotrophic nitrification in a conifer forest soil as measured by N-15 tracer and pool dilution techniques, Biogeochem., 44, 135–150, 1999.
Persson, T. and Wiren, A.: Effects of experimental acidification on C and N mineralization in forest soils, Agr. Ecosyst. Environ., 47, 159–174, 1993.
15
Priha, O. and Smolander, A.: Nitrogen transformations in soil under Pinus sylvestris, Picea abies and Betula pendula at two forest sites, Soil Biol. Biochem., 31, 965–977, 1999. Priha, O., Lehto, T., and Smolander, A.: Mycorrhizas and C and N transformations in the
rhizospheres of Pinus sylvestris, Picea abies and Betula pendula seedlings, Plant Soil, 206, 191–204, 1998.
20
Priha, O., Grayston, S. J., Pennanen, T., and Smolander, A.: Microbial activities related to C and N cycling and microbial community structure in the rhizospheres of Pinus sylvestris, Picea abies and Betula pendula seedlings in an organic and mineral soil, FEMS Microbiol. Ecol., 30, 187–199, 1999.
Ross, D. J., Kelliher, F. M., and Tate, K. R.: Microbial processes in relation to carbon, nitrogen 25
and temperature regimes in litter and a sandy mineral soil from a central Siberian Pinus sylvestris L. forest, Soil Biol. Biochem., 31, 757–767, 1999.
Rothe, A.: Einfluss des Baumartenanteils auf Durchwurzelung, Wasserhaushalt, Stoffhaushalt und Zuwachsleistung eines Fichten-Buchen-Mischbestandes am Standort H ¨oglwald, Forstl. Forschungsber. M ¨unch., 163, 1–174, 1997.
30
Rustad, L. E., Campbell, J. L., Marion, G. M., Norby, R. J., Mitchell, M. J., Hartley, A. E., Cornelissen, J. H. C., and Gurevitch, J.: GCTE-NEWS: A meta-analysis of the response of soil respiration, net nitrogen mineralization, and aboveground plant growth to experimental
BGD
2, 303–331, 2005
Pure stands of temperate forest tree
species N. Br ¨uggemann et al. Title Page Abstract Introduction Conclusions References Tables Figures J I J I Back Close
Full Screen / Esc
Print Version Interactive Discussion
EGU
ecosystem warming, Oecologia, 126, 543–562, 2001.
Scott, N. A. and Binkley, D.: Foliage litter quality and annual net N mineralization – comparison across North American forest sites [Review], Oecologia, 111, 151–159, 1997.
Silver, W. L., Herman, D. J., and Firestone, M. K.: Dissimilatory nitrate reduction to ammonium in upland tropical forest soils, Ecology, 82, 2410–2416, 2001.
5
Smith, K. A.: A model of the extent of anaerobic zones in aggregated soils and its potential application to estimates of denitrification, J. Soil Sci., 31, 263–277, 1980.
Ste-Marie, C. and Par ´e, D.: Soil, pH and N availability effects on net nitrification in the forest floors of a range of boreal forest stands, Soil Biol. Biochem., 31, 1579–1589, 1999.
Stump, L. M. and Binkley, D.: Relationships between litter quality and nitrogen availability in 10
Rocky-Mountain forests, Can. J. For. Res., 23, 492–502, 1993.
Thomas, K. D. and Prescott, C. E.: Nitrogen availability in forest floors of three tree species on the same site: the role of litter quality, Can. J. For. Res., 30, 1698–1706, 2000.
Tietema, A.: Microbial carbon and nitrogen dynamics in coniferous forest floor material col-lected along a European nitrogen deposition gradient, For. Ecol. Manage., 101, 29–36, 15
1998.
Verchot, L. V., Holmes, Z., Mulon, L., Groffman, P. M., and Lovett, G. M.: Gross vs. net rates of N mineralization and nitrification as indicators of functional differences between forest types, Soil Biol. Biochem., 33, 1889–1901, 2001.
BGD
2, 303–331, 2005
Pure stands of temperate forest tree
species N. Br ¨uggemann et al. Title Page Abstract Introduction Conclusions References Tables Figures J I J I Back Close
Full Screen / Esc
Print Version Interactive Discussion
EGU
Table 1. Thickness of the organic layer and in situ soil temperatures 5 cm below the surface
under the five tree species investigated.
Spruce Beech Larch Oak Pine
Organic layer [cm] 5.7±0.5a 6.3±0.9 8.0±0.3 3.8±0.5 4.4±0.7 Soil temperature April [◦C] 7.5±0.1 7.7±0.1 8.4±0.2 8.5±0.2 8.5±0.3 Soil temperature July [◦C] 11.9±0.0 12.3±0.1 13.0±0.1 13.3±0.1 14.2±0.1
a
BGD
2, 303–331, 2005
Pure stands of temperate forest tree
species N. Br ¨uggemann et al. Title Page Abstract Introduction Conclusions References Tables Figures J I J I Back Close
Full Screen / Esc
Print Version Interactive Discussion
EGU
Table 2. Values of maximum water holding capacity (MWHC, g H2O 100 g−1 soil dry weight) and soil water content (SWC, g H2O 100 g−1 soil dry weight) of the soil samples prior to the start of the experiments.
MWHC (organic layer) SWC (organic layer) MWHC (Ahhorizon) SWC (Ahhorizon)
April July April July April July April July
Spruce 389.2±45.8a 669.8±30.2 48.2±6.2 211.0±38.8 56.7±7.1 62.8±5.6 14.4±0.8 22.3±2.0 Beech 473.9±66.5 832.8±61.9 207.5±28.6 328.2±35.1 72.7±4.6 59.7±3.7 32.2±5.0 26.0±1.6 Larch 741.8±6.7 748.2±56.7 177.3±11.3 268.9±13.7 59.5±3.1 49.5±1.1 18.5±2.1 19.1±1.6 Oak 330.6±82.5 363.7±60.6 102.0±24.2 170.9±6.1 70.3±2.1 52.6±5.5 29.6±3.1 26.8±0.9 Pine 299.0±23.6 421.4±30.0 133.3±33.4 196.5±29.9 68.3±6.4 54.2±4.9 25.8±2.6 26.2±1.2 a
BGD
2, 303–331, 2005
Pure stands of temperate forest tree
species N. Br ¨uggemann et al. Title Page Abstract Introduction Conclusions References Tables Figures J I J I Back Close
Full Screen / Esc
Print Version Interactive Discussion
EGU
Table 3. Total organic C content, total N content and total organic C to total N ratios of the
organic layers and Ahhorizons under the five tree species studied.
Organic layer Ahhorizon
pH (CaCl2) C [%] N [%] C to N pH C [%] N [%] C to N Spruce 3.07±0.07a 42.59±4.15 1.82±0.12 23.30± 0.78 3.47±0.09 3.64±0.46 0.19±0.02 19.60±0.61 Beech 3.14±0.10 46.56±2.28 2.29±0.08 20.30±0.42 3.31±0.08 4.40±0.49 0.21±0.02 21.10±0.75 Larch 3.11±0.04 49.30±2.13 1.72±0.07 28.63±0.70b 3.52±0.10 2.47±0.30 0.13±0.00 19.07±1.85 Oak 3.22±0.08 38.20±5.03 2.06±0.32 18.67±0.52 3.28±0.06 3.07±0.10 0.18±0.01 17.60±0.10 Pine 3.23±0.08 29.33±9.88 1.40±0.42 20.57±0.94 3.53±0.09 2.89±0.24 0.16±0.01 17.93±0.13
aValues are means ±SEM (N=6 for pH, N=3 for C and N contents and C to N ratios). b
BGD
2, 303–331, 2005
Pure stands of temperate forest tree
species N. Br ¨uggemann et al. Title Page Abstract Introduction Conclusions References Tables Figures J I J I Back Close
Full Screen / Esc
Print Version Interactive Discussion
EGU
Table 4. Pearson coefficients of the correlation between soil respiration, gross N mineralization
and gross nitrification in the organic layers (O) and in the first 5 cm of the mineral soils (Ah).
Spruce Beech Larch Oak Pine
Gross N mineralization vs. O 0.722* 0.919** 0.751* 0.483 0.146 soil respiration Ah 0.582 0.282 0.318 0.118 0.275 Gross nitrification vs. O 0.920*** 0.931*** 0.713* 0.921*** 0.720* soil respiration Ah 0.114 0.716 0.111 0.257 0.688* Gross nitrification vs. O 0.653 0.788* 0.576 0.475 0.305 gross N mineralization Ah 0.304 0.223 0.663 0.144 0.344 *: P <0.05; **: P <0.01; ***: P <0.001
BGD
2, 303–331, 2005
Pure stands of temperate forest tree
species N. Br ¨uggemann et al. Title Page Abstract Introduction Conclusions References Tables Figures J I J I Back Close
Full Screen / Esc
Print Version Interactive Discussion
EGU
24 Figure 1.Scheme of each of the five tree stands of the species trial investigated. The bold numbers indicate the six sampling locations.
Fig. 1. Scheme of each of the five tree stands of the species trial investigated. The bold
numbers indicate the six sampling locations.
BGD
2, 303–331, 2005
Pure stands of temperate forest tree
species N. Br ¨uggemann et al. Title Page Abstract Introduction Conclusions References Tables Figures J I J I Back Close
Full Screen / Esc
Print Version Interactive Discussion EGU respiration [mg C kg -1 sdw d -1 ] 0 100 200 300 400 April July gross N mineralisation [mg N kg -1 sdw d -1 ] 0 5 10 15 20 25
spruce beech larch oak pine
gross nitrification [mg N kg -1 sdw d -1 ] 0 10 20 30 40 50
(a)
(b)
(c)
ab ab ab ab ab ab a b a c a a ab ababc abc abc bcd cd d a a a a a a ab ab bc cFigure 2. Rates of (a) CO2 release, (b) gross N mineralization and (c) gross nitrification
denitrification in the organic layer in soils sampled on 23 April and on 2 July, 2002, from each of the five tree stands investigated. For gross mineralization n = 5, ± SEM; for all other rates n = 6, ± SEM. Significant differences (P < 0.05) between the mean values are indicated by different letters; n.d. = not detected.
Fig. 2. Rates of (a) CO2 release, (b) gross N mineralization and (c) gross nitrification
deni-trification in the organic layer in soils sampled on 23 April and on 2 July, 2002, from each of the five tree stands investigated. For gross mineralization n=5, ±SEM; for all other rates n=6, ±SEM. Significant differences (P <0.05) between the mean values are indicated by different letters; n.d.=not detected.
BGD
2, 303–331, 2005
Pure stands of temperate forest tree
species N. Br ¨uggemann et al. Title Page Abstract Introduction Conclusions References Tables Figures J I J I Back Close
Full Screen / Esc
Print Version Interactive Discussion
EGU
Figure 3. Rates of (a) CO2 release, (b) gross N mineralization and (c) gross nitrification
denitrification in the first 5 cm of the Ah horizon in soils sampled on 23 April and on 2 July,
2002, from each of the five tree stands investigated. For gross mineralization n = 5, ± SEM; for all other rates n = 6, ± SEM. Significant differences (P < 0.05) between the mean values are indicated by different letters.
respi ration [mg C kg -1 sdw d -1 ] 0 5 10 15 April Juli gross N minerali sati on [mg N kg -1 sdw d -1 ] 0.0 0.5 1.0 1.5
spruce beech larch oak pine
gross nitrification [mg N kg -1 sdw d -1 ] 0.0 0.4 0.8 1.2
(a)
(b)
(c)
abc ab ab ab ab ab a a bc cFig. 3. Rates of (a) CO2release,(b) gross N mineralization and (c) gross nitrification
denitrifi-cation in the first 5 cm of the Ah horizon in soils sampled on 23 April and on 2 July, 2002, from
each of the five tree stands investigated. For gross mineralization n=5, ±SEM; for all other rates n=6, ±SEM. Significant differences (P <0.05) between the mean values are indicated by different letters.
BGD
2, 303–331, 2005
Pure stands of temperate forest tree
species N. Br ¨uggemann et al. Title Page Abstract Introduction Conclusions References Tables Figures J I J I Back Close
Full Screen / Esc
Print Version Interactive Discussion EGU 27 respiration [mg C kg-1 sdw d-1 ] 0 100 200 300 400 gross nitrification [m g N kg -1 sdw d -1] 0 10 20 30 40 50 respiration [mg C kg-1 sdw d-1] 0 100 200 300 400 gro s s N mi ne ral iz a ti on [mg N kg -1 sdw d -1] 0 10 20 30 gross N mineralization [mg N kg-1 sdw d-1 ] 0 10 20 30 gro s s nitrification [m g N kg -1 sdw d -1] 0 10 20 30 40 50 (a) (b) (c)
Fig. 4. Correlation between (a) gross mineralization and CO2 release (n=86; r2=0.77,
P <0.0001),(b) gross nitrification and CO2release (n=106, r2=0.81, P <0.0001), and (c) gross
nitrification and gross mineralization (n=85, r2=0.72, P <0.0001). For the regression analysis
the values of all samples from all five tree stands were taken, comprising samples of April and July as well as of the organic layers (•) and the Ahhorizons ( ).