HAL Id: hal-00298890
https://hal.archives-ouvertes.fr/hal-00298890
Submitted on 11 Sep 2007HAL is a multi-disciplinary open access
archive for the deposit and dissemination of sci-entific research documents, whether they are pub-lished or not. The documents may come from teaching and research institutions in France or abroad, or from public or private research centers.
L’archive ouverte pluridisciplinaire HAL, est destinée au dépôt et à la diffusion de documents scientifiques de niveau recherche, publiés ou non, émanant des établissements d’enseignement et de recherche français ou étrangers, des laboratoires publics ou privés.
Recovery of acidified Finnish lakes: trends, patterns and
dependence of catchment characteristics
J. Vuorenmaa, M. Forsius
To cite this version:
J. Vuorenmaa, M. Forsius. Recovery of acidified Finnish lakes: trends, patterns and dependence of catchment characteristics. Hydrology and Earth System Sciences Discussions, European Geosciences Union, 2007, 4 (5), pp.3249-3283. �hal-00298890�
HESSD
4, 3249–3283, 2007 Recovery of acidified Finnish lakes J. Vuorenmaa and M. Forsius Title Page Abstract Introduction Conclusions References Tables Figures ◭ ◮ ◭ ◮ Back CloseFull Screen / Esc
Printer-friendly Version Interactive Discussion
Hydrol. Earth Syst. Sci. Discuss., 4, 3249–3283, 2007 www.hydrol-earth-syst-sci-discuss.net/4/3249/2007/ © Author(s) 2007. This work is licensed
under a Creative Commons License.
Hydrology and Earth System Sciences Discussions
Papers published in Hydrology and Earth System Sciences Discussions are under open-access review for the journal Hydrology and Earth System Sciences
Recovery of acidified Finnish lakes:
trends, patterns and dependence of
catchment characteristics
J. Vuorenmaa and M. Forsius
Finnish Environment Institute, P.O. Box 140, 00251 Helsinki, Finland
Received: 10 November 2006 – Accepted: 6 February 2007 – Published: 11 September 2007 Correspondence to: J. Vuorenmaa ([email protected])
HESSD
4, 3249–3283, 2007 Recovery of acidified Finnish lakes J. Vuorenmaa and M. Forsius Title Page Abstract Introduction Conclusions References Tables Figures ◭ ◮ ◭ ◮ Back CloseFull Screen / Esc
Printer-friendly Version Interactive Discussion
EGU
Abstract
The regional-scale trends (south, central and north Finland) in key acidification param-eters over the period 1990–2003 were studied in lakes used for monitoring of acidifica-tion (157 lakes), and the catchment characteristics that best discriminate between lakes showing recovery (significant increase in alkalinity) and those not showing recovery (no
5
significant increase) were determined. A significant decline in sulphate concentrations occurred in 82–98% of the lakes, depending of the region. Base cation (BC) concentra-tions decreased for most lakes, but to a lesser extent than those of SO4. Consequently, a significant increase in Gran alkalinity occurred in 40–92% of the lakes. The recov-ery from acidification has been strongest in lakes in south Finland, where both levels
10
and decrease of S (and N) deposition have been higher compared to other regions. A significant increase in pH was detected in about 50% of the lakes in the south. Here labile aluminium concentrations also decreased in the most acidic lakes. Recovery has occurred most strongly in lakes which have SO4 as a dominant acid anion, whereas recovery has been weaker in acidified humic lakes which have organic anion as a
dom-15
inant acid anion. The non-recovering lakes in south Finland have higher proportion of exposed bedrock in the catchment, and higher TOC and lower BC concentrations. In central Finland the proportion of peatland and TOC concentrations were higher and the decrease of BC concentration was steeper in non-recovering lakes than in recovering lakes. In north Finland, catchment characteristics, trend slopes and concentrations did
20
not separate the recovering and non-recovering lakes. The non-recovering lakes were also located in regions which are acid-sensitive based on bedrock type, soil properties, weathering rate and runoff. These factors have resulted in lower concentrations and steeper downward trends for base cations.
HESSD
4, 3249–3283, 2007 Recovery of acidified Finnish lakes J. Vuorenmaa and M. Forsius Title Page Abstract Introduction Conclusions References Tables Figures ◭ ◮ ◭ ◮ Back CloseFull Screen / Esc
Printer-friendly Version Interactive Discussion 1 Introduction
Acidification of terrestrial and aquatic ecosystems has been among the most serious environmental threats for decades in large areas of Europe and north America. Acidifi-cation of rivers and lakes has been a major environmental problem in northern Europe in the Nordic Countries (Finland, Sweden, Norway), where the relative sensitivity of
5
surface waters to acidic deposition is high due to acid-sensitive geology. Sulphur de-position has been the major driving force in the anthropogenic acidification of lakes there (e.g. Skjelkv ˚ale et al., 2001a), resulting in the loss and damage of fish stocks and reduced biodiversity (Tammi et al., 2003a).Due to the implementation of success-ful emission reduction measures, the total European emissions of SO2 declined 67%
10
from 1980 to 2000 (L ¨ovblad et al. 2004). As a consequence, S deposition has declined over extensive areas in Europe. In Finland, sulphate deposition has decreased 30% in the north and up to 60% in south Finland since the late 1980s (Vuorenmaa, 2004). Base cation deposition has also declined somewhat. After a decline in the 1980s the base cation deposition leveled out in the 1990s (Ruoho-Airola et al., 2003; Vuorenmaa,
15
2004; Ukonmaanaho and Starr, 2002). The decline of SO4 deposition has exceeded the decline of base cation deposition, particularly deposition of Ca and Mg, resulting in the decrease of H+and acidifying potential (defined as [SO4] – [Ca + Mg]) in deposition throughout the country (Vuorenmaa, 2004).
The decreasing S deposition has resulted in the recovery of sensitive surface waters
20
from acidification (e.g. Stoddard et al., 1999; Evans et al., 2001; Skjelkv ˚ale et al., 2005). In Finland, the regional-scale assessment for the period 1990–1999 showed a statistically significant decline in sulphate concentrations in 80% of the lakes in south and central Finland, and in 60% of lakes in north Finland. A significant increase in Gran alkalinity was detected in 60% of the lakes in the south, but only 20–25% of the lakes in
25
central and north Finland (Forsius et al., 2003). Many lakes in these regions have been exposed to modest load of sulphur deposition and were, therefore, expected to show lower recovery (alkalinity) responses compared to most affected areas in south Finland.
HESSD
4, 3249–3283, 2007 Recovery of acidified Finnish lakes J. Vuorenmaa and M. Forsius Title Page Abstract Introduction Conclusions References Tables Figures ◭ ◮ ◭ ◮ Back CloseFull Screen / Esc
Printer-friendly Version Interactive Discussion
EGU The site-specific analysis between the deposition and lake data showed that in many
lakes changes in alkalinity did not correspond consistently to changes in concentrations of sulphate and charge-balance ANC in bulk precipitation (Forsius et al., 2003), and the variation in alkalinity trends between the lakes within the regions cannot be explained by deposition pattern alone.
5
Recovery of lakes from acidification can be expected to show different paths, which are partly dependent on catchment attributes. Characteristic for many forested catch-ments in Finland is thick acidic organic soil horizons under coniferous forests and a high proportion of peatlands, a source of large amounts of humic matter for lakes. Therefore Finnish lakes are greatly influenced by natural organic acids, particularly in
10
central and north Finland (Kortelainen and Mannio, 1990). In the pH range 4-7 a sig-nificant fraction of organic acids can be considered strong and have large influences on pH and alkalinity (e.g. Brakke et al., 1987; Munson and Gherini, 1993). Hydrology-induced inputs of organic acids may reflect directly on alkalinity values and suppress the recovery (Mannio, 2001a).
15
In this paper, the regional recovery of lakes in Finland from acidification is described. The aims are: (i) to present trends in lake water acidification chemistry in south, cen-tral and north Finland for the period 1990–2003 and (ii) to determine the catchment characteristics that best discriminate between lakes showing recovery and those not showing recovery.
20
2 Materials and methods
2.1 Dataset
2.1.1 Monitoring lakes
The study comprised 157 lakes of the Finnish network of Regional Monitoring of Lake Acidification (RMLA) (Fig. 1) with data for the 14 year period, 1990–2003. A water
HESSD
4, 3249–3283, 2007 Recovery of acidified Finnish lakes J. Vuorenmaa and M. Forsius Title Page Abstract Introduction Conclusions References Tables Figures ◭ ◮ ◭ ◮ Back CloseFull Screen / Esc
Printer-friendly Version Interactive Discussion
sample from each lake was taken each year, either from the middle of the lake (1 m depth) or at the outlet, during the autumn thermal overturn phase. For 93 of the lakes there is a full set of data for all 14 years, and for 139 lakes have data for 13 years, and the remainder, at least 10 years of data.
Catchment characteristics, including lake and catchment area, areas of peatland,
5
exposed bedrock and agricultural land and hydrological type, were determined from topographic maps (1:20 000). The hydrological type of the lake was classified as: seepage (inflow or no inflow, no outflow), headwater (no inflow, outflow), or drainage lake (upstream lakes above a study lake, outflow). Ditching of forest soils is the most important direct human disturbance in the study catchments. The occurrence of
ditch-10
ing was estimated from maps. The water retention time of the lakes was estimated from lake bathymetry and runoff data for similar catchments (Mannio, 2001b), as runoff for the RMLA lakes has not been measured. The RMLA lakes are mainly small (me-dian area=10 ha) seepage lakes or headwater lakes (117 lakes with no upstream lakes and 32 drainage lakes with< 5 % upstream lake area in the catchment). Land cover
15
is mainly forest (122 lakes in catchments with no agriculture and only 7 lakes in catch-ments with> 3 % area under agriculture). Chemically the lakes are acid sensitive with low base cation concentrations (Mannio and Vuorenmaa, 1995).
2.1.2 Chemical analyses
The water samples were analyzed in the laboratories of Environment Administration
20
using standard methods. The following variables are dealt with in this paper: pH, Gran alkalinity, and concentrations of base cations (BC=calcium (Ca) + magnesium (Mg) + sodium (Na) + potassium (K)), sulphate (SO4), chloride (Cl), nitrate (NO3) and to-tal organic carbon (TOC). Measurements of aluminium fractions were only included in the routine analysis from 1992. Labile Al (All ab) was calculated as the difference of
25
total reactive and non-labile Al. Ion concentrations are expressed asµeq l−1
, except pH, TOC (mg l−1) and All ab (µg l−1
). Calculated acid neutralizing capacity, charge-balance ANC (ANC ), was defined as the equivalent sum of base cations minus the
HESSD
4, 3249–3283, 2007 Recovery of acidified Finnish lakes J. Vuorenmaa and M. Forsius Title Page Abstract Introduction Conclusions References Tables Figures ◭ ◮ ◭ ◮ Back CloseFull Screen / Esc
Printer-friendly Version Interactive Discussion
EGU equivalent sum of strong mineral acid anions (BC) - (SO4 + NO3 + Cl). Non-marine
fractions of sulphate (xSO4) and sum of base cations (xBC) were estimated as the dif-ferences between total concentrations and concentrations attributable to marine salts, the latter based on ratios to Cl in seawater. Concentrations of organic anions (A−) were estimated from TOC concentrations and pH using the model presented by
Korte-5
lainen (1993a). In this model an empirical measure for organic anions has been devel-oped using titration results of isolated hydrophobic and hydrophilic acids (second-order equations as a function of pH) combined with the fractionation results of DOC (propor-tions of acid frac(propor-tions). This model describes the dissociation of organic acids, and requires pH and DOC /TOC concentration of the water samples.
10
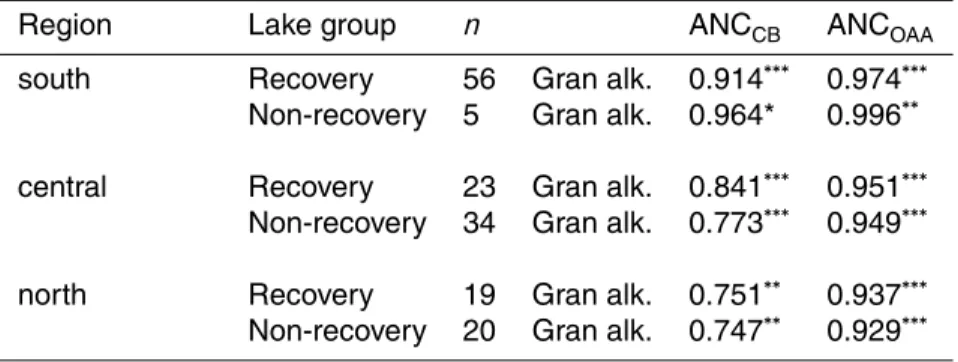
The contribution of strong organic acids to buffering capacity was estimated using the method presented by Lydersen et al. (2004), in which a modified expression for ANCCB, the strong organic acid adjusted ANC (ANCOAA) in which permanent anionic charge from strong organic acids is included:
ANCOAA= ANCCB−(1/3CD)∗TOC, (1)
15
where CD is charge density of the organic matter (µeq/mg of C). A CD value of 9.7, based on studies from Finnish lakes (Kortelainen, 1993a), was used. This value agrees well with the value 10.2µeq/mg of DOC) used by Lydersen et al. (2004), reported from the Swedish humic lakes (Hruska et al., 2003).
2.1.3 Statistical methods
20
Trends in acidification for the period 1990–2003 were analysed by a regional approach using three geographical regions: south (n=61), central (n=57) and north Finland (n=39) (Fig. 1). The division of the data was based on the monitoring of the long-range transboundary air pollution impacts in lakes reflecting both different environmental con-ditions and gradients in initial ionic concentrations, deposition levels and trend slopes,
25
decreasing from south-to-north (Mannio and Vuorenmaa, 1995). Monotonic trends for each study lake were tested using the non-parametric Kendall-τ test, and a p value of
HESSD
4, 3249–3283, 2007 Recovery of acidified Finnish lakes J. Vuorenmaa and M. Forsius Title Page Abstract Introduction Conclusions References Tables Figures ◭ ◮ ◭ ◮ Back CloseFull Screen / Esc
Printer-friendly Version Interactive Discussion
<0.05 was used to indicate statistically significant trends. The gradients of the trends (change per year) were calculated using the Sen slope estimation method (Sen, 1968). As the data of Allabwere limited, they were excluded from the statistical trend analysis. At sites where pH was>6.2 the laboratories did not analyze aluminium. At many sites inorganic bound aluminium was below the detection limit (<10 µg l−1).
5
The trend of Gran alkalinity was used as a measure of acidification recovery. Alka-linity provides a measure of the buffering capacity of waters, and the most important anions in buffering systems of natural waters are primarily bicarbonate (carbonate sys-tem) and weak organic acids.
The lakes within the region were divided into two groups: those having a
statistically-10
significant increase (p<0.05) in alkalinity (recovering) and those having no significant increase (non-recovering). These two groups (recovering and non-recovering) were tested for statistically-significant differences in terms of catchment characteristics and other chemical parameters using the Wilcoxon rank-sum (Mann-Whitney) test and discriminant analysis using logistic regression. The latter is frequently used
alterna-15
tive non-parametric application of “classical” discriminant analysis (Press and Wilson, 1978; Tabachnick and Fidell, 1996). The Mann-Whitney test is non-parametric test to compare two unpaired groups, and a p value of <0.05 was used to indicate sta-tistical difference in the population medians. A logistic regression model was applied with ’recovering’ and “non-recovering” as the dependent dichotomy variable (classes),
20
and the following as independent variables: catchment characteristics lake area (ha), catchment area (ha), catchment-to-lake ratio, proportion of peatland (%), proportion of exposed bedrock area (%), retention time (year), and chemical parameters trend slope values (1990–2003) and concentrations (median 1990–2003) of xSO4, xBC and TOC. A forward selection procedure was used with a significance level of 0.15 for
en-25
try into the model (PROC LOGISTIC, SAS Institute Inc., 1989). In most applications, all variables considered had some discriminatory power. To choose the model that provides the best discrimination using the sample estimates, a moderate significance level is appropriate (SAS Institute Inc., 1989). The Wald Chi-Square test (maximum
HESSD
4, 3249–3283, 2007 Recovery of acidified Finnish lakes J. Vuorenmaa and M. Forsius Title Page Abstract Introduction Conclusions References Tables Figures ◭ ◮ ◭ ◮ Back CloseFull Screen / Esc
Printer-friendly Version Interactive Discussion
EGU likelihood estimators) was used to test the significance of individual logistic regression
coefficients for each independent variable. Measures of the effectiveness (predictive ability) of the model were interpreted by percentages of concordant and discordant pairs. The lakes were paired between the recovery groups and the pair was concor-dant (discorconcor-dant) if the lake which belong to the recovery group had a higher (lower)
5
fitted probability belong to the recovery group; ties (no concordant/discordant pairs) occured when two lakes in the lake pair had the same predictor sets.
3 Results
3.1 Regional characteristics of water chemistry
Concentrations of sulphate and base cations in lakes are greatest in south Finland
10
(Fig. 2). In north Finland, the lakes are more dilute with low ion concentrations, and lower ANCCB and Gran alkalinity. ANCCB is somewhat higher in central Finland due to higher base cations to sulphate ratio. The concentrations of Allab are somewhat higher in south Finland compared to other regions. Based on the median values in 1990–2003, the percentiles (25, median, 75 and 90%) in aluminium concentrations
15
of the lakes were: <10, 10, 40 and 70 µg l−1 in south, <10, 10, 20 and 20 µg l−1 in central, and<10, <10, 10 and 20 µg l−1 in north Finland, respectively. Nitrate con-centrations were low in comparison to lakes in the other Nordic countries and central Europe (Skjelkv ˚ale et al., 2001b). 90% of the lakes in all regions had median con-centrations <2 µeq l−1. Nitrate concentrations were slightly higher in south Finland
20
(median 0.8µeq l−1
) compared to central and north Finland (0.6 and 0.4µeq l−1 , re-spectively). TOC concentrations were the highest in the lakes of central Finland, where the proportion of peatlands in the catchments is the highest. The median proportion of peatland coverage is 24% in central Finland compared to 7% and 22% in south and north Finland, respectively. Ditching and draining of peatlands have been widely
25
ditch-HESSD
4, 3249–3283, 2007 Recovery of acidified Finnish lakes J. Vuorenmaa and M. Forsius Title Page Abstract Introduction Conclusions References Tables Figures ◭ ◮ ◭ ◮ Back CloseFull Screen / Esc
Printer-friendly Version Interactive Discussion
ing were in central Finland, 65% of the catchments compared to 16% and 26% of the catchments in south and north Finland, respectively.
4 Trends in concentrations 1990–2003
4.1 Sulphate and base cations
A statistically-significant decreasing trend in xSO4concentrations was detected in 98%
5
of lakes in south Finland, 95% of lakes in central Finland and 82 % of lakes in north Finland (Fig. 3). The slopes of the trend for sulphate were the greatest for lakes in south Finland. The median slope was –4.1µeq l−1
yr−1, compared to –1.8µeq l−1 yr−1 for central Finland and –1.4µeq l−1
yr−1 for north Finland. The trends in base cation concentrations were decreasing for most lakes, but to a lesser extent than those of
sul-10
phate (Fig. 4). For those lakes with downward trends of xBC (n=121), in only five lakes in central and in 10 lakes in north Finland ∆xBC > ∆xSO4. A statistically significant de-creasing trend for xBC concentrations was detected in 23–43% of the lakes, and some lakes exhibited significant increases, depending on the region (Figs. 3,4). The median annual change for xBC concentration was –0.97µeq l−1
yr−1 in south, –0.63µeq l−1
15
yr−1in central and –0.74µeq l−1yr−1in north Finland. 4.2 Gran alkalinity and charge-balance ANC
Gran alkalinity (measured) and ANCCB(calculated) increased significantly in 92% and 82% of the lakes in south, 40% and 42% in central and 49% and 21% in north Finland, respectively (Fig. 3). In the whole study lake set in south Finland, all the slopes of
20
alkalinity and ANCCBin 1990–2003 were increasing, and 84% and 88% of the lakes in central Finland and 97% and 82% of lakes in north Finland showed increasing trends in alkalinity and ANCCB, respectively. The median annual changes for Gran alkalinity and ANCCB were 1.9 and 2.4µeq l−1
yr−1 in south, 1.0 and 1.1µeq l−1
HESSD
4, 3249–3283, 2007 Recovery of acidified Finnish lakes J. Vuorenmaa and M. Forsius Title Page Abstract Introduction Conclusions References Tables Figures ◭ ◮ ◭ ◮ Back CloseFull Screen / Esc
Printer-friendly Version Interactive Discussion
EGU and 1.1 and 0.7µeq l−1yr−1in north Finland, respectively.
4.3 pH and aluminium
pH increased significantly (H+ decreased) in about half of lakes in south Finland (Fig. 3), and in 30% of all the lakes. The median annual change for H+was –0.045µeq l−1yr−1in south, –0.033µeq l−1
yr−1in central and –0.013µeq l−1
yr−1in north Finland,
5
respectively. Low pH is associated with high concentrations of labile aluminium. De-creases in acidity were reflected in decreasing labile aluminium concentrations in the formerly most acidic but now recovering lakes (Fig. 5). The decrease was substantial in the lakes in south Finland in which high Allab concentrations>200 µg l−1
occurred in the early 1990s. The median concentration of Allab in the study lakes decreased from
10
40µg l−1to 10µg l−1between 1992 and 2003. 4.4 Nitrate
Nitrate concentrations are very much dependent on temperature-driven biological ac-tivity, and therefore sensitive to annual and lake-to-lake variation. Nitrate concentra-tions decreased significantly in 20–60% of the lakes (Fig. 3), and in 70–80% of the
15
lakes decreasing trends were observed, depending on the region. The median annual change for NO3 was –0.048µeq l−1 yr−1 in south, –0.024µeq l−1 yr−1 in central and –0.020µeq l−1
yr−1in north Finland, respectively. 4.5 Total organic carbon (TOC)
Increasing trend slopes for TOC and organic anions (A−) were found in 85% of the
20
lakes in south Finland, and were significant in 21% and 28% of the lakes, respectively (Fig. 3). The median annual changes for TOC and organic anions were 0.04 mg l−1 yr−1 and 0.51µeq l−1 yr−1 in south, 0.0 mg l−1 yr−1 and –0.16µeq l−1 yr−1 in central and 0.02 mg l−1yr−1and 0.15µeq l−1yr−1in north Finland, respectively.
HESSD
4, 3249–3283, 2007 Recovery of acidified Finnish lakes J. Vuorenmaa and M. Forsius Title Page Abstract Introduction Conclusions References Tables Figures ◭ ◮ ◭ ◮ Back CloseFull Screen / Esc
Printer-friendly Version Interactive Discussion 5 Recovery and catchment characteristics
The combination of catchment characteristics in south Finland that best reveal the differences between two recovery groups were proportions of exposed bedrock, peat-land, and catchment-to-lake ratio (Table 2). The non-recovering lake group was char-acterized by catchments having a higher proportions of exposed bedrock and larger
5
catchment-to-lake ratio (Table 1). The percentile distributions showed, however, only a little difference in proportion of peatland between the groups (Table 1). Concentra-tions of TOC and base caConcentra-tions distinguished between recovery groups, and the non-recovering lakes exhibited higher TOC and lower xBC concentrations. TOC and ex-posed bedrock had the highest effect among the independent chemical and catchment
10
variables, respectively. The percent concordant pairs described predicted probability that classification of lakes is successful based on selected independent variables, and they ranged from 84% to 86%, and percent tied pairs were 0.3% (Table 2). Although not selected into the model, the non-recovering lakes have also smaller lake and catch-ment size and shorter water retention time (Table 1).
15
Correlation between trends of alkalinity and xSO4 concentrations in lakes was weaker in central Finland than in south Finland. There is a geographical pattern be-tween the recovery groups in the region of central Finland. The recovering lakes are located mainly in the southern part of the central Finland region, whereas most of the non-recovering lakes are clustered in the northern part (Fig. 1). The catchment
char-20
acteristics that distinguished between the recovering and non-recovering lakes were: proportional area of peatlands, catchment-to-lake ratio and water retention time (Ta-ble 2). Percentage of peatland and catchment-to-lake ratio were higher and retention time was shorter in the non-recovering lake group (Table 1). Concentrations of TOC ( and organic anion) and sulphate distinguished between recovery groups, and the
25
non-recovering lakes exhibited higher TOC (and A−) and lower xSO4 concentrations. For the trend slopes, discriminatory effect was associated with base cations and sul-phate,with more downward trends and steeper slopes for xBC, and gentler decreases
HESSD
4, 3249–3283, 2007 Recovery of acidified Finnish lakes J. Vuorenmaa and M. Forsius Title Page Abstract Introduction Conclusions References Tables Figures ◭ ◮ ◭ ◮ Back CloseFull Screen / Esc
Printer-friendly Version Interactive Discussion
EGU for xSO4in the non-recovering lakes. Mann-Whitney tests were significant for
propor-tion of peatland, catchment-to-lake ratio and retenpropor-tion time and concentrapropor-tions (TOC, xSO4) and change in xBC concentrations (Table 3). Non-recovering lakes were more acidic than the recovering lakes, indicated by somewhat lower median value of pH and alkalinity, and acid-sensitive determined by lower xBC and ANCCB (Table 1). Except
5
for pH, statistical differences were not found for these parameters between the lake groups.
About half of the monitoring lakes in the north Finland did not show significant in-crease in alkalinity, and these lakes are found in scattered areas in the region (Fig. 1, Fig. 3). The catchment characteristics and magnitude of trends (slopes) did not
distin-10
guish between recovering and non-recovering lakes (Table 2). Nonetheless, in concen-trations some statistical differences although weak (p<0.1) were found for xSO4, being higher in non-recovering lake group (Table 1, Table 3). These lakes appear to have somewhat lower TOC (and A−) concentrations and higher xSO4/A− – and xSO4 /xBC-ratios, having also slightly steeper xBC decrease, gentler ANCCBincrease, and mostly
15
lower concentrations of ANCCBcompared to the recovering lake group.
6 Discussion
6.1 Regional characteristics and trends in water chemistry
Concentrations of major ions in lakes decrease from south Finland towards the north (Fig. 2). Finland is situated in northern Europe and spans ten degrees of latitude (from
20
60◦N to 70◦N) resulting in wide environmental gradients, particularly in atmospheric deposition. Deposition of sulphur from domestic emission sources and of transbound-ary air pollution have been highest in south Finland, resulting in the gradient in lake xSO4 concentrations. Bulk deposition of sulphate in south Finland has been on av-erage 1.4-fold higher compared to central and 2.3-fold higher compared to north
Fin-25
high-HESSD
4, 3249–3283, 2007 Recovery of acidified Finnish lakes J. Vuorenmaa and M. Forsius Title Page Abstract Introduction Conclusions References Tables Figures ◭ ◮ ◭ ◮ Back CloseFull Screen / Esc
Printer-friendly Version Interactive Discussion
est in south Finland due to higher atmospheric deposition (Ruoho-Airola et al., 2003; Vuorenmaa, 2004) and more intense weathering and ion-exchange from the thicker and better buffered soils (K ¨am ¨ari et al., 1991). Higher sulphur deposition there has also increased leaching of base cations in runoff (e.g. Kortelainen et al., 1989). In north Finland, the low ion concentrations in lakes are due to both modest load of air
5
pollution and geochemical inactive bedrock overlain by thin layers of coarse-grained till deposits. Inherently acid-sensitive catchments with low buffering capacity are charac-teristic in many parts of Finnish Lapland (K ¨ahk ¨onen, 1996). Although the proportion of peatlands in the catchment area is also high in north Finland, the TOC concentrations are low compared with central region. The colder climate and consequently longer soil
10
frost period, lower primary production and decomposition, coupled with thinner soil and peat deposits, are likely to decrease the leaching of organic carbon, resulting in lower TOC concentrations in the lakes (Kortelainen, 1993b).
The decline of xSO4concentrations is strongest in south Finland, which is due to the combined effect of greatest decline of sulphur both in bulk deposition and dry deposition
15
(Ukonmaanaho et al., 1998; Ukonmaanaho and Starr, 2002) and relatively high initial concentrations in lakes. The decrease of base cation concentrations has also been the steepest in south Finland. The supply of base cations to the lake is reduced due to the steep decrease of mobile sulphate anion. As with sulphate deposition, the base cation deposition has decreased most strongly in south Finland (Forsius et al., 2003;
20
Vuorenmaa, 2004). According to Mannio (2001b), the slope of xBC trend in lakes is steeper in south Finland than in other regions due to lower proportion of peatland and higher proportion of exposed bedrock in the catchment and longer water retention time (Table 1). These characteristics may have influenced the biogeochemical processes affecting sulphate as well.
25
The lakes in south Finland have experienced the strongest increase in alkalinity and ANCCBcompared to central and north Finland. A more gentle decline in lake water xBC concentrations compared to that of xSO4(Fig. 4) is a key condition for improving acid-base status and buffering capacity in soil and water. Correspondingly, chemical
recov-HESSD
4, 3249–3283, 2007 Recovery of acidified Finnish lakes J. Vuorenmaa and M. Forsius Title Page Abstract Introduction Conclusions References Tables Figures ◭ ◮ ◭ ◮ Back CloseFull Screen / Esc
Printer-friendly Version Interactive Discussion
EGU ery of the lakes has been most evident in the southern portions of Sweden and Norway
(Skjelkv ˚ale et al., 2005). The non-marine sulphate to organic anion ratio (xSO4/A−) was greater than 1 in 92% of the lakes in south Finland (Fig. 1, Table 1), due to greater sul-phur deposition and lower amount of peatlands in the catchments. Decreased sulsul-phur deposition (and acidifying potential in deposition) have caused increases in alkalinity
5
in lakes. Sulphate concentrations exceeded organic anion concentrations in only 30% of the lakes in central and north Finland, and the influence of mineral acids is signif-icantly superimposed on organic acid contributions to acidity in these regions. The signs of increasing alkalinity in north Finland are not reflected in the same way in cal-culated ANCCB. The small headwater or seepage lakes in north Finland have low ionic
10
strength (with xBC typically<100 µeq l−1) that have had only modest impacts from air pollutants. Variation in hydrological regimes can cause pronounced inter-annual vari-ations in ion concentrvari-ations, causing ’noise’ in time series (Skjelkv ˚ale et al., 2006). Recovery from acidification in the Finnish lakes has continued after 2000. A significant increasing trend in alkalinity occurred in 27% of the monitoring lakes during 1990–1999
15
(Forsius et al., 2003), whereas alkalinity had significantly increased in 60% of the lakes by 2003. The trend for up to 2003 in the present study showed that the decrease in xBC concentrations had slowed down, which confirms the continued positive trends in ANCCBand alkalinity. Nearly all the slopes of alkalinity and ANCCBin 1990–2003 were increasing, which may indicate that regional-scale recovery might be a more common
20
phenomenon than shown by the statistically significant results alone.
The increase of pH was less common than changes in alkalinity. A significant in-crease in pH (and dein-crease in H+) has been most common in south Finland. A signif-icant increase in lake water pH has also been observed in southern parts of Sweden and Norway, and results from individual sites there have shown decreases of labile
25
aluminium concentrations simultaneously with increasing pH (Skjelkv ˚ale et al., 2005). Highest labile aluminium concentrations were found in south Finland, showing also decline with increasing pH.
HESSD
4, 3249–3283, 2007 Recovery of acidified Finnish lakes J. Vuorenmaa and M. Forsius Title Page Abstract Introduction Conclusions References Tables Figures ◭ ◮ ◭ ◮ Back CloseFull Screen / Esc
Printer-friendly Version Interactive Discussion
in Finnish lakes (Mannio, 2001a; Forsius et al., 2003). The nitrate pattern with predom-inantly decreasing concentrations suggests that there are presently no indications of elevated nitrate levels in forested Finnish lakes. Seasonally monitored lakes in Finland show no or decreasing trends in NO3 concentrations (Forsius et al., 2001; Kleemola and Forsius, 2006). European nitrogen emissions and nitrogen deposition have been
5
decreasing in Finland during the 1990s (Ruoho-Airola et al., 2004; Vuorenmaa 2004). Concentrations of TOC has increased in many lakes in south Finland. Increased DOC concentrations over the last two decades have been documented across substan-tial parts of northern and central Europe (Skjelkv ˚ale et al., 2001a; Evans et al., 2005; Skjelkv ˚ale et al., 2005) and eastern north America (Stoddard et al., 2003). Vuorenmaa
10
et al. (2006) studied changes of TOC concentrations over the period 1987–2003 in 13 seasonally monitored acid-sensitive lakes located throughout the Finland, and ten of the lakes showed a highly significant increase. This may indicate that significant increasing TOC trends might be a more common phenomenon than detected in the present study by only autumn samples alone. A gradual decline of the sulphur
de-15
position is one of the proposed drivers underlying the increased DOC concentrations (Stoddard et al., 2003; Evans et al., 2005; Vuorenmaa et al., 2006). This hypothesis is based on the proposed inverse relationship between mineral acidity and organic acidity (Krug and Frink, 1983), or decreased ionic strength of soil solutions (Tipping and Hur-ley, 1988; Evans Jr et al., 1988; Vance and David, 1989), which would increase DOC
20
flux. Vuorenmaa et al. (2006) showed that larger initial xSO4concentrations, larger de-cline in xSO4 concentrations and larger increases in charge-balance ANC have been accompanied by larger increases in TOC. These attributes are common for lakes in south Finland. If increased DOC is primarily related to decreased sulphur deposition, the DOC trends may indicate recovering soil conditions from mineral acid deposition.
25
On the other hand, increase in pH and alkalinity of the most acidified surface waters may be buffered by increasing organic acidity. Several interacting factors may deter-mine the long-term changes in organic carbon in surface waters, but detailed analysis of the drivers is beyond the scope of this paper.
HESSD
4, 3249–3283, 2007 Recovery of acidified Finnish lakes J. Vuorenmaa and M. Forsius Title Page Abstract Introduction Conclusions References Tables Figures ◭ ◮ ◭ ◮ Back CloseFull Screen / Esc
Printer-friendly Version Interactive Discussion
EGU
7 Regional recovery patterns and catchment characteristics
7.1 South Finland
The non-recovering lakes have a low pH, alkalinity and slightly elevated labile alu-minium concentrations (Table 1), and a high proportion of exposed bedrock in the catchment and low lake water xBC concentrations, characteristics for acid-sensitive
5
catchment with poor base cations pool and low neutralization properties. The bedrock and soil in acid-sensitive areas in south Finland are composed of granite or other acidic siliceous rocks, and overburden usually consists of thin soil layers and coarse soil types such as till, sand and gravel (K ¨am ¨ari, 1986; Nuotio et al., 1990; Huttunen et al., 1990). The non-recovering lakes have slightly steeper downward trends in xBC and somewhat
10
less steep decrease in xSO4, and exhibited smaller increases in ANCCB than recov-ering lakes (Table 1). However, the median ANCCBvalue of the non-recovering lakes was higher than that of the recovering lake group and trend slopes are increasing. A significant increasing trend in ANCCB was detected in 40% of the lakes. It is ap-parent that also other factors than acid-sensitive characteristics in the catchment may
15
have buffered the alkalinity increase. Peatland was important in distinguishing the non-recovering lakes, as indicated by high concentrations of TOC (Table 1, Table 2, Fig. 6). The peatland even in catchments with low peatland coverage are mainly located in the riparian zone of the lakes in the lower part of the catchment, where it contributes to the runoff and lake water chemistry (Schiff et al., 1998). Organic acidity derived from the
20
peatlands is an important contributor to buffering capacity and acidity in non-recovering lakes, as indicated by lower xSO4 to A− and higher A− to xBC ratios. Taking the or-ganic anion into account in the sensitivity concept (xBC - A−) (Forsius, 1989), the high content of humic matter increase the acid-sensitivity in these lakes. The level of ’origi-nal’ ANCCB, which behaves conservatively to TOC changes (e.g. Neal et al., 1999), is
25
higher but the organic acid adjusted ANCOAA is lower in non-recovering lakes than in recovering lakes (Table 1, Fig. 6). The inter-annual variation in TOC was reflected in pH and alkalinity values in non-recovering lakes (Fig. 6). The elevated TOC (and A−)
con-HESSD
4, 3249–3283, 2007 Recovery of acidified Finnish lakes J. Vuorenmaa and M. Forsius Title Page Abstract Introduction Conclusions References Tables Figures ◭ ◮ ◭ ◮ Back CloseFull Screen / Esc
Printer-friendly Version Interactive Discussion
centrations in the early 1990s and in 1997-2001, induced by high autumn runoff events coincided with decrease of pH and depressions of ANCOAAand alkalinity. There is also one climate-driven possibility, in which ions may be diluted due to elevated water input directly from precipitation and by discharge from the catchment (Clair, 1992; Mitchell et al., 2001).
5
7.2 Central Finland
The lakes in the southern part of central Finland region have received greater sulphate deposition and are also subjected to higher decline of S deposition than the lakes in the northern part, and exhibited both higher xSO4 concentrations and steeper decline in concentrations in lakes. Sulphate derived minerogenic acidity has been the
dom-10
inant acidifying agent in these lakes, and decreased mineral acid input has caused more directly increase of buffering capacity in lakes. The non-recovering lakes which are clustered mostly in the northern part, have higher TOC concentrations and higher contribution of organic acids to the acid-base status and acidity, and were somewhat more acidic compared to recovering lakes, indicated by lower median pH values and
15
alkalinity (Table 1, Fig. 6). The non-recovering lakes have lower xSO4to A−
and higher A− to xBC ratios and lower (xBC - A−) (Table 1). Subtracting strong organic acid ad-justed ANC (ANCOAA) from original charge-balance ANC (ANCCB), the difference is larger in non-recovering lakes (ANCCB- ANCOAAmedian difference 39 µeq l−1) than in recovering lakes (median difference 23 µeq l−1). Kortelainen (1993a) has shown that
20
Gran alkalinity in Finnish lakes is lowered by 5.3µeq l−1 for each mg l−1of TOC, and the average acid-neutralizing capacity provided by organic anion in Gran titrations was estimated to be 1.6µeq l−1
for each mg l−1of TOC. Each mg l−1of TOC provides thus 5.3µeq l−1of strong and 1.6µeq l−1of weak organic acid anions. Catchment-to-lake ratio was selected as independent to the model, probably due to intercorrelation with
25
proportion of peatland and TOC concentrations (Kortelainen, 1993b).
HESSD
4, 3249–3283, 2007 Recovery of acidified Finnish lakes J. Vuorenmaa and M. Forsius Title Page Abstract Introduction Conclusions References Tables Figures ◭ ◮ ◭ ◮ Back CloseFull Screen / Esc
Printer-friendly Version Interactive Discussion
EGU non-recovering lakes (Table 4, Fig. 6). The declines in alkalinity and pH in the early
1990s and in 1998 are probably the result of hydrology-induced organic acid surges. Ditching had taken place in 82% of the catchments in the non-recovering lake group (39% in recovering lakes), and in most of the catchments ditching took place before 1990. Both runoff and leaching of TOC usually show short-term increase after ditching
5
and level off during the following years (e.g. Kortelainen and Saukkonen, 1998). The role of ditching on organic acid surges and alkalinity patterns was not studied here. In general, the ditching may intensify the water flow to lakes during heavy rainfalls.
While episodes of organic acid surges largely determine the short-term fluctuations in alkalinity, the pool of base cations in soil and trend in base cations are essential in
10
determining the long-term development in alkalinity. The xBC concentrations in most of the recovering lakes increased slightly, suggesting that these soils have not been subjected to strong acidification. In addition, the decline of xBC deposition levelled off during the 1990s, which may have contributed to positive xBC pattern in these lakes. A significant increase in ANCCBwas detected in 80% of the recovering lakes. In contrast,
15
concentrations of xBC in non-recovering lakes have decreased over the study period along with xSO4, and has resulted in a little change in ANCCB. A significant increase in ANCCB was found in 20% of the lakes in non-recovery group. Base cation deposition decreases towards the northern part Finland region (Vuorenmaa, 2004), but the de-crease of BC deposition becomes gentler moving from south towards the northern part
20
(Ruoho-Airola et al., 2003). It is expected that base cation concentrations decrease with sulphate, but several catchment characteristics may have caused xBC concentra-tions to not increase in the same way as in recovering lake group. The location of the areas of non-recovering lakes agreed well with the areas identified as acid-sensitive based on geochemical properties of bedrock and soil, runoff and relief (K ¨am ¨ari, 1986;
25
Lahermo et al., 1996), weathering rate from divalent cations [Ca+Mg] (Johansson and Tarvainen, 1997) and contribution of organic anions [xBC−A−] (Forsius, 1989). Fin ´er et al. (2004) have also shown that catchments with high cover of peatlands and usually with flat topography and infertile soils, have lower concentrations and export of base
HESSD
4, 3249–3283, 2007 Recovery of acidified Finnish lakes J. Vuorenmaa and M. Forsius Title Page Abstract Introduction Conclusions References Tables Figures ◭ ◮ ◭ ◮ Back CloseFull Screen / Esc
Printer-friendly Version Interactive Discussion
cations than in catchments with dominantly mineral soils.
The water retention time in non-recovering lakes was low (median<1 yr), due to lower depth and water volume (Table 1), and due to higher runoff. The mean runoff (1961–1990) in northern part of central Finland region varied between 350–400 mm yr−1whereas in southern part runoff varied between 250–300 mm yr−1 (Hyv ¨arinen et
5
al., 1995). Longer reaction time between runoff water and soil and longer water re-newal time in lakes are known to favour recovery from acidification (Baker and Bre-zonik, 1988; Nuotio et al., 1990; Schindler et al., 1996), whereas conditions of high discharge and short retention time in the catchment promote dilution of runoff water. The water chemistry in shallow scour lakes draining large, boggy watersheds can be
10
largely affected by runoff induced dilution effect (Clair, 1992). Moreover, processes of in-lake alkalinity generation in short residence time lakes are relatively less important (Baker and Brezonik, 1988).
7.3 North Finland
Despite lower S deposition in north Finland, many lakes in this region were subjected
15
to clear anthropogenic acidification during the 1980s. Recovery is evident in lakes in northern Finland (Tammi et al., 2003b; Vuorenmaa et al., 2005) and elsewhere in the Euro-Arctic Barents region due to decreased S deposition (Skjelv ˚ale et al., 2006). Geochemical properties, cold climate and precipitation amounts influence the alkalinity and base cation concentrations and trends in these lakes due to weaker weathering
20
rate of minerals and dilution by precipitation. The leaching of organic acidity is also important in such poorly buffered lakes (K ¨ahk ¨onen, 1996). Vulnerability to acidification therefore varies greatly, even among neighbouring catchments resulting in spatially mosaic-like recovery map. The non-recovering lake group was somewhat more acidic compared to recovering lakes, as indicated by lower median pH values and alkalinity
25
(Table 1, Fig. 6).
Autumn 1992 and 1998 were very wet periods also in north Finland, resulting in high autumn runoff there. High TOC concentrations and low alkalinity, pH and ANC in
HESSD
4, 3249–3283, 2007 Recovery of acidified Finnish lakes J. Vuorenmaa and M. Forsius Title Page Abstract Introduction Conclusions References Tables Figures ◭ ◮ ◭ ◮ Back CloseFull Screen / Esc
Printer-friendly Version Interactive Discussion
EGU the non-recovering lakes were therefore observed in these two years (Fig. 6). While
alkalinity tended to increase (19 out of the 20 lakes with increasing slope) in the non-recovering lake group, confounding factors such as elevated runoff and peaks in or-ganic acidity have suppressed alkalinity in most of the acid-sensitive lakes. Propor-tions of peatlands were estimated to be similar between the lake groups, but xSO4
5
concentrations and xSO4/A−
-ratios were higher in the non-recovering lake group. The estimate of peatland area is based on topographic maps, and may not give an accurate measure of the total effective amount of organic soils in the catchment. Mineral soils with lower sulphate retention ability and probably lower BC supplies may therefore be more important in the non-recovering lakes than expected on the basis of peatland
10
area estimates.
The long-term monitoring data presented here provide clear evidence that reduc-tions in sulphur emissions and deposition during the last two decades have resulted in a large-scale improvement in water quality and that chemical recovery is proceed-ing in Finnish lakes. The recovery from acidification has been strongest in lakes in
15
which sulphate has been the major acidifying agent. These lakes are located mostly in south Finland. Many catchments in Finland, particularly in central Finland, have a high proportion of peatlands and high TOC concentrations, and the influence of strong mineral acids is superimposed on organic acid contributions to acidity. Runoff-induced surges of organic acids have suppressed recovery of buffering capacity in many
acidi-20
fied humic lakes. Base cation concentrations are still declining, and this has resulted in lower ANCCBand alkalinity increase in many lakes, particularly in the central and north Finland. Climate change may increase the mineralization of soil organic matter and change the frequency and magnitude of runoff and organic acid episodes. An increase of these types of confounding effects on pH and alkalinity recovery may therefore be
25
anticipated in the future.
Acknowledgements. This study was carried out as part of the Commission of
Euro-pean Communities project EUROLIMPACS (Integrated project to evaluate impacts
HESSD
4, 3249–3283, 2007 Recovery of acidified Finnish lakes J. Vuorenmaa and M. Forsius Title Page Abstract Introduction Conclusions References Tables Figures ◭ ◮ ◭ ◮ Back CloseFull Screen / Esc
Printer-friendly Version Interactive Discussion
http://www.eurolimpacs.ucl.ac.uk). Edited by: P. Dillon and R. F. Wright
References
Baker, L. A. and Brezonik, P. L.: Dynamic model of in-lake alkalinity generation, Water Resour.
5
Res., 24, 65–74, 1988.
Brakke, D. F., Henriksen, A. and Norton, S. A.: The relative importance of acidity sources for humic lakes in Norway, Nature, 329, 432–434, 1987.
Clair, T. A.: Acid precipitation and weathering by organic acids in Labrador lake basins, Water Resour. Bull., 28, 507–515, 1992.
10
Evans Jr, A., Zelazny, L. W and Zipper, C. E.: Solution parameters influencing dissolved organic carbon levels in three forest soils, Soil Sci. Soc. Am. J., 52, 1789–1792, 1988.
Evans, C. D, Cullen, J. M, Alewell, C., Kop ´acek, J., Marchetto, A., Moldan, F., Prechtel, A., and Rogora, M.: Recovery from acidification in European surface waters, Hydrol. Earth Syst. Sci., 5, 311–325, 2001.
15
Evans, C. D, Monteith, D. T. and Cooper, D. M.: Long-term increases in surface water dissolved organic carbon: Observations, possible causes and environmental impacts, Environ. Pollut., 137, 55–71, 2005.
Fin ´er, L., Kortelainen, P., Mattsson, T., Ahtiainen, M., Kubin, E., and Sallantaus, T.: Sulphate and base cation concentrations and export in streams from unmanaged forested catchments
20
in Finland, For. Ecol. Manage., 195, 115–128, 2004.
Forsius, M.: Sensitivity distributions of Finnish lakes, in: Regional Acidification Models: Ge-ographic Extent and Time Development, edited by: J. K ¨am ¨ari, D. F. Brakke, A. Jenkins, S. A. Norton and R. F. Wright, 31–38, Springer, Berlin, 1989.
Forsius, M., Kleemola, S., Vuorenmaa, J., and Syri, S.: Fluxes and trends of nitrogen and
25
sulphur compounds at Integrated Monitoring sites in Europe, Water Air Soil Pollut., 130, 1641–1648, 2001.
Forsius, M., Vuorenmaa, J., Mannio, J., and Syri, S.: Recovery from acidification of Finnish lakes: regional patterns and relations to emission reduction policy, Sci. Total Envir., 310, 121–132, 2003.
HESSD
4, 3249–3283, 2007 Recovery of acidified Finnish lakes J. Vuorenmaa and M. Forsius Title Page Abstract Introduction Conclusions References Tables Figures ◭ ◮ ◭ ◮ Back CloseFull Screen / Esc
Printer-friendly Version Interactive Discussion
EGU
Hruska, J., K ¨ohler, S., Laudon, H., and Bishop, K.: Is a universal model of organic acidity possible: Comparison of the acid/base properties of dissolved organic carbon in the boreal and temperate zone, Environ. Sci. Technol., 37, 1726–1730, 2001.
Huttunen, P., Kentt ¨amies, K., Liehu, A., Liukkonen, M., Nuotio, T., Sandman, O., and Turkia, J.: Palaeoecological evaluation of the recent acidification of susceptible lakes in Finland,
5
in: Acidification in Finland, edited by: P. Kauppi, P. Anttila and K. Kentt ¨amies, 1071–1090, Springer, Berlin, 1990.
Hyv ¨arinen, V., Solantie, R., Aitamurto, S., and Drebs, A.: Water balance in Finnish drainage basins during 1961–1990, Publications of Water and Environment Administration, series A 220, National Board of Waters and the Environment, Helsinki, Finland, 162 pp., (in Finnish),
10
1995.
Johansson, M. and Tarvainen, T.: Estimation of weathering rates for critical load calculations in Finland, Environ. Geol., 29, 158–164, 1997.
Kleemola, S. and Forsius, M.: Trend assessment of bulk deposition, throughfall and runoff water/soil water chemistry at ICP IM sites, in: 15thannual report 2006, ICP Integrated
Mon-15
itoring, edited by: S. Kleemola and M. Forsius, 22–48, The Finnish Environment 30/2006, Finnish Environment Institute, Helsinki, Finland, 2006.
Kortelainen, P., Mannio, J., Forsius, M., K ¨am ¨ari, J., and Verta M.: Finnish lake survey: The role of organic and anthropogenic acidity, Water Air Soil Pollut., 46, 235–249, 1989.
Kortelainen, P. and Mannio, J.: Organic acidity in Finnish lakes, in: Acidification in Finland,
20
edited by: P. Kauppi, P. Anttila and K. Kentt ¨amies , 849–863, Springer, Berlin, 1990.
Kortelainen, P.: Contribution of organic acids to the acidity of Finnish lakes, PhD thesis, Publi-cations of the Water and Environment Research Institute, 13. National Board of Waters and the Environment, Helsinki, Finland, 48 pp, 1993a.
Kortelainen, P.: Content of total organic carbon in Finnish lakes and its relationship to
catch-25
ment characteristics, Can. J. Fish. Aquat. Sci., 50, 1477–1483, 1993b.
Kortelainen, P. and Saukkonen, S.: Leaching of nutrients, organic, carbon and iron from Finnish forestry land, Water Air Soil Pollut., 105, 239–250, 1998.
Krug, E. C. and Frink, C. R.: Acid rain and acid soil: A new perspective, Nature, 221, 520–525, 1983.
30
K ¨ahk ¨onen, A.-M.: Soil geochemistry in relation to water chemistry and sensitivity to acid depo-sition in Finnish Lapland, Water Air Soil Pollut., 87, 311–327, 1996.
HESSD
4, 3249–3283, 2007 Recovery of acidified Finnish lakes J. Vuorenmaa and M. Forsius Title Page Abstract Introduction Conclusions References Tables Figures ◭ ◮ ◭ ◮ Back CloseFull Screen / Esc
Printer-friendly Version Interactive Discussion 211-219, 1986.
K ¨am ¨ari, J., Forsius, M., Kortelainen, P., Mannio, J., and Verta, M., Finnish lake survey: Present status of acidification. Ambio, 20, 23–27, 1991.
Lahermo, P., V ¨a ¨an ¨anen, P., Tarvainen, T., and Salminen, R.: Geochemical Atlas of Finland, Part 3, Environmental geochemistry – stream waters and sediments, Geological Survey of
5
Finland, Espoo, 149 pp., 1996.
Lydersen, E., Larssen, T., and Fjeld, E.: The influence of total organic carbon (TOC) on the relationship between acid neutralizing capacity (ANC) and fish status in Norwegian lakes, Sci. Total Envir., 326, 63–69, 2004.
L ¨ovblad, G., Tarras ´on, l., Tørseth, K., and Dutchak, S.: EMEP Assessment, Part I: European
10
Perspective, Norwegian Meteorological Institute, Oslo, Norway, 180 pp, 2004.
Mannio, J.: Responses of headwater lakes to air pollution changes in Finland, PhD thesis, Monographs of the Boreal Environment Research, Finnish Environment Institute, Helsinki. 48 pp, 2001a.
Mannio, J.: Recovery pattern from acidification of headwater lakes in Finland, Water Air Soil
15
Pollut., 130, 1427–1432, 2001b.
Mannio, J. and Vuorenmaa, J.: Regional monitoring of lake acidification in Finland, Water Air Soil Pollut., 85, 571–576, 1995.
Mitchell, M. J., McHale, P. J., Inamdar, S., and Raynal, D. J.: Role of within-lake processes and hydrobiochemical changes over 16 years in a watershed in the Adirondack Mountains of
20
New York State, USA, Hydrol. Process., 15, 1951–1965, 2001.
Munson, R. K and Gherini, S. A.: Influence of organic acids on the pH and acid-neutralizing capacity of Adirondack lakes, Water Resour. Res., 29, 891–899, 1993.
Neal, C., Reynolds, B., and Robson, A. J.: Acid neutralization capacity measurements within natural waters: towards a standardized approach, Sci. Total Envir., 243/244, 233–241, 1999.
25
Nuotio, T., Hyypp ¨a, J., and Nylander, J.: Buffering capacity of Finnish soils and its dependence on geological factors in relation to acidification sensitivity of lakes, in: Acidification in Finland, edited by: P. Kauppi, P. Anttila and K. Kentt ¨amies , 271–286, Springer, Berlin, 1990.
Press, S. J. and Wilson, S.: Choosing between logistic regression and discriminant analysis, J. Am. Stat. Assoc., 73, 699–705, 1978.
30
Ruoho-Airola, T., Alaviippola, B., Salminen, K., and Varjoranta, R.: An investigation of base cation deposition in Finland, Boreal Envir. Res., 8, 83–95, 2003.
HESSD
4, 3249–3283, 2007 Recovery of acidified Finnish lakes J. Vuorenmaa and M. Forsius Title Page Abstract Introduction Conclusions References Tables Figures ◭ ◮ ◭ ◮ Back CloseFull Screen / Esc
Printer-friendly Version Interactive Discussion
EGU
and exposure in relation to air transport sector, J. Environ. Monit., 6, 1–11, TSEK, 2004. SAS Institute Inc.: SAS/STAT User’s Guide, Version 6, Fourth Edition, Vol. 2. Cary, north
Car-olina, U.S.A, 846 pp., 1989.
Schiff, S., Aravena. R., Mewhinney, E., Elgood, R., Warner, B., Dillon, P., and Trumbore, S.: Pre-cambrian shield wetlands: hydrologic control of the sources and export of dissolved organic
5
matter, Climatic Change, 40, 167–188, 1998.
Schindler, D. W., Bayley, S. E., Parker, B. R., Beaty, K. G., Cruikshank, D. R., Everett, J. E., Schindler, E. U., and Stainton, M. P.: The effects of climatic warming on the properties of boreal lakes and streams at the Experimental Lakes Area, northwestern Ontario. Limnol. Oceanogr., 41, 1004–1017, 1996.
10
Sen, P. K.: Estimates of the regression coefficient based on Kendall’s tau, Am. Statist. Assoc. J., 63, 1379–1389, 1968.
Skjelkv ˚ale, B. L., Mannio, J., Wilander, A. and Andersen, T.: Recovery from acidification of lakes in Finland, Norway and Sweden 1990–99, Hydrol. Earth Syst. Sci., 5, 327–337, 2001a. Skjelkv ˚ale, B. L., Olendrzynski, K., Stoddard, J. L., Tarrason, L., Traaen, T. S., Tørseth, K.,
15
Windjusveen, S., and Wright, R. F.: Assessment of trends and leaching of nitrogen at ICP Waters sites (Europe and north America), SNO 4383/2001, ICP Waters Report 54/2001, Norwegian Institute for Water Research, Oslo, Norway, 45 pp, 2001b.
Skjelkv ˚ale, B. L., Stoddard, J. L., Jeffries, D. S., Tørseth, K., Høg ˚asen, T., Bowman, J., Mannio, J., Monteith, D. T., Mosello, R., Rogora, M., Rzychon, D., Vesel´y, J., Wieting, J.,
Wilan-20
der, A., and Worsztynowicz, A.: Regional scale evidence for improvements in surface water chemistry 1990–2001, Environ. Pollut., 137, 165–176, 2005.
Skjelkv ˚ale, B. L., Aherne, J., Bergman, T., Bishop, K., Forsius, M., Forsstr ¨om, L., Gashkina, N. A., Hettelingh, J.-P., Jeffries, D., Kaste, Ø., Korhola, A., Lappalainen, A., Laudon, H., Mannio, J., Moiseenko, T., Nyman, M., Posch, M., Schartau, A. K., Stoddard, J., Tammi,
25
J., Vuorenmaa, J., Wilander, A., and Yakovlev, V.: Chapter 6.1. Evidence from water quality monitoring, in: AMAP Assessment 2006: Acidifying Pollutants, Arctic Haze, and Acidifica-tion in the Arctic, pp. 64–74, Arctic Monitoring and Assessment Programme (AMAP), Oslo, Norway., 2006.
Stoddard, J. L., Jeffries, D. S., L ¨ukewille, A., Clair, T. A., Dillon, P. J., Driscoll, C. T., Forsius, M.,
30
Johannessen, M., Kahl, J. S., Kellogg, J. H., Kemp, A., Mannio, J., Monteith, D. T., Murdoch, P. S., Patrick, S., Rebsdorf, A., Skjelkv ˚ale, B. L., Stainton, M. P., Traaen, T. S., van Dam, H., Webster, K. E., Wieting, J., and Wilander, A.: Regional trends in aquatic recovery from
HESSD
4, 3249–3283, 2007 Recovery of acidified Finnish lakes J. Vuorenmaa and M. Forsius Title Page Abstract Introduction Conclusions References Tables Figures ◭ ◮ ◭ ◮ Back CloseFull Screen / Esc
Printer-friendly Version Interactive Discussion acidification in north America and Europe 1980–95. Nature, 401, 575–578, 1999.
Stoddard, J. L., Karl, J. S., Deviney, F. A., DeWalle, D. R., Driscoll, C. T., Herlihy, A. T., Kellogg, J. H., Murdoch, P. S., Webb, J. R., and Webster, K. E.:Response of Surface Water Chem-istry to the Clean Air Act Amendments of 1990, Report EPA 620/R-03/001, United States Environmental Protection Agency, north Carolina, 78 pp, 2003.
5
Tabachnick, B. G. and Fidell, L. S.: Using multivariate statistics (3rd ed.), Harper Collins College Publishers: New York, 880 pp., 1996.
Tammi, J., Appelberg, M., Beier, U., Hesthagen, T., Lappalainen, A., and Rask, M.: Fish status of Nordic lakes: effects of acidification, eutrophication and stocking activity on present fish species composition. Ambio, 32, 98–105, 2003a.
10
Tammi, J., Lappalainen, A., and Bergman, T.: Water quality and fish populations of acid sen-sitive waters in the V ¨ats ¨ari area, northeastern Finland: responses to reduced sulphur emis-sions from the Kola Peninsula, Russia, in the 1990s, Boreal Environ. Res., 8, 1–7, 2003b. Tipping, E. and Hurley, M. A.: A model of solid-solution interactions in acid organic soils, based
on the complexation properties of humic substances, J. Soil Sci., 39, 505–519, 1988.
15
Ukonmaanaho, L., Starr, M., and Ruoho-Airola, T.: Trends in sulfate, base cations and H+ concentrations in bulk precipitation and throughfall at Integrated Monitoring sites in Finland 1989–1995, Water Air Soil Pollut., 105, 353–363, 1998.
Ukonmaanaho, L. and Starr, M.: Major nutrients and acidity: budgets and trends at four remote boreal stands in Finland during the 1990s, Sci. Total. Envir., 297, 21–41, 2002.
20
Vance, G. F. and David, M. B.: Effect of acid treatment on the leachate chemistry of a New England spodosol: importance of the B horizon on dissolved organic carbon retention, Soil Sci. Soc. Am. J., 53, 1242–1247, 1989.
Vuorenmaa, J.:Long-term changes of acidifying deposition in Finland (1973–2000), Environ. Pollut., 128, 351–362, 2004.
25
Vuorenmaa, J., Mannio, J., Eloranta, P., Forsius, M., Hynynen, J., Meril ¨ainen, J., Rask, M., and Tammi, J.: Recovery from acidification – biological responses to chemical recovery in acidified lakes in Finland, in: H. de Witt and B.L. Skjelkv ˚ale, 31–36, Proceedings of the 20th meeting of the ICP Waters Programme Task Force in Falun, Sweden, October 18–20, 2004. ICP Waters Report 80/2005, Norwegian Institute for Water Research, Oslo, Norway, 2005.
30
Vuorenmaa, J., Forsius, M., and Mannio, J.: Increasing trends of total organic carbon concen-trations in small forest lakes in Finland from 1987 to 2003, Sci. Total. Envir., 365, 47–6., 2006.
HESSD
4, 3249–3283, 2007 Recovery of acidified Finnish lakes J. Vuorenmaa and M. Forsius Title Page Abstract Introduction Conclusions References Tables Figures ◭ ◮ ◭ ◮ Back CloseFull Screen / Esc
Printer-friendly Version Interactive Discussion
EGU
Table 1. Percentiles (25, 50 and 75%) for catchment characteristics and for trend slopes and
concentrations in the recovering and non-recovering lakes.
Variable Unit south Finland (n=61) central Finland (n=57) north Finland (n=39) Recovering (n=56) Non-recovering (n=5) Recovering (n=23) Non-recovering (n=34) Recovering (n=19) Non-recovering (n=20) 25% 50% 75% 25% 50% 75% 25% 50% 75% 25% 50% 75% 25% 50% 75% 25% 50% 75% Lake ha 7 16 36 2 4 29 5 10 43 4 7 15 4 9 24 3 10 27 Catchment ha 54 92 306 28 62 175 53 111 256 58 113 254 76 115 183 47 112 284 Catchm./Lake 4.6 6.4 8.4 12.5 15.5 16.3 4.3 7.5 13 6.5 13.9 22 6.0 11.3 17 7.2 10.4 18.2 Exp. bedrock % 0.5 5 16 10 29 30 0 0 1 0 0 0 0 0 1 0 0 0 Peatland % 4 8 12 4 7 15 4 14 25 23 32 42 8 21 50 3 22 35 Retention time year 1 3 4 0.2 0.9 1.2 0.6 1.6 3.5 0.3 0.8 1.1 0.1 0.2 0.7 0.1 0.3 0.7 max depth m 4.3 8.8 13.7 2.5 6.0 12 5.4 8.5 10.1 3.4 5.6 8.6 2.0 2.0 3.0 2 2 4 pH pHunit yr−1 0.004 0.020 0.033 0.000 0.005 0.017 0.000 0.020 0.047 0.000 0.000 0.017 0.000 0.000 0.015 0.000 0.000 0.013 H+ µeq l−1yr−1 −0.20 −0.05 −0.01 −0.19 −0.02 0.00 −0.14 −0.05 0.00 −0.13 −0.02 0.00 −0.03 −0.02 −0.003 −0.14 −0.004 0.000 Alkalinity µeq l−1yr−1 1.50 1.95 2.91 1.28 1.50 1.55 1.18 2.00 3.14 −0.33 0.50 1.00 1.12 1.38 1.72 0.62 0.80 0.97 xBC µeq l−1yr−1 −1.96 −0.91 −0.39 −2.58 −1.01 −0.97 −1.11 0.14 1.50 −1.57 −1.04 −0.46 −1.30 −0.72 0.00 −1.64 −1.01 −0.37 xSO4 µeq l−1yr−1 −5.56 −4.14 −2.79 −4.52 −3.91 −3.68 −2.61 −2.00 −1.44 −2.16 −1.76 −1.53 −1.68 −1.44 −0.90 −1.97 −1.38 −0.80 ANC µeq l−1yr−1 1.73 2.62 4.09 1.48 1.50 2.41 1.10 2.32 4.00 0.15 0.73 1.40 0.52 0.90 1.33 0.00 0.49 0.82 ANCOAA µeq l−1yr−1 1.77 2.53 3.70 1.48 1.95 2.29 1.13 2.21 3.88 0.29 0.70 1.55 0.36 0.66 1.15 0.01 0.42 1.02 A− µeq l−1yr−1 0.20 0.51 1.16 −0.44 −0.36 1.50 −0.47 0.36 0.59 −1.04 −0.39 0.35 −0.75 0.35 0.94 −0.56 −0.12 0.34 TOC mg l−1yr−1 0.01 0.04 0.10 −0.08 0.01 0.11 −0.05 0.02 0.08 −0.15 −0.03 0.04 −0.09 0.03 0.11 −0.07 −0.01 0.04 pH 5.5 5.9 6.2 5.3 5.6 5.8 5.7 5.9 6.4 5.1 5.5 6.1 5.8 6.0 6.3 5.1 5.8 6.4 Alkalinity µeq l−1 8 27 54 14 21 21 21 36 58 −2 18 49 8 21 32 −3 5 35 xBC µeq l−1 125 170 223 138 161 168 78 167 203 101 126 176 50 64 91 35 58 97 xSO4 µeq l−1 85 106 134 74 79 99 42 61 79 32 39 49 16 19 34 21 32 38 ANC µeq l−1 32 62 97 67 78 82 32 105 138 52 87 121 31 49 67 7 30 66 ANCOAA µeq l−1 13 43 71 28 31 34 22 61 100 19 40 86 8 26 43 −8 8 41 A− µeq l−1 29 40 69 83 105 117 24 55 95 58 90 128 31 44 67 20 35 53 TOC mg l−1 3.9 5.3 8.8 11 14.5 15 3.1 7.3 12.2 8.0 12.6 16.2 4.1 5.5 8.1 2.8 4.8 7.7 NO3-N µeq l−1 0.43 0.77 1.38 0.54 0.57 1.44 0.36 0.50 0.86 0.43 0.71 1.00 0.36 0.36 0.36 0.36 0.36 0.81 Al lab µg l−1 < 10 10 40 24 25 32 < 10 10 20 < 10 10 20 < 10 < 10 < 10 < 10 10 11 xSO4/ A − 1.46 2.38 3.91 0.58 0.61 1.21 0.44 0.97 2.28 0.34 0.45 0.86 0.33 0.43 0.64 0.36 0.82 1.94 A− / xBC 0.19 0.27 0.39 0.50 0.53 0.72 0.21 0.37 0.56 0.50 0.75 0.88 0.51 0.75 0.88 0.38 0.69 0.95 xSO4/ xBC 0.53 0.63 0.76 0.46 0.47 0.60 0.28 0.37 0.55 0.24 0.34 0.41 0.21 0.30 0.45 0.27 0.48 0.79 (xBC)-(A− ) µeq l−1 86 113 163 43 87 97 59 71 104 9 26 73 10 22 41 2 19 48
HESSD
4, 3249–3283, 2007 Recovery of acidified Finnish lakes J. Vuorenmaa and M. Forsius Title Page Abstract Introduction Conclusions References Tables Figures ◭ ◮ ◭ ◮ Back CloseFull Screen / Esc
Printer-friendly Version Interactive Discussion
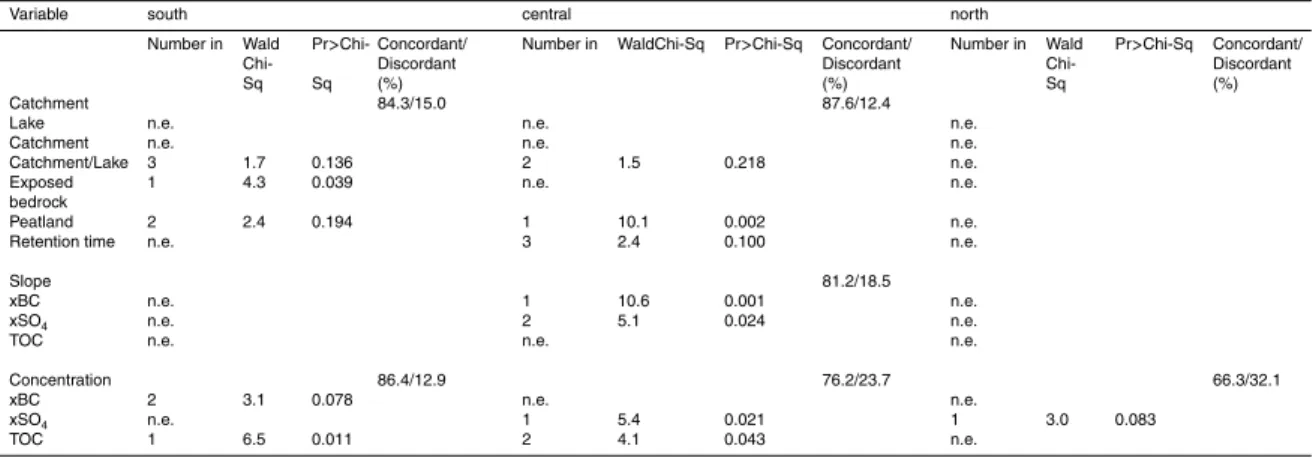
Table 2.Results of logistic regression for catchment characteristics, concentrations and trend
slopes. Ordinal number of variable for entry into the model (Number in), Wald Chi-Square test score (Wald Chi-Sq) and accociatedp-value (Pr<Chi-Sq) and percents of concordant and
discordant pairs are shown on the model results (n.e.=no entry into the model)
Variable south central north
Number in Wald Chi-Sq Pr >Chi-Sq Concordant/ Discordant (%)
Number in WaldChi-Sq Pr>Chi-Sq Concordant/ Discordant (%) Number in Wald Chi-Sq Pr>Chi-Sq Concordant/ Discordant (%) Catchment 84.3/15.0 87.6/12.4
Lake n.e. n.e. n.e.
Catchment n.e. n.e. n.e.
Catchment/Lake 3 1.7 0.136 2 1.5 0.218 n.e.
Exposed bedrock
1 4.3 0.039 n.e. n.e.
Peatland 2 2.4 0.194 1 10.1 0.002 n.e.
Retention time n.e. 3 2.4 0.100 n.e.
Slope 81.2/18.5
xBC n.e. 1 10.6 0.001 n.e.
xSO4 n.e. 2 5.1 0.024 n.e.
TOC n.e. n.e. n.e.
Concentration 86.4/12.9 76.2/23.7 66.3/32.1
xBC 2 3.1 0.078 n.e. n.e.
xSO4 n.e. 1 5.4 0.021 1 3.0 0.083