HAL Id: hal-00299000
https://hal.archives-ouvertes.fr/hal-00299000
Submitted on 1 Jan 2001
HAL is a multi-disciplinary open access
archive for the deposit and dissemination of
sci-entific research documents, whether they are
pub-lished or not. The documents may come from
teaching and research institutions in France or
abroad, or from public or private research centers.
L’archive ouverte pluridisciplinaire HAL, est
destinée au dépôt et à la diffusion de documents
scientifiques de niveau recherche, publiés ou non,
émanant des établissements d’enseignement et de
recherche français ou étrangers, des laboratoires
publics ou privés.
Ionospheric phenomena before strong earthquakes
A. S. Silina, E. V. Liperovskaya, V. A. Liperovsky, C.-V. Meister
To cite this version:
A. S. Silina, E. V. Liperovskaya, V. A. Liperovsky, C.-V. Meister. Ionospheric phenomena before
strong earthquakes. Natural Hazards and Earth System Science, Copernicus Publications on behalf
of the European Geosciences Union, 2001, 1 (3), pp.113-118. �hal-00299000�
c
European Geophysical Society 2001
Natural Hazards
and Earth
System Sciences
Ionospheric phenomena before strong earthquakes
A. S. Silina1, E. V. Liperovskaya1, V. A. Liperovsky1, and C.-V. Meister2 1Institute for Physics of the Earth, Moscow, Russia
2Project Space Plasma Physics, Potsdam, Germany
Received: 7 June 2001 – Revised: 28 September 2001 – Accepted: 5 November 2001
Abstract. A statistical analysis of several ionospheric pa-rameters before earthquakes with magnitude M ≥ 5.5 lo-cated less than 500 km from an ionospheric vertical sounding station is performed. Ionospheric effects preceding “deep” (depth h > 33 km) and “crust” (h ≤ 33 km) earthquakes were analysed separately. Data of nighttime measurements of the critical frequencies f oF2 and f oEs, the frequency
f bEs and Es-spread at the middle latitude station Dushanbe were used. The frequencies f oF2 and f bEs are propor-tional to the square root of the ionization density at heights of 300 km and 100 km, respectively. It is shown that two days before the earthquakes the values of f oF2 averaged over the morning hours (00:00 LT–06:00 LT) and of f bEs averaged over the nighttime hours (18:00 LT–06:00 LT) de-crease; the effect is stronger for the “deep” earthquakes. Analysing the coefficient of semitransparency which char-acterizes the degree of small-scale turbulence, it was shown that this value increases 1–4 days before “crust” earthquakes, and it does not change before “deep” earthquakes. Study-ing Es-spread which manifests itself as diffuse Es track on ionograms and characterizes the degree of large-scale turbu-lence, it was found that the number of Es-spread observations increases 1–3 days before the earthquakes; for “deep” earth-quakes the effect is more intensive. Thus it may be concluded that different mechanisms of energy transfer from the region of earthquake preparation to the ionosphere occur for “deep” and “crust” events.
1 Introduction
The interest in electromagnetic and ionospheric phenomena caused by processes in the lithosphere which are related to earthquake preparation increased during the last ten years. General results of recent works on the subject were presented at conferences in Japan (Hayakawa and Fujinawa, 1994; Ha-yakawa, 1999), and in monographs and reviews (Gokhberg
Correspondence to: C.-V. Meister ([email protected])
et al., 1995; Liperovsky et al., 1992, 2000a). As the num-ber of earthquakes with magnitude M ≥ 4.5 is rather large, for these events usually a statistical analysis of the phenom-ena preceding them was performed. But precursor effects of stronger earthquakes with M ≥ 6.0 were analysed sep-arately, as these earthquakes are rare and a statistical anal-ysis is quite impossible (Pulinets, 1998; Hayakawa, 1999; Ondo, 2000). It should be pointed out that in studies of iono-spheric precursors of earthquakes usually the dependence of seismoionospheric effects on the distance from the hypocen-ter to the vertical sounding station was considered. A de-pendence on the depth of the epicenter was not examined. Ionospheric effects were revealed not more than 1–5 days be-fore the earthquakes, and usually 2–3 days bebe-fore the earth-quakes with magnitudes M ≤ 5.5, post seismic influences exist about 1–2 days after the earthquakes (Hayakawa and Fujinawa, 1994; Gokhberg et al., 1995; Liperovsky et al., 1992, 2000a; Hayakawa, 1999).
In the present paper, an attempt of a statistical analysis of ionospheric effects 6 days before and 2 days after the earth-quakes with M ≥ 5.5 is presented. The analysis of the tem-poral dependence of the parameters of the ionosphere was performed separately for so-called “deep” (h > 33 km) and “crust” (h ≤ 33 km) earthquakes (h designates the depth of the seismic center below the Earth’s surface). One has to underline that the number of such earthquakes close to the chosen vertical sounding station during the time of the con-tinuous operation of the station is not large enough to obtain a good statistical confirmation of the obtained results, but it nevertheless allows one to reveal a few common features and tendencies of seismoionospheric phenomena. In the pa-per earthquakes with magnitude M ≥ 5.5, which occurred at distances less than 500 km from the vertical sounding station, were considered.
Data of the Dushanbe vertical sounding station (coordi-nates ϕ = 38.5◦N, λ = 68.8◦E) for the time interval from 1985 until 1990 were used. Only nighttime values (to avoid influences of the solar radiation) of the ionospheric param-eters f oF2, f oEs, f bEs, and Es-spread (Es-spread means
114 A. S. Silina et al.: Ionospheric phenomena before strong earthquakes a diffusive track of an Es-layer on an ionogram) were
se-lected for the analysis. The nighttime was considered to be the time from 18:00 LT till 06:00 LT. Vertical sounding was performed in intervals of fifteen minutes. The time depen-dence of ionospheric parameters for every earthquake was studied during eight nights, six nights before the event and two nights after the event.
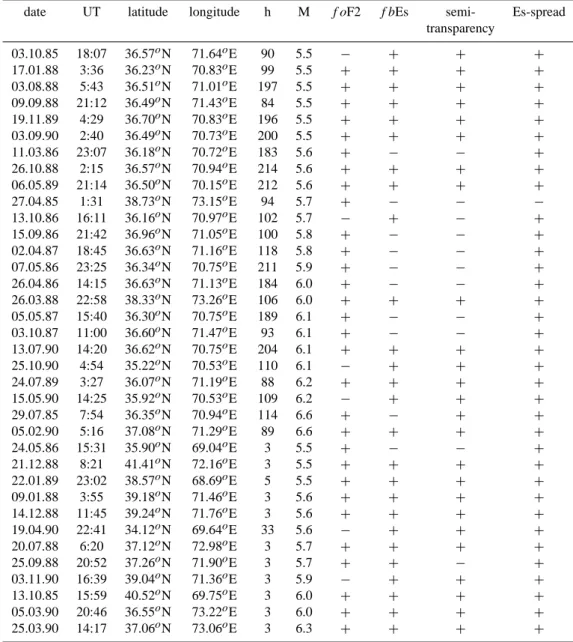
If the earthquake took place in the night after 24:00 LT, the night was considered to be a “−1” night. If the earth-quake happened at night before 24:00 LT, the night was des-ignated by (+1). In cases when the preseismic periods of two different earthquakes coincided partially, only the first earthquake was used in the analysis. Thirty-six earthquakes with M ≥ 5.5 were complied with the requirements of the performed analysis. With much regret the authors have to point out that data for all four listed ionospheric parame-ters were not available for each earthquake. Thus when in-vestigating different ionospheric effects the authors had to consider different numbers of earthquakes. The columns in Table 1 contain the parameters of the analysed earthquakes, date and time coordinates (latitude and longitude), the depth of the epicenter h and the magnitude M. The seismological online catalogue of Obninsk was used. The availability of the plasmaparameters is displayed by the sign “+” in the table.
To reveal seismoionospheric effects the data for every earthquake were divided into four groups: (−6, −5), (−4,
−3), (−2, −1) and (+1, +2) nights, correspondingly. Aver-aging inside each group was made for each earthquake (i.e. the mean value of the parameter in question was found for the (−6, −5) night and so on) for the parameters f oF2, f bEs, and the coefficient of semi-transparency 1f bEs = (f oEs–
f bEs) /f bEs. The results were normalized by the mean value of all four groups. So the modification of dimension-less parameters was analysed for each earthquake. Further-more, the superimposed epoch method was used to obtain general dependencies separately for deep (h > 33 km) and crust (h ≤ 33 km) earthquakes. After this procedure, the precision of the mean value was defined by the standard de-viation from the mean value.
2 The morning decrease of f oF2
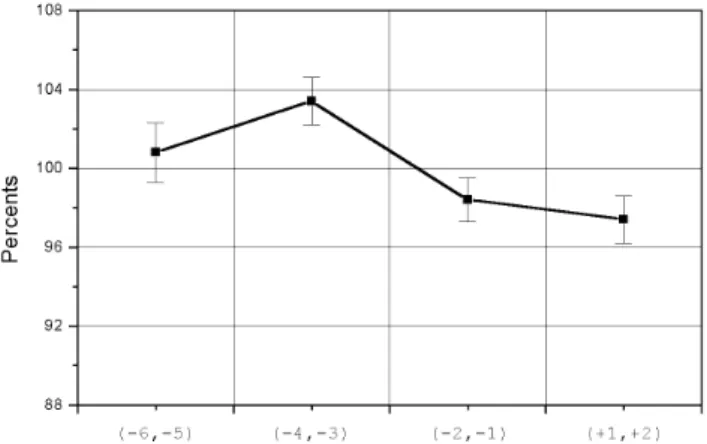
The f oF2 frequency is one of the most important iono-spheric parameters, often analysed in seismoionoiono-spheric studies. It can be measured either by satellites or by verti-cal sounding stations, and all sounding stations in the world present the hourly f oF2-values. The decrease of f oF2 in the morning hours 1–5 days before strong earthquakes was already discussed by Pulinets (1998). In the present paper, the time dependence of f oF2 is analysed separately for deep and crust earthquakes. The f oF2-parameter is averaged over the morning hours (00:00–06:00 LT). It should be mentioned that the number of deep earthquakes is 20, and the number of crust earthquakes is 10 in this analysis. Figure 1 shows the results which were found using the superimposed epoch method for four groups of nights. From the figure follows
Fig. 1. Time dependence of the critical frequency f oF2 averaged
over the morning hours (00:00 LT–06:00 LT). The results were ob-tained using the superimposed epoch method for 30 earthquakes (20 deep and 10 crust events) with magnitude M = 5.5 and R <500 km. The results are visualized for four groups of nights, the so-called (−6, −5), (−4, −3), (−2, −1), (+1, +2) nights. The presented frequency values are normalized by the mean value over the four groups.
that there exists a tendency for the morning f oF2-values to decrease from the (−4, −3) nights to the (−2, −1) nights. Variations are not significant for other groups. Thus the char-acteristic time of decrease is around 2 days. An analysis performed separately for deep and crust earthquakes demon-strated the same tendency, but due to the smaller numbers of earthquakes, the results are less significant. Qualitatively, the effect is stronger for deep earthquakes.
3 The decrease of the average nighttime values of f bEs It was proven (Liperovsky et al., 2000b) that the f bEs pa-rameter averaged over the night hours decreases one day be-fore an earthquake. The effect takes place for earthquakes with M ≥ 5 at distances R < 500 km from the epicenters. Now it is proposed that the preparation time for earthquakes with M ≥ 5.5 is yet larger than 1–2 nights, and so the char-acteristic time scale of the decrease of the parameter f bEs may be different.
In the present analysis, data were available for 26 earth-quakes. In the cases with an absence of an Es-layer trace on the ionogram, the f bEs-value is assumed to be equal to the sensitivity threshold of the ionospheric station. As in the previous case, averaged values were obtained for the four groups of nights, then the values were normalized and the superimposed epoch method was used. The results are pre-sented in Fig. 2. A tendency for the decrease of the nighttime
f bEs from the (−4, −3) nights to the (−2, −1) nights ex-ists; variations are not significant for other groups. Analyses performed separately for 15 deep and 11 crust earthquakes demonstrated the same tendency in both cases. Qualitatively, the effect is stronger for deep earthquakes.
Table 1. Parameters of earthquakes used for the analysis in the present paper
date UT latitude longitude h M f oF2 f bEs semi- Es-spread transparency 03.10.85 18:07 36.57oN 71.64oE 90 5.5 − + + + 17.01.88 3:36 36.23oN 70.83oE 99 5.5 + + + + 03.08.88 5:43 36.51oN 71.01oE 197 5.5 + + + + 09.09.88 21:12 36.49oN 71.43oE 84 5.5 + + + + 19.11.89 4:29 36.70oN 70.83oE 196 5.5 + + + + 03.09.90 2:40 36.49oN 70.73oE 200 5.5 + + + + 11.03.86 23:07 36.18oN 70.72oE 183 5.6 + − − + 26.10.88 2:15 36.57oN 70.94oE 214 5.6 + + + + 06.05.89 21:14 36.50oN 70.15oE 212 5.6 + + + + 27.04.85 1:31 38.73oN 73.15oE 94 5.7 + − − − 13.10.86 16:11 36.16oN 70.97oE 102 5.7 − + − + 15.09.86 21:42 36.96oN 71.05oE 100 5.8 + − − + 02.04.87 18:45 36.63oN 71.16oE 118 5.8 + − − + 07.05.86 23:25 36.34oN 70.75oE 211 5.9 + − − + 26.04.86 14:15 36.63oN 71.13oE 184 6.0 + − − + 26.03.88 22:58 38.33oN 73.26oE 106 6.0 + + + + 05.05.87 15:40 36.30oN 70.75oE 189 6.1 + − − + 03.10.87 11:00 36.60oN 71.47oE 93 6.1 + − − + 13.07.90 14:20 36.62oN 70.75oE 204 6.1 + + + + 25.10.90 4:54 35.22oN 70.53oE 110 6.1 − + + + 24.07.89 3:27 36.07oN 71.19oE 88 6.2 + + + + 15.05.90 14:25 35.92oN 70.53oE 109 6.2 − + + + 29.07.85 7:54 36.35oN 70.94oE 114 6.6 + − + + 05.02.90 5:16 37.08oN 71.29oE 89 6.6 + + + + 24.05.86 15:31 35.90oN 69.04oE 3 5.5 + − − + 21.12.88 8:21 41.41oN 72.16oE 3 5.5 + + + + 22.01.89 23:02 38.57oN 68.69oE 5 5.5 + + + + 09.01.88 3:55 39.18oN 71.46oE 3 5.6 + + + + 14.12.88 11:45 39.24oN 71.76oE 3 5.6 + + + + 19.04.90 22:41 34.12oN 69.64oE 33 5.6 − + + + 20.07.88 6:20 37.12oN 72.98oE 3 5.7 + + + + 25.09.88 20:52 37.26oN 71.90oE 3 5.7 + + − + 03.11.90 16:39 39.04oN 71.36oE 3 5.9 − + + + 13.10.85 15:59 40.52oN 69.75oE 3 6.0 + + + + 05.03.90 20:46 36.55oN 73.22oE 3 6.0 + + + + 25.03.90 14:17 37.06oN 73.06oE 3 6.3 + + + +
4 Modification of f bEs semi-transparency coefficient It is of great importance to find out if there exists a phe-nomenon which is only peculiar for crust earthquakes. These earthquakes are the most destructive ones and the problem of their prognosis has to be solved first. The authors pro-posed that the semi-transparency coefficient 1f bEs=(f oEs–
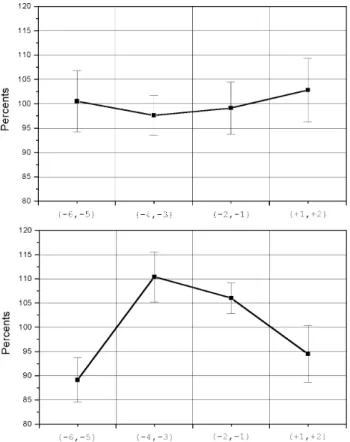
f bEs)/f bEs, which is very variable by itself, is sensitive to crust earthquake preparation processes. This coefficient characterizes the degree of turbulence of the E-region. It was supposed (Gorbunova and Shved, 1984; Takefu, 1989) that the reason for the existence of large 1f bEs values is the radio wave scattering on small-scale (tens of meters) ir-regularities of the electron density. In Fig. 3, the results of the semi-transparency coefficient analysis are presented sep-arately for 15 deep and 10 crust earthquakes. The value of the semi-transparency coefficient increases in the (−4, −3),
(−2, −1) nights in the case of crust earthquakes. For deep earthquakes 1f bEs slightly varies within the error bounds.
5 Spread-Es increase
The Es-spread effect in the mid-latitude ionosphere has been studied by Bowman (1985) and Liperovskaya et al. (2000). The Es-spread effect consists of the diffusivity of the Es-layer traces on the ionograms, and it apparently reflects the pro-cesses of large-scale (few hundred meters) instabilities in the sporadic layers. The Es-spread is a rather rare phenomenon and it is extremely seldom detected by ionospheric stations. Es-spread is closely related to the solar activity and rarely observed in years of solar maximum (Bowman, 1985; Liper-ovskaya et al., 2000). Usually, Es-spread is observed at low values of the critical frequency f bEs (1–2 MHz); it has a
sea-116 A. S. Silina et al.: Ionospheric phenomena before strong earthquakes
Fig. 2. Time dependence of the mean nighttime (18:00 LT– 06:00 LT) f bEs frequency. The results were observed by the su-perimposed epoch method for 26 earthquakes (15 deep and 11 crust ones) with magnitude M = 5.5 and R < 500 km. The f bEs frequency is visualized for four groups of nights, the so-called (−6, −5), (−4, −3), (−2, −1), (+1, +2) nights, and normalized by the mean value over the four groups.
sonal dependence and it occurs more often in winter than in summer. The characteristic time of Es-spread existence is of the order of a few minutes (Liperovsky et al., 2000b).
All these facts allow one to assume that Es-spread is pre-dominantly connected with sporadic layer turbulence, which is caused by neutral gas turbulization excited by atmospheric waves with periods of several minutes propagating from the Earth’s surface or/and from the lower atmosphere to the iono-sphere. Danilov et al. (1987) assumed that the Es-spread could be associated with meteorological effects in the atmo-sphere. Further, in the paper by Alimov et al. (1989), it was discussed that the disturbances propagating from the Earth’s surface to the ionosphere during earthquake preparation can reach the ionosphere and, as a result, increase the probabil-ity of the spread appearance. It was expected that Es-spread may become a prognostic indicator of earthquakes. Based on a six-year data sample, Liperovskaya et al. (2000) published a statistical analysis which demonstrated that in case of earthquakes with magnitude M > 4.5 at a distance
R < 500 km from the vertical sounding (VS) stations, the probability of Es-spread observations is independent of the earthquake preparation processes occurring 1–3 days before a shock. A number of earthquakes, however, was accompa-nied by a distinct increase of Es-spread. So it is interesting to analyse the effect separately for stronger (M ≥ 5.5) earth-quakes and shorter distances to the VS stations.
There are no distinct links between Es-spread and the mo-ment of the earthquake; only five earthquakes (from a total of twenty-one events occurring at nighttime) were accompanied by Es-spread for a few hours before the shock.
Analysing each earthquake, the total number of Es-spread observations was obtained for the (−6, −5, −4) nights and the (−3, −2, −1) nights before each event. Thus for each earthquake it was determined whether the Es-spread obser-vations in the (−3, −2, −1) nights increased or decreased in
Fig. 3. Time dependence of the mean night-time (18:00 LT–06:00
LT) coefficient of semi-transparency 1f bEs=(f oEs–f bEs)/f bEs. The results were obtained by the superimposed epoch method for
(a) 15 deep and (b) 10 crust earthquakes with magnitude M = 5.5
and R < 500 km. The coefficient of semi-transparency is visual-ized for four groups of nights, the so-called (−6, −5), (−4, −3), (−2, −1), (+1, +2) nights, and normalized by the mean value over four groups.
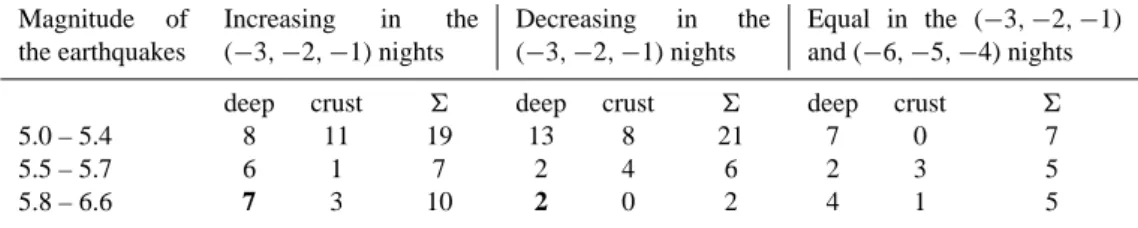
comparison with the (−6, −5, −4) nights. For the next step this comparison was provided separately for deep and crust earthquakes for three magnitude intervals (Table 2). It was found that for earthquakes with magnitudes M ≥ 5.8, Es-spread appeares more often during the (−3, −2, −1) nights. For 17 earthquakes which were used in the analysis, an in-crease occurred in 10 cases, in two cases a dein-crease was ob-tained, and in five cases no variations could be found.
In a more accurate Es-spread effect analysis the earth-quakes with magnitudes 5.0 ≤ M ≤ 5.4 and 5.5 ≤ M ≤ 5.7 were also considered. The results allow one to draw the con-clusion that an increase in Es-spread takes place only for strong earthquakes.
The analysis also shows the following tendency: for the most deep (h > 33 km) earthquakes with 5.5 ≤ M ≤ 6.6 the number of Es-spread phenomena increases from the (−6, −5, −4) nights to the (−3, −2, −1) nights (they in-crease in 13 cases, dein-crease in 4 cases, and no effect occurred in 6 cases).
One may suppose that this tendency is connected with the differences between the absorption of wideband
earth-Table 2. Es-spread effect Magnitude of the earthquakes Increasing in the (−3, −2, −1) nights Decreasing in the (−3, −2, −1) nights Equal in the (−3, −2, −1) and (−6, −5, −4) nights deep crust 6 deep crust 6 deep crust 6
5.0 – 5.4 8 11 19 13 8 21 7 0 7
5.5 – 5.7 6 1 7 2 4 6 2 3 5
5.8 – 6.6 7 3 10 2 0 2 4 1 5
quake preparation acoustic emissions from deep and crust eartquakes. It is quite possible that all the “short-wave” parts of the deep earthquake emission spectra dissipates on the way to the Earth’s surface, and thus only “long-period” waves (T ∼ 10 − 100 s) appear in the ionosphere and generate ef-fects of the same characteristic time in the Es-layer. On the other hand, the semi-transparency coefficient 1f bEs varies due to the “short-wave” acoustic noise (T ≤ 1 s).
In the monographs (Hayakawa and Fujinawa, 1994; Haya-kawa, 1999) and the review (Liperovsky et al., 2000a), many hypotheses on mechanisms of seismoionospheric coupling are presented. All hypotheses could be conditionally divided into two groups – the “acoustic” and the “electromagnetic”. In acoustic models it is supposed that acoustic disturbances caused by lithospheric processes appear in the near-surface neutral atmosphere. The acoustic and acoustic-gravity waves further penetrate up to ionospheric altitudes and, due to col-lisional processes, cause disturbances in the plasma of the ionosphere. In a number of “electromagnetic” models it is supposed that currents, spots of electrical charges and elec-tromagnetic noise radiation arise on the Earth’s surface due to processes of earthquake preparation. The parameters of the ionosphere are further modified under the influence of an electromagnetic field of lithospheric origin. A quantitative theory of a possible lithosphere-ionosphere coupling has not been developed up to now. The dependence on the depth of the epicenters of the earthquakes is not taken into account in any hypothesis, so up to now, none of the available hypothe-ses could satisfactorily interpret the obtained results.
6 Conclusions
In the present work, a statistical analysis of ionospheric phe-nomena before earthquakes with M ≥ 5.5 is performed. The conventional separation of strong earthquakes into so-called “deep” and “crust” ones is introduced, and separate analy-ses of related seismoionospheric phenomena are done. The difference between the seismoionospheric effects of these groups of earthquakes is revealed; it is perhaps connected with different mechanisms of the transfer of a part of the earthquake preparation energy from the earthquake prepara-tion region to the ionosphere. However, the analysis of the physical mechanisms of energy transfer was not the intent of the paper, since from the point of view of the authors,
nowa-days even the morphological features of seismoionospheric effects of strong earthquakes are not yet sufficiently studied. A statistical analysis of Es-spread effects as earthquake precursors is performed in the work. Es-spread data are very rare, with only a few independently working researchers de-riving them from ionograms. The analysis of the Es-spread observations shows that Es-spread increases 1–3 days before earthquakes with M ≥ 5.5, the effect is stronger for deep earthquakes.
In addition, the semi-transparency of the Es-layers is stud-ied. The semi-transparency can also be used to demonstrate seismoionospheric effects. It should be noted that the value of the semi-transparency depends on the presence of small-scale (meters and tens of meters) plasma inhomogeneities of the Es-layers. It was found in this work that the semi-transparency increases 1-4 days before crust earthquakes. But it does not change before deep earthquakes.
Furthermore, a statistical analysis of the f bEs-frequency is performed for earthquakes with M ≥ 5.5. Earlier it was revealed that the mean nighttime value of f bEs decreases from the (−2) night to the (−1) night for earthquakes with 5 ≤ M. It is self-evident that earthquakes with 5 ≤ M ≤ 5.5 form a large part of the earthquakes with M ≥ 5. The results of the present investigation also showed that they play a dominant role. In the paper, the characteristic time scale of the decrease of the mean f bEs-frequency is determined for earthquakes with M ≥ 5.5; it equals about 2 days (not 1, as for earthquakes with 5 ≤ M ≤ 5.5).
The morning decrease of the f oF2-frequency is also sta-tistically investigated for the first time. It possesses a time scale of about two days.
It is found that the decreases in the f oF2 and f bEs pa-rameters take place for both deep and crust earthquakes.
Our analyses allow one to assume that the semi-transparency coefficient is the most perspective parameter for a future earthquake prediction system.
Acknowledgements. C.-V. M. thanks the Ministerium f¨ur
Wis-senschaft, Forschung und Kultur des Landes Brandenburg for mak-ing it possible to work on the given topic.
References
Alimov, O. A., Roubtsov, L. N., Gokhberg, M. B., Liperovskaia, E. V., Gufeld, I. L., and Liperovsky, V. A.: Anomalous
charac-118 A. S. Silina et al.: Ionospheric phenomena before strong earthquakes
teristic of the middle latitude Es layer before earthquakes, Phys. Earth. and Planet. Inter., 57, 76–81, 1989.
Bowman, G. G.: Some aspects of mid-latitude spread Es and its relationship with spread F, Planet. Space Sci., 33, 9, 1081, 1985. Danilov, A. D., Kazimirovsky, E. S., Vergasova G. V., and Khachikyan, G. Ya.: Meteorological Effects in the Ionosphere, Leningrad, Gidrometeoizdat, (in Russian), 1987.
Gokhberg, M. B., Morgounov, V. A., and Pokhotelov, O. A.: Earth-quake Prediction: Seismoelectromagnetic Phenomena, Gordon and Breach Science Publishers, Reading-Philadelphia, 1995. Gorbunova, T. A. and Shved G. M.: The analysis of Es-layer
semi-transparency as an indicator of turbulence with dynamically ho-mogeneous conditions, Geomagnetism and Aeronomy, 24, 1, 30–34, 1984.
Hayakawa, M., (Ed): Atmospheric and Ionospheric Electromag-netic Phenomena Associated with Earthquakes, Terra Sci. Pub. Co., Tokyo, 1999.
Hayakawa, M. and Fujinawa, Y., (Eds): Electromagnetic Phenom-ena Related to Earthquake Prediction, Terra Sci-Pub. Co., Tokyo, 1994.
Liperovskaya, E. V., Silina, A. S., Saidshoev, A., Liperovsky, V. A., Meister, C.-V., and Vasil’eva, N. E.: On the effect of spread Es of night sporadic layers, Geomagnetism and Aeronomy, 40, 1, 112–114, 2000.
Liperovskiy, V. A., Pokhotelov, O. A., Liperovskaya, Ye. V.,
Rubtsov, L. N., Fomichev, Yu. P., and Saydshoyev, A.: Patterns of some seismo-ionospheric effects, Doclady RAN, 331A, 6, 24– 28, 1995.
Liperovsky, V. A., Meister, C.-V., Popov, K. V., Liperovskaya, E. V., Molchanov, O. A., and Silina, A. S.: On the time scales of some seismoionosphere effects, International Workshop on Seismo-electromagnetics, 2000 of NASDA, Programs and Abstracts, 19– 22 September 2000, The University of Electro-Communications Chofu-City, Tokyo, Japan, 178–182, 2000b.
Liperovsky, V. A., Pokhotelov, O. A., Liperovskaya, E. V., Parrot, M., Meister, C.-V., and Alimov, O. A.: Modification of sporadic E-layers caused by seismic activity, Surv. in Geophys., 21, 449– 486, 2000a.
Liperovsky, V. A., Pokhotelov, O. A., and Shalimov, S. L.: Iono-spheric precursors of earthquakes, Nauka, Moscow, (in Russian), 1992.
Ondoh, T.: Seismo-ionospheric phenomena, Adv. Space Res., 26, 8, 1267–1272, 2000.
Pulinets, S. A.: Strong earthquake prediction possibility with the help of topside sounding from satellites, Adv. Space Res., 21, 3, 445–458, 1998.
Takefu, M.: Bragg scattering of radio waves by ionospheric wave-like irregularities, J. Geomagnetism and Geoelectricity, 41, 8, 647–672, 1989.