HAL Id: insu-01179988
https://hal-insu.archives-ouvertes.fr/insu-01179988
Submitted on 23 Jul 2015
HAL is a multi-disciplinary open access
archive for the deposit and dissemination of
sci-entific research documents, whether they are
pub-lished or not. The documents may come from
teaching and research institutions in France or
abroad, or from public or private research centers.
L’archive ouverte pluridisciplinaire HAL, est
destinée au dépôt et à la diffusion de documents
scientifiques de niveau recherche, publiés ou non,
émanant des établissements d’enseignement et de
recherche français ou étrangers, des laboratoires
publics ou privés.
Phenomena of electrostatic perturbations before strong
earthquakes (2005–2010) observed on DEMETER
X Zhang, X Shen, Michel Parrot, Z Zeren, X Ouyang, J. Liu, J Qian, S Zhao,
Y Miao
To cite this version:
X Zhang, X Shen, Michel Parrot, Z Zeren, X Ouyang, et al.. Phenomena of electrostatic
perturba-tions before strong earthquakes (2005–2010) observed on DEMETER. Natural Hazards and Earth
System Sciences, European Geosciences Union, 2012, 12, pp.75-83. �10.5194/nhess-12-75-2012�.
�insu-01179988�
1Institute of Earthquake Science, CEA, Beijing 100036, China
2LPC2E/CNRS, 3A Avenue de la Recherche Scientifique, 45071 Orl´eans cedex 2, France
Correspondence to: X. Zhang (zhangxm69@yahoo.cn)
Received: 27 October 2010 – Revised: 30 November 2011 – Accepted: 5 December 2011 – Published: 9 January 2012
Abstract. During the DEMETER operating period in 2004–
2010, many strong earthquakes took place in the world. 69 strong earthquakes with a magnitude above 7.0 during January 2005 to February 2010 were collected and anal-ysed. The orbits, recorded in local nighttime by satellite, were chosen by a distance of 2000 km to the epicentres dur-ing the 9 days around these earthquakes, with 7 days before and 1 day after. The anomaly is defined when the distur-bances in the electric field PSD increased to at least 1 or-der of magnitude relative to the normal median level about 10−2µV2/m2/Hz at 19.5–250 Hz frequency band, and the starting point of perturbations not exceeding 10◦ relative to the epicentral latitude. Among the 69 earthquakes, it is shown that electrostatic perturbations were detected at ULF-ultra low frequency and ELF-extremely low frequency band before the 32 earthquakes, nearly 46 %. Furthermore, we extended the searching scale of these perturbations to the globe, and it can be found that before some earthquakes, the electrostatic anomalies were distributed in a much larger area a few days before, and then they concentrated to the closest orbit when the earthquake would happen one day or a few hours later, which reflects the spatial develop-ing feature durdevelop-ing the seismic preparation process. The re-sults in this paper contribute to a better description of the electromagnetic (EM) disturbances at an altitude of 660– 710 km in the ionosphere that can help towards a further un-derstanding of the lithosphere-atmosphere-ionosphere (LAI) coupling mechanism.
1 Introduction
Spatial electromagnetic phenomena have been widely ob-served by satellites, including the anomalies in the electric field, magnetic field, plasma parameters and energetic
par-ticles (Pulinets and Boyarchuk 2004; Zhang et al., 2007; Anagnostopoulos and Rigas, 2009). Ionospheric anomalies attract more and more attention nowadays by their short-term feature, for they always occur one week before earth-quakes. A lot of statistical analysis has shown the cor-relation between the electric field anomalies in the iono-sphere and strong earthquakes. An anomalous increase in the intensity of low-frequency (0.1–16 kHz) radiowave emis-sions was detected by using Intercosmos-19 data (Larkina et al., 1989). Parrot and Mogilevsky (1989) studied the GEOS and AUREOL-3 satellite data and they found that earthquakes caused extremely low frequency electromag-netic emissions in the upper ionosphere. Parrot (1994) anal-ysed the AUREOL-3 satellite data of around 325 earthquakes with Ms > 5. His results showed that during a 24-h win-dow, the maximum amplitude in the electric field occurred in the interval of 1Lon<10◦ (Lon∼ longitude) from the epicentres regardless of 1Inv.lat (Inv.lat ∼ invariant lati-tude). Molchanov et al. (1993) summarized the 28 earth-quakes occurring during 16 November 1989 to 31 Decem-ber 1989, based on Intercosmos-24 satellite data. They found that emissions with a spectrum maxima were observed at ULF-ELF (f less than 1000 Hz) over the epicentral areas and these emissions were mainly observed at 12–24 h before the main shocks. Serebryakova et al. (1992) found similar EM radiations on satellites COSMOS-1809 and AUREOL-3 with a frequency below 450 Hz over the seismic region in Armenia before strong earthquakes during 20 January to 17 February 1989. Gousheva et al. (2008) presented their results of anomalies in the quasi-static electric field in the upper ionosphere(h = 800–900 km) observed by the satellite INTECOSMOS-BULGARIA-1300 over seismic regions and found the increase in the vertical component of the electric field based on 250 investigated cases.
76 X. Zhang et al.: Phenomena of electrostatic perturbations
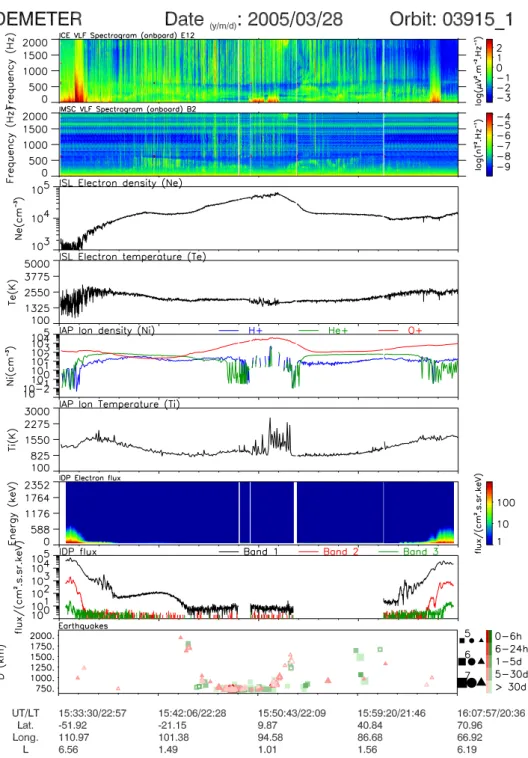
Fig. 1. The electromagnetic perturbations before the Sumatra 8.6 Earthquake on 28 March 2005.
DEMETER, a French micro-satellite, launched on 29 June 2004, was the first one in the world to be designed specially for studying the ionospheric variations possibly as-sociated with earthquakes, man made transmitters, volcanoes and lightning, having a solar synchronous circular orbit, dec-lination of 98.23◦, and a height of 710 km (which decreased to 660 km in mid-December 2005). A set of instruments were
deployed on the satellite, including ICE to detect the electric field from DC to 3.5 MHz; IMSC to measure the magnetic field from a few Hz to 20 kHz; IAP to detect ion density and temperature; ISL, Langmuir probe to measure the electron density and temperature; IDP to detect the energetic electron flux at 72.9 keV–2.34 MeV.
ergy Ez for the time interval of 30 days before this earth-quake. In some case studies, an interesting phenomenon of electrostatic perturbation was observed in the electric field at a frequency lower than 250 Hz before some strong earth-quakes (Zhang et al., 2009; Ouyang et al., 2007), in which the electrostatic perturbations appeared where they rarely oc-curred over regions at mid- and lower-latitude of 20–35◦. In this paper, we are focusing on, in more detail, the electric field data in the nighttime observed by DEMETER around the earthquakes of Ms ≥ 7.0 in globe since 1 January 2005 to 28 February 2010. The electrostatic perturbations in the ionosphere are picked up and analysed. The coupling mech-anism between earthquakes and ionospheric electrostatic per-turbations is discussed as well.
2 Data collection and anomaly identification
Due to incomplete orbits at the end half of 2004, the begin-ning stage of DEMETER, the satellite data during this pe-riod was not included in this paper. A total of 69 strong earthquakes above a magnitude 7.0 since January of 2005 to February 2010 were collected (http://neic.usgs.gov; http: //www.csndmc.ac.cn). If the earthquake with a magnitude above 7.0 is dealt with, the scope of the so called “seismic preparation region” could exceed 1000 km from the epicen-tre expressed in terms of the equation of ρ = 100.43M based on the statistics of the ground observation (Dobrovosky et al., 1979) within the scope, some ionospheric perturbations could possibly be triggered by the earthquake preparation process. The observing satellite data were chosen during the 9 days with 7 days before and 1 day after these earth-quakes. It should be noted that ULF electromagnetic ac-tivity was detected much earlier and probably suggests a long period of ULF seismic precursory signals (Hayakawa et al., 1996). Here, we focused on short-term ULF/ELF phe-nomena after considering the conclusions about ionospheric precursors that occurred mostly within a week before the earthquakes (Pulinets and Boyarchuk, 2004). Only up-orbits recorded during nighttime, under quiet electromagnetic con-dition, were selected in this paper to avoid the effects of so-lar activity. Taking into account the spatial correlation, the anomalies could be considered to be related to the
earth-The orbit (3915-1) in Fig. 1 is such an example of anoma-lies chosen according to the requirement, just flying over In-donesia 50 min before the Sumatra M = 8.6 Earthquake oc-curring at 16:39:36.52, 28 March 2005, located at 97.11◦E–
2.09◦N. In Fig. 1, the panels show the parameters (from top
to bottom) as follows: the VLF electric field spectrum at 19.5 Hz–2 kHz, the VLF magnetic field spectrum at 19.5 Hz– 2 kHz, Ne(electron density), Te(electron temperature), Ni(ion density of H+, He+, O+), Ti(ion temperature), the energetic electron spectrum between 72.9 keV–2.34 MeV, the electron flux at three bands (90–600 keV; 0.6–1 MeV; 1–2.34 MeV), the earthquakes occurring less than 2000 km apart from this orbit during ±30 days. As presented in Fig. 1, the distur-bances were detected at the equatorial region in most observ-ing parameters, includobserv-ing the electric field at ULF/ELF fre-quency band that we paid attention to in this paper, electron density, electron temperature, ion density, and so on. Here the perturbations, at ULF/ELF band less than 250 Hz of the electric field, are considered as electrostatic perturbations.
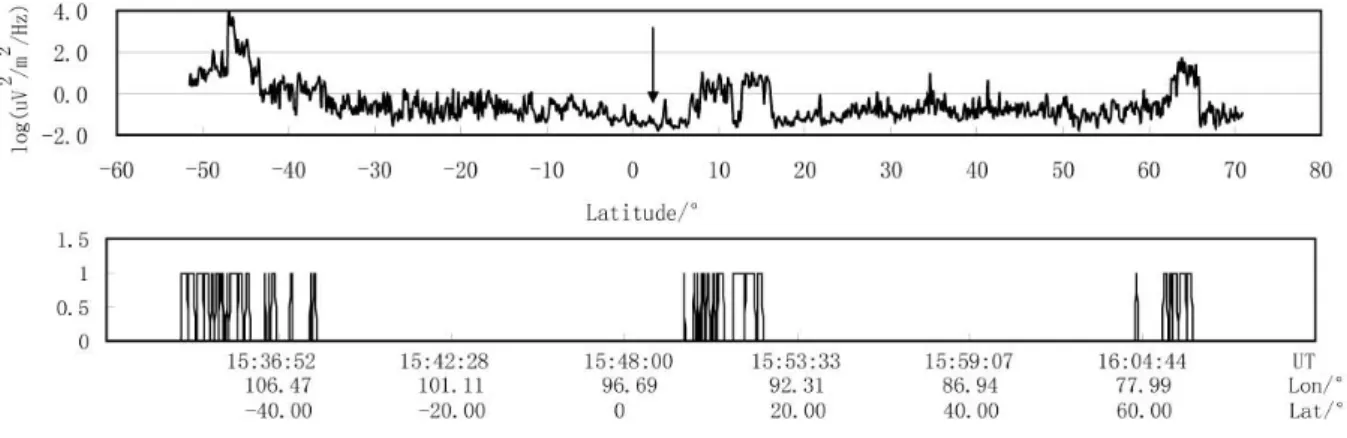
Figure 2 exhibits the disturbances extracted from the elec-tric field spectrum along orbit 3915-1. The first top panel presents the median value of PSD (power spectrum density) in the electric field at 19.5–250 Hz, in which the spectra density over the seismic region increased with two orders of magnitude relative to its surrounding normal level, ex-ceeding 102µV2/m2/Hz. After repetitive testing, the elec-trostatic perturbations were selected by an automatic tech-nique developed by Zhang et al. (2010). They were picked following this definition: A0>100.7µV2/m2/Hz where A0
is the first PSD value at 19.5 Hz, and other PSD values at the following frequency points should fit the exponential re-lation of SE=A0·f−b, where SE represents the PSD value
at a different frequency and f is frequency (Zhang et al., 2010). The lower panel shows the selected anomalous sig-nals (with value 1) and normal points (with value 0). It can be found that the distinguished anomalies are consistent with the perturbations shown in the top panel. In Fig. 2, some strong perturbations were also very clear and significantly above the latitude of 40◦, which can be detected almost ev-ery day, especially along the orbits of the Eastern Hemi-sphere. So these perturbations at higher latitudes may not be related to strong earthquakes, but to the auroral electrojets and energetic electrons precipitation into radiation belts over
78 X. Zhang et al.: Phenomena of electrostatic perturbations
Fig. 2. Ionospheric perturbations in electric field along the orbit 3915-1.
this region, which can be proven by the stronger particle flux at the same latitudes. These signals at high latitudes should be cast off in anomaly identification according to their geo-graphical positions, therefore, earthquakes at high latitudes were not discussed in this paper because it is difficult to dis-tinguish whether or not the perturbations in the electric field were motivated by earthquakes under this strong noise back-ground.
Based on the definition of anomalies and electrostatic perturbations, among 69 earthquakes within the latitude of 40◦, the electrostatic perturbations were observed before the 32 earthquakes along the up-orbits in a distance from the epicentres less than 2000 km during the 9 days, while there is one earthquake only showing post-seismic anomaly with-out precursors. All the details abwith-out these 32 earthquakes and anomalies around them are listed in Table 1, including the date, time, magnitude(Ms), longitude(Lon), latitude(lat), depth of the earthquake and also the time differences between anomalies and earthquakes, latitude and longitude scale of anomalies, median value of PSD in the electric field at 19.5– 250 Hz, and dailyPKp index. Some of the PKp values are followed by the letter D that represents that day being in a disturbed state. Actually, the Kp in most days was not marked by D in Table 1, which means most anomalies ap-peared in quiet electromagnetic condition. It also demon-strated, from another aspect, that the perturbations could be well correlated with earthquakes, instead of solar activity or other space impact-factors due to low Kp values during those days.
It can be seen from Table 1 that the anomalies in ULF/ELF electric field appeared many times before some earthquakes, such as the Sumatra 8.6 Earthquake on 28 March 2005; Haiti 7.0 Earthquake on 12 January 2010 and so on, which re-flect that ULF/ELF perturbations continued a long time over the seismic region during the earthquake preparation process. Moreover, there are 21 earthquakes among 32 events with the ionospheric perturbations occurring in 3 days prior to them, showing the short-term temporal feature of ULF/ELF EM perturbations in ionosphere.
3 Analysis on electrostatic perturbations and discussion 3.1 Spatial distribution of earthquakes
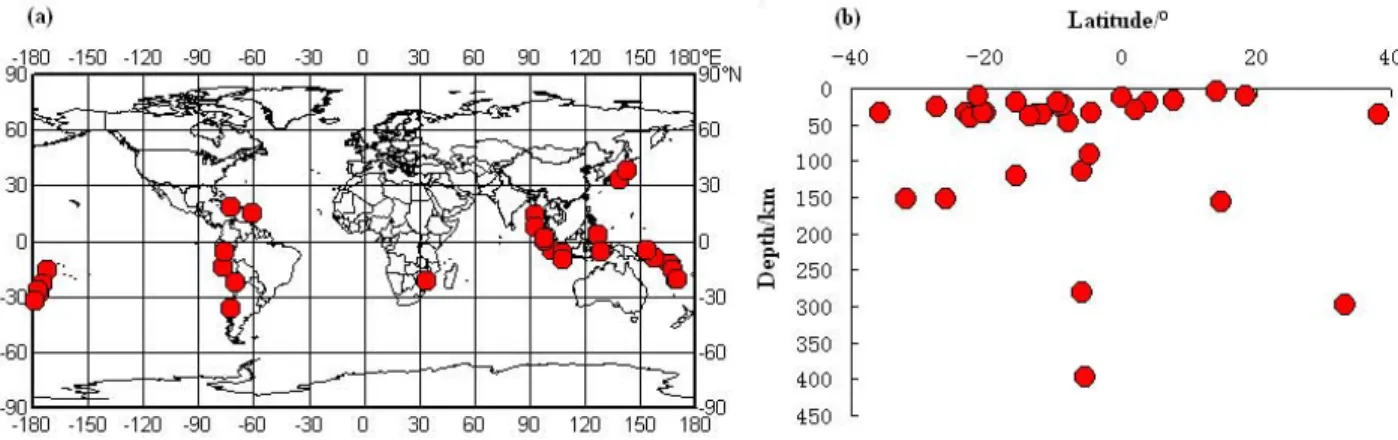
Figure 3 shows the global epicentral distribution of the se-lected 32 earthquakes (Fig. 3a), and the projection of their depths versus latitudes (Fig. 3b). It can be seen that: (1) these earthquakes are mostly located at the plate boundaries; (2) there are 21 earthquakes located in the latitude scale of ±20◦, with electrostatic perturbations being unusual; (3) among them 8 earthquakes are deeper than 100 km, occupy-ing 25 %, and even most earthquakes are located in the ocean, not on land, as shown in Table 1. Figure 3a shows that these 32 earthquakes are mainly along the Circum-Pacific Seis-mic belt, which may indicate that interaction between giant plates would more easily produce intensive anomalies along the major faults and then induce electrostatic perturbations in the ionosphere.
It is well known that when EM waves propagate in water from the ocean bottom, they will attenuate largely, that is to say, the EM wave has difficulty when penetrating seawater into the atmosphere and ionosphere directly. Why so many perturbations were detected before oceanic earthquakes? A speculation might explain it as follows: radon or other chem-ical materials emitted from the oceanic faults would change the ionization in seawater and the composition of water ions in it. This change would lead to the variation of the atmo-spheric vertical electric field over the seismic region. The variation of atmospheric electric field as a part of the current system between ionosphere and lithosphere would cause the change of the current system in the ionosphere, which might lead to the disturbances in kinds of parameters including the ULF/ELF electric field.
2009-8-9 10-55-55.61 7.1 137.94 33.17 297 O −4 day +1 h 35◦∼43◦N 32◦∼37◦N 117◦∼120◦E 138◦∼140◦E 1 0.5 11 12 2009-3-19 18-17-40.91 7.6 −174.66 −23.05 34 O −6 day −1 day 17◦∼24◦S 18◦∼20◦S 169◦∼171◦E 180◦∼181◦E 0.5∼1 0.5 25(D) 3 2009-2-18 21-53-45.16 7.0 −176.33 −27.42 25 O −5 day −4 day −2 day −18.5 h 10◦∼21◦S 12◦∼20◦S 16◦∼28◦S 18◦∼26◦S 182◦∼185◦E 175◦∼177◦E 185◦∼188◦E 195◦∼197◦E 0.5∼1.2 1 1 0.5 4 24(D) 7 6 2009-2-11 17-34-50.49 7.2 126.39 3.89 20 O −3 day +1 day 6◦S∼2◦N 0◦∼5◦N 119◦∼121◦E 137◦∼138◦E 0.5 0.5∼1.0 1 3 2008-4-9 12-46-12.72 7.3 168.89 −20.07 33 O −5 day −2 h 12◦∼20◦S 16◦∼21◦S 159◦∼161◦E 170◦∼171.5◦E 0.4 0.5 15 22 2007-12-9 07-28-20.82 7.8 −177.51 −26 152 O −7 day −5 day −3 day −2 day 18◦∼19◦S 28◦∼35◦S 20◦∼30◦S 24◦∼32◦S 179◦∼180◦E 191◦∼193◦E 175◦∼200◦E 190◦∼200◦E 1.5 1∼1.5 0.5∼1.2 0.5∼1.2 3 2 5 2 2007-11-29 19-00-20.42 7.4 −61.27 14.94 156 O −5 day 4◦∼6◦N 309◦∼309.5◦E 0∼1 22(D) 2007-11-14 15-40-50.53 7.7 −69.89 −22.25 40 L −6 day -3 day −1 day 24◦∼37◦S 25◦∼40◦S 10◦∼23◦S 291◦∼295◦E 294◦∼297◦E 299◦∼301◦E 0 0 −1∼0 7 4 19 2007-9-12 11-10-26.83 8.5 101.37 −4.44 34 L −5 day −5.7 h 4◦∼10◦S 8◦∼10◦S 100◦∼101◦E 111◦∼112◦E 0.7∼1.5 0.3 18 4 2007-9-2 01-05-8.15 7.2 165.76 −11.61 35 O −5 day −4 day 6◦∼16◦S 5◦∼20◦S 177◦∼179◦E 169◦∼173◦E 0.5∼1 0.5∼1 18 9 2007-08-15 23-40-57.89 8.0 −76.6 −13.39 39 L −6 day 8◦∼12◦S 298.5◦∼299.3◦E 0.5 6 2007-8-8 17-05-04.92 7.5 107.42 −5.86 280 O −4 day −2 day −2 h 1◦S∼5◦N 4◦∼9◦S 4◦S∼5◦N 113◦∼115◦E 100◦∼101◦E 107◦∼110◦E 0.5∼1.2 0.5∼1 0.5∼1 2 18 11 2007-8-1 17-08-51.4 7.2 167.68 −15.6 120 O −6 day 10◦∼20◦S 161◦∼163◦E 0.5∼1.5 13 2007-4-1 20-39-58.71 7.2 157.04 −8.47 24 O −4 day 6◦∼10◦S 149◦∼150◦E 0.5∼1.5 12 2007-3-25 00-40-1.61 7.1 169.36 −20.62 34 O −7 day −5 day 4◦∼15◦S 4◦∼18◦S 151◦∼154◦E 161◦∼164◦E 0.5 0.5∼1.5 6 1 2006-7-17 08-19-30.5 7.3 107.4 −9.4 20 O −7 day −6 day −5 day −4 day −3 day +7 h 18◦∼20◦S 14◦∼20◦S 14◦S∼6◦N 20◦S∼20◦N 20◦S∼20◦N 14◦∼20◦S 116.5◦∼117◦E 108◦∼110◦E 96◦∼101◦E 90◦∼120◦E 100◦∼115◦E 111◦∼113◦E 1 1 0∼1 0∼1 1 1∼1.5 17 12 19(D) 10 19(D) 6 2006-5-16 15-28-24.6 7.2 97.2 0.1 12 O −1 h= +0.5 h 2◦S∼2◦N 8◦∼10◦S 117◦∼118◦E 94◦∼96◦E 0.5∼1 0.4∼1 6 6 2006-5-16 10-39-20.4 7.4 −179.31 −31.81 152 O −1 h 33◦∼35◦S 198◦∼200◦E 0.5∼1 6 2006-2-22 22-19-9.6 7.5 33.2 −21.1 11 L −3 day 9◦∼12◦S 42◦∼43◦E 0.5∼1 14 2006-1-27 16-58-50.0 7.6 128.1 −5.4 397 O −2.5 h 2.8◦S∼15◦N 115◦∼120◦E 0∼1 20 2005-9-26 01-55-37.67 7.5 −76.4 −5.68 115 L −4 day −3 day 14◦∼25◦S 10◦∼23◦S 276◦∼279◦E 290◦∼296◦E 1 1 13 12 2005-9-9 07-26-43.73 7.6 153.47 −4.54 90 O −5 day −4 day −3 day −1 day +3.5 h 6◦∼10◦S 4.5◦∼6◦S 10◦S∼10◦N 6◦∼10◦S 4◦∼13◦S 147◦∼148◦E 160.5◦∼161◦E 144◦∼154◦E 153.5◦∼154.5◦E 167◦∼169◦E 0.5∼1 0.4∼0.6 0.5∼1 0.5∼1 0.4∼1 29 20 15 13 22 2005-08-16 02-46-28.4 7.2 142.04 38.28 36 L +1 day 37◦∼41◦N 157◦∼159◦E 0∼1 22 2005-07-24 15-42-06.21 7.2 92.19 7.92 16 O −2 day 14◦∼15◦N 80◦∼81◦E 0.5∼1 20 2005-3-28 16-09-36.53 8.6 97.11 2.09 30 L −6 day −5 day −3 day −20 min 1◦S∼4◦N 6◦S∼2◦N 8◦∼11◦N 3.5◦∼14.8◦N 109◦∼110◦E 101◦∼103◦E 102◦∼103◦E 93◦∼95◦E 1∼1.5 0.5∼1 0.3 0.5∼1 5 7 27(D) 9
80 X. Zhang et al.: Phenomena of electrostatic perturbations
Fig. 3. Spatial (a) and depth (b) distribution of earthquakes with electrostatic perturbations (the circle represents the earthquake).
3.2 Extended spatial characteristic of ULF/ELF electric field perturbations
In order to study the relationship between ULF/ELF electro-static perturbations and earthquakes, the global distribution of the perturbations before the Sumatra M = 8.6 Earthquake on 28 March 2005 were selected as an example and the time differences were still limited to 7 days before the earthquakes as mentioned above. As shown in Table 1, the perturbations appeared on 22, 23 25 and 28 March in the orbits within the range of 2000 km from the epicentre. Here the question is whether the anomalies in the ionosphere only occur at the orbits nearest to the epicentre, or also at other orbits. Take the Sumatra Earthquake on 28 March 2005 as an example, the black segments marked in Fig. 4 give the global distribu-tion of EM perturbadistribu-tions during those days except the ones on 25 March which might be influenced by magnetic storms on that day. To allow a convenient comparison and visual-ized figures, the electric field signals with PSD larger than 5 µV2·m−2·Hz−1 and fitting exponential delay laws at the low frequency band of 19.5–250 Hz (Zhang et al., 2010) were assigned values of 1 (black circles) and taken as a time seg-ment of perturbations, or else they would be assigned values of 0 (gray circles) and taken as a time segment without dis-turbances. All the perturbations at the ultra-low frequency band are picked up along the orbits and plotted in Fig. 4. It can be seen that, at the latitude higher than 40◦, there existed
lots of these ULF/ELF perturbations, reasonably due to the effects of the polar ring current, energetic electron precipi-tation and other factors, which can also be seen very clearly in Figs. 1 and 2. Besides those signals at high latitudes, one could, however, find many perturbations around the epicentre of this M = 8.6 earthquake (black triangle) at lower latitudes in the range of ±20◦, and they extended from 0◦to 150◦E on 22 and 23 March. While, the perturbations on 28 March only occurred at the orbit closest to the epicentre, which shows a different feature with those on 22 and 23.
Similar EM perturbations, with a large scale, were also found before some other earthquakes (Zhang et al., 2010; Ruzhin et al., 1998). It seems to the authors that the follow-ing hypothesis of takfollow-ing the stress changes durfollow-ing the earth-quake preparation process as a source corresponding to the perturbations in the ionosphere, would be helpful in under-standing the feature. During the seismic preparation stage, there would be a region much larger than the epicentral area, being under a state of stress accumulation, and the electro-magnetic signals might be frequently produced and continue for a long time. When they propagate to the ionosphere, to-gether with the ion and electron drift in the ionosphere, they can be detected by many orbits. As soon as the earthquake process enters into its impending stage, the stress would be concentrated just in the epicentral area while the anomalous region would shrink correspondingly.
3.3 Discussion
The possible coupling mechanisms among lithosphere-atmosphere-ionosphere (LAI) have been suggested in many publications (Pulinets et al., 2000; Pulinets and Boyarchuk, 2004; Molchanov et al., 2004; Rycroft, 2006; Namgaladze et al., 2009; Pulinets and Ouzounov, 2011). Some of them will be discussed on the ionospheric perturbations in the ULF/ELF electric field associated with strong earthquakes.
One possible mechanism is the direct penetration of ULF/ELF EM waves from the epicentres into the iono-sphere. There are many results to illustrate the exis-tence of ULF/ELF/VLF electromagnetic (EM) emissions prior to strong earthquakes in ground-based observations (Hayakawa, 2004). When energy is accumulated under-ground to some extent, microstructures will increase and electromagnetic emissions will be produced simultaneously. Another source has also been proposed that positively charged holes are easy to constitute into minerals especially semi-conductor minerals when they are heated. Some labora-tory experiments support this possibility (Freund, 2000; Shen et al., 2009). Based on numerical computations, ULF/ELF
Fig. 4. The spatial distribution of electrostatic perturbations (dark points) on 22, 23 and 28 March before a 8.6 earthquake at Suma-tra Indonesia on 28 March 2005 (the triangle in the figure is the epicentre).
lences (Namgaladze et al., 2009). The heating of sunlight and tidal effects will lead to the upward movement of plasma in the lower ionosphere, penetrating the geomagnetic power lines and then constructing an electric current in E layer. This electric current acts with horizontal magnetic power lines and causes the increase in electron density in the ionosphere at ±20◦geomagnetic latitudes around the magnetic equator. In our paper, at the observing altitude of DEMETER with 660– 710 km, the ionospheric crest is always shown as one peak near the magnetic the equatorial area (see the first panel of electron density in Fig. 1), but as shown in Fig. 4 and com-bined with the results of Pulinets et al. (2006), the pertur-bations occurred at two sides of the crest of Ne on 22 and 23 March before the Sumatra Earthquake. Over an epicen-tral area near the equator, the vertical electric field might be changed due to the accumulation of radon or aerosols in the near-earth atmosphere at the seismic preparation area (Liper-ovsky et al., 2005), and then the east directed polarization electric field would be generated due to the different drift ve-locities of electrons and ions. The east directed electric field would stimulate the equatorial anomaly amplification while plasma bubble would be formed in the bottom-side iono-sphere and float up to the DEMETER altitude (Pulinets et al., 2006). The double peak structure can persist until the late evening hours, just the time of the DEMETER up-orbits in local nighttime, which has been recently proven in the paper of Vyas and Andamandan (2011). So this mechanism may be used to explain some anomalous phenomena in ULF/ELF electric field near the equatorial area.
4 Conclusions
Among 69 earthquakes, DEMETER satellite observed iono-spheric perturbations in the ULF/ELF electric field during lo-cal nighttime before the 32 earthquakes, which demonstrates that these ionospheric disturbances were not casual phenom-ena, but may be associated with earthquakes. All the charac-teristics of these anomalies were summed up as follows:
1. Before 46 % strong earthquakes in 69 studied cases with a magnitude above Ms = 7.0, the electrostatic pertur-bations were obtained at 19.5–250 Hz in a distance of
82 X. Zhang et al.: Phenomena of electrostatic perturbations
2000 km and latitudinal difference of 10◦ in the
iono-sphere. The anomalies occurred mostly within 3 days before the 21 earthquakes. Only 7 earthquakes among them showed anomalies a few hours before the earth-quakes (Table 1). These 32 earthearth-quakes are mainly lo-cated at the boundary of plates. But the depth of earth-quakes does not show significant influence on the form-ing of ES turbulences in the ionosphere.
2. Extended study in this paper proved that before the 8 earthquakes, the perturbations in the ionosphere could be observed in a very large scale in longitude, but when the observing time was closer to the earthquake occur-rence, the anomalous area shrank, and perturbations al-ways only occurred along the closest orbits apart from the epicentres, which may be related to the different stress developing stages in the earthquake preparation process.
3. There are 54% of earthquakes with no obvious ES per-turbations detected. The main reasons that are taken into account: the first, some of these cases are located at high latitudes so the ES perturbations can not be easily distinguished with those long existing ES turbulences at this region; the second, the flying time of a single satellite is limited when it crosses a certain place, only once a day like the DEMETER satellite, so it can not be ensured that the anomaly at the seismic region can continue for a very long time in order to meet the satel-lite; the third, there was no anomaly at all at the seismic region, or the anomaly is not intense enough to result in ionospheric perturbations.
4. The LAI coupling process is complex and there are only some qualitative interpretations at present. Based on the results in this paper and combined with other re-searches, the direct ULF/ELF EM propagation, the cou-pling mechanism between the enhanced vertical electric field in the atmosphere and EIA amplification are sug-gested to be important factors to explain the ionospheric electrostatic perturbations in the ULF/ELF electric field. In order to understand and verify the mechanism be-tween the ionospheric perturbations with strong earth-quakes, it is necessary to strengthen the observation of multi-parameters on the ground, in the atmosphere and ionosphere synchronously.
Acknowledgements. This paper is funded by the International
Cooperation Project (2009DFA21480) and the Key Earthquake Science Research Fund (201008007). We are grateful to the DEMETER Data Centre for the provision of the satellite data. Edited by: M. E. Contadakis
Reviewed by: three anonymous referees
References
Anagnostopoulos, G. and Rigas, V.: Variations of energetic radi-ation belt electron precipitradi-ation observed by DEMETER before strong earthquakes, Geophys. Res. Abstr., EGU2009-10700, 11, 2009.
Athanasiou, M. A., Anagnostopoulos, G. C., Iliopoulos, A. C., Pavlos, G. P., and David, C. N.: Enhanced ULF radiation observed by DEMETER two months around the strong 2010 Haiti earthquake, Nat. Hazards Earth Syst. Sci., 11, 1091–1098, doi:10.5194/nhess-11-1091-2011, 2011.
Bortnik, J. and Bleier, T.: Full wave calculation of the source char-acteristics of seismogenic electromagnetic signals as observed at LEO satellite altitudes, Eos Trans. AGU, 85(47), Fall Meet. Suppl., Abstract T51B-0453, 2004.
Dobrovosky, I. R., Zubkov, S. I., and Myachkin, V. I.: Estimation of the size of earthquake preparation zones, PAGEOPH, 117, 1025– 1044, 1979.
Freund, E.: Time-resolved study of charge generation and propa-gation in igneous rocks, J. Geophys. Res., 105, 11001–11019, 2000.
Gousheva, M., Danov, D., Hristov, P., and Matova, M.: Quasi-static electric fields phenomena in the ionosphere associated with pre-and post earthquake effects, Nat. Hazards Earth Syst. Sci., 8, 101–107, doi:10.5194/nhess-8-101-2008, 2008.
Hayakawa, M.: Electromagnetic phenomena associated with earth-quakes: a frontier in terrestrial electromagnetic noise environ-ment, Recent Res. Dev. Geophys., 6, 81–112, 2004.
Hayakawa, M., Molchanov, O. A., Ondoh, T., and Kawai, E.: The precursor signature effect of the Kobe earthquake in VLF subionospheric signal, J. Comm. Res. Lab., Tokyo, 43, 160, 1996.
Larkina, V. I., Migulin, V. V., Molchanov, O. A., Kharkov, I. P., Inchin, A. S., and Schvetcova, V. B.: Some statistical results on very low frequency radiowave emissions in the upper ionosphere over earthquake zones, Phys. Earth Planet. In., 57, 1–2, 100–109, 1989.
Liperovsky, V. A., Meister, C.-V., Liperovskaya, E. V., Davidov, V. F., and Bogdanov, V. V.: On the possible influence of radon and aerosol injection on the atmosphere and ionosphere be-fore earthquakes, Nat. Hazards Earth Syst. Sci., 5, 783–789, doi:10.5194/nhess-5-783-2005, 2005.
Molchanov, O. A., Mazhaeva, O. A., Goliavin, A. N., and Hayakawa, M.: Observation by the Intercosmos-24 satellite of ELF-VLF electromagnetic emissions associated with earth-quakes, Ann. Geophys., 11, 431–440, 1993,
http://www.ann-geophys.net/11/431/1993/.
Molchanov, O., Fedorov, E., Schekotov, A., Gordeev, E., Chebrov, V., Surkov, V., Rozhnoi, A., Andreevsky, S., Iudin, D., Yunga, S., Lutikov, A., Hayakawa, M., and Biagi, P. F.: Lithosphere-atmosphere-ionosphere coupling as governing mechanism for preseismic short-term events in atmosphere and ionosphere, Nat. Hazards Earth Syst. Sci., 4, 757–767, doi:10.5194/nhess-4-757-2004, 2004.
Namgaladze, A. A., Klimenko, M. V., Klimenko, V. V., and Za-kharenkova, I. E.: Physical mechanism and mathematical model-ing of earthquake ionospheric precursors registered in total elec-tron content, Geomagn. Aeronomy+, 49, 2, 252–262, 2009. Nˇemec, F., Santol´ık, O., and Parrot, M.: Decrease of intensity
of ELF/VLF waves observed in the upper ionosphere close to
2006.
Parrot, M. and Mogilevsky, M. M.: VLF emissions associated with earthquakes and observed in the ionosphere and the magneto-sphere, Phys. Earth Planet. In., 57, 1–2, 86–99, 1989.
Pulinets, S. A., Boyarchuk, K. A., Hegai, V. V., Kim, V. P., and Lomonosov, A. M.: Quasielectrostatic model of atmosphere-thermosphere-ionosphere coupling, Adv. Space Res., 26, 1209– 1218, 2000.
Pulinets, S. A. and Boyarchuk, K. A.: Ionospheric Precursors of Earthquakes, Springer, Berlin, Heidelberg, New York, 1–287, 2004.
Pulinets, S. and Ouzounov, D.: Lithosphere-Atmosphere-Ionosphere Coupling(LAIC) model-An unified concept for earth-quake precursors validation, J. Asian Sci., 41, 371–382, 2011. Pulinets, S., Ouzounov, D., and Parrot, M.: Conjugated
near-equatorial effects registered by DEMETER satellite before Sumatra earthquake M = 8.7 of March 28, 2005, International Symposium of DEMETER, Toulous-France, 14–16 June 2006.
28, 301–307, 2009, (in Chinese with English Abstract). Vyas, B. M. and Andamandan B.: Nighttime VHF ionospheric
scintillations characteristic near the crest of Appleton anomaly station Udanpur (24.6◦N, 73.7◦E), Indian J. Radio Space, 40, 191–202, 2011.
Zhang, X., Battiston, R., Shen, X., Zerenzhima, Ouyang, X., Qian, J., Liu, J., Huang, J., and Miao, Y.: Automatic collecting tech-nique of low frequency electromagnetic signals and its applica-tion in earthquake study, in: Knowledge Science, Eng. Manag., edited by: Bi, Y. and Williams, M. A., KSEM2010, LANI 6291, Springer, Berlin, Heidelberg, 366–377, 2010.
Zhang, X., Qian, J., Ouyang, X., Shen, X. H., Cai, J. A., and Zhao, S. F.: Ionospheric electromagnetic perturbations observed on DEMETER satellite before Chile M7.9 earthquake, Earthquake Sci., 22, 251–255, 2009.
Zhang, X., Zhao, G. Z., Chen, X. B., and Ma, W.: Seismo-electromagnetic observation abroad, Prog. Geophys., 22, 3, 687– 694, 2007 (in Chinese with English Abstract).