HAL Id: hal-02925711
https://hal.archives-ouvertes.fr/hal-02925711
Submitted on 30 Aug 2020
HAL is a multi-disciplinary open access
archive for the deposit and dissemination of
sci-entific research documents, whether they are
pub-lished or not. The documents may come from
teaching and research institutions in France or
abroad, or from public or private research centers.
L’archive ouverte pluridisciplinaire HAL, est
destinée au dépôt et à la diffusion de documents
scientifiques de niveau recherche, publiés ou non,
émanant des établissements d’enseignement et de
recherche français ou étrangers, des laboratoires
publics ou privés.
Quantification of stratospheric mixing from turbulence
microstructure measurements
Jean-Rémi Alisse, Peter Haynes, Jacques Vanneste, Claude Sidi
To cite this version:
Jean-Rémi Alisse, Peter Haynes, Jacques Vanneste, Claude Sidi. Quantification of stratospheric mixing
from turbulence microstructure measurements. Geophysical Research Letters, American Geophysical
Union, 2000, 27 (17), pp.2621-2624. �10.1029/2000GL011386�. �hal-02925711�
GEOPHYSICAL RESEARCH LETTERS, VOL. 27, NO. 17, PAGES 2621-2624, SEPTEMBER 1, 2000
Quantification of stratospheric mixing from turbulence
microstructure
measurements
Jean-Rmi Alisse
Service d'A•ronomie du CNRS, Paris, France
Peter H. Haynes
DAMTP, Cambridge, UK
Jacques Vanneste
University of Edinburgh, Edinburgh, UK Claude Sidi*
Service d'A•ronomie du CNRS, Paris, France
Abstract. In the stratosphere, turbulence is confined within shallow, localised patches. The resulting vertical mixing of tracers is highly intermittent and difficult to quantify. Here a new technique is employed to estimate from high-resolution, lower stratospheric mid-latitude bal- loon data a well-defined vertical diffusivity associated with this mixing. The technique, which is based on a stochastic
model of the distribution of turbulent patches, emphasises
the dependence of the diffusivity on the typical patch life- time. Assuming a lifetime of a few hours, the diffusivity is
found to be in the range 0.01- 0.02m
2 s -•. This value is
an order of magnitude smaller than those previously derived from radar measurements. The potential of the technique for the analysis of ocean microstructure measurements is noted.
Introduction
Mixing at small scales potentially plays an important
part in determining the distribution of chemical species in
the stratosphere
[Edouard et al., 1996; Tan et al., 1998].
Accurate quantification of the mixing is therefore crucial for reliable modelling of stratospheric chemistry, including assessment of the effects of pollutants on the ozone distribu- tion. Much of the small-scale mixing is believed to occur in
patches of three-dimensional turbulence generated by local dynamical instabilities. Because of the strongly stable den-
sity stratification, the patches are localised in space and time and occupy a small volume fraction. The associated mixing is strongly intermittent and not strictly diffusive; however, its overall effects on the larger scale can be usefully charac-
terized by a vertical diffusivity K [Dewan, 1981; Vanneste
and Haynes,
2000]. (This follows
from the central-limit the-
orem, which, under mild assumptions, guarantees that the
mixing is diffusive in the long-time limit.)
Observational estimates of K for the lower stratosphere
have been obtained from turbulence characteristics deduced
* Deceased.
Copyright 2000 by the American Geophysical Union.
Paper number 2000GL011386.
0094-8276/00/2000GL011386505.00
from radar data and are typically in the range 0.2-0.6
m2s-X[Woodman
and Rastogi,
1984; Fukao et al., 1994;
Kurosaki et al., 1996; Nastrom and Eaton, 1997]. These es-
timates would, if correct, imply that the contribution of tur- bulence to the large-scale dispersive transport in the lower
stratosphere is as large, or indeed larger than, that resulting form the combined effect of the mean 'Brewer-Dobson' cir- culation and quasi-horizontal mixing by large-scale eddies. This combined effect may be approximately represented by
a vertical
diffusivity
of about
0.2 m2s
-x [Holton,
1986;
Plumb
and Ko, 1992; Sparling et al., 1997].
Data
Vertical profiles of temperature, horizontal and verti- cal velocities, and pressure, with a resolution of 1 meter, were collected over the south of France by balloon-borne in-
strumentation
during the RASCIBA campaign
(02/19/1990,
02/20/1990, 02/22/1990, 03/01/1990). A complete
discus-
sion of the measuring apparatus and associated techniques
has been given elsewhere
[Dalaudier et al., 1994; Alisse and
Sidi, 2000]. The measured
profiles range from the ground
up to roughly 23 km, but here we concentrate on their
stratospheric
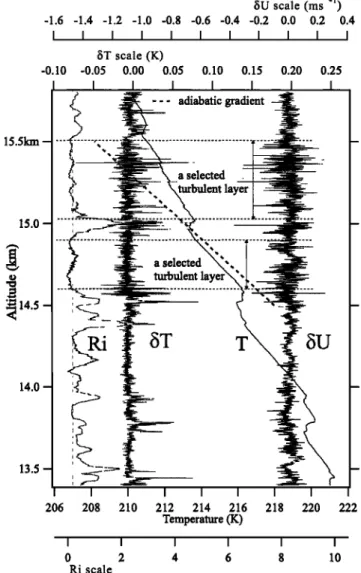
part (11-23 km). Figure 1 shows a typical
set of measured profiles. The vertical structure in the pro-
files of temperature and of small-scale velocities naturally allows the definition of layers. Providing that layers are thick enough to give sufficient statistical degrees of freedom,
it is possible to use detailed characteristics of the velocity
fluctuations to identify which layers are turbulent [Alisse
and Sidi, 2000]. All such layers are characterised
by nearly
isotropic
Kolmogorov
k -s/a velocity
spectra,
consistent
with
three-dimensional turbulence, and are associated with low
Richardson number (the squared ratio of the buoyancy fre-
quency and the vertical gradient of the horizontal velocity),
often under 0.25, indicating tendency to dynamical insta- bility. None of the turbulent layers identified in Figure 1, nor those selected from other profiles, show a temperature
gradient equal to the adiabatic lapse rate, i.e. the neutrally stratified temperature gradient that would be expected if
the layer was perfectly mixed. Other standard diagnostics used to analyse mixing in density stratified fluids show that 2621
2622
ALISSE
ET AL.: QUANTIFICATION
OF STRATOSPHERIC
MIXING
typical vertical particle displacements within the layers are considerably less than the layer thickness, confirming that mixing within the layers is imperfect. This is a clear in- dication that a conventional assumption of perfect mixing
within the layers [Dewan, 1981] is not justified.
In the six profiles available, several turbulent layers were
detected[Alisse
and $idi, 2000]. We have selected
for this
study only the 36 layers
showing
a clear k -•/3 available
potential energy spectrum and a nearly-constant vertical temperature gradient. The selected layers correspond to a height fraction F - 0.18. The potential energy spectrum allows a indirect estimate of the available potential energy
dissipation rate, ep, assuming the Corrsin-Obukhov spec-
tral law. Together with the buoyancy frequency N, which may be estimated from the temperature profile, this allows
calculation of the internal turbulent vertical diffusivity, Kp within each layer. (The subscript p labels the individual
layer.) Values
of Kp range
from 0.003 to 0.36 m2s
-1. An-
other important characteristic of each layer is its thickness
hp. Values of hp range from 90 to 480 m. There was no indication of a correlation between the two quantities Kp
and hp.
Estimation of the diffusivity
In order to calculate the vertical diffusivity K represent- ing the overall mixing effect of the turbulent patches it is necessary to take the properly defined average of the local vertical diffusivity. Since this is a rapidly varying function of space and time, large within turbulent patches and small outside them, the definition of the proper average is deli- cate. A detailed mathematical model is needed to ensure that the resulting K is an accurate representation of the
effect of the mixing on the large scale (most precisely the
dispersive
effect [Vanneste and Haynes, 2000]). Given the
observed characteristics of the turbulent layers, the model must not rely on any assumption of perfect mixing within the layers.
To formulate the required model we take a Lagrangian viewpoint and focus on the history of vertical displacements experienced by a particular fluid particle, which we describe as a random process known as a continuous time random
walk [Gatdiner, 1983]. We follow Dewan [Dewan, 1981] in
supposing that vertical mixing takes place only inside tur- bulent patches. At random times the particle encounters a turbulent patch and, as a net result, undergoes a random vertical displacement. The overall diffusivity is then given by
•2
K -
(1)
2Tm
where er
2 is the variance
of the particle displacements
re-
sulting from encounters with turbulent patches and r• is the average time between successive encounters.
A simple model of the effect of a patch encounter can be developed as follows. Each patch is characterized by a set of
3 parameters: hp, the thickness of the patch, Kp the diffusiv- ity (assumed constant) within the patch and rp the lifetime
of the patch. Such a model is, of course, very crude, in par- ticular because the characteristics of the turbulent patches evolve during their life cycle; it is however sufficient for our purpose, since the observations do not provide information on this evolution but can be expected to sample different stages of the life cycle randomly. The variance of the dis-
15.5kin - 15.0 - 14.0 - 13.5 -
fU scale
(ms
-1.6 -1.4 -1.2 -1.0 -0.8 -0.6 -0.4 -0.2 0.0 0.2 0.4 fit scale (K) -0.10 -0.05 0.00 0.05 0.10 0.15(.!i••
---
..
adiabatic
gradient
0.20 0.25 I I a selectedlaye•
a selected turbulent laye•'•7~
...
...:::=•
i i i 208 210 212T
5U
i i i i 206 214 216 218 220 222 Temperature (K) I I I I I I 0 2 4 6 8 10 Ri scaleFigure 1. Vertical profiles of first differences in horizontal ve-
locity and temperature, 8U and 8T respectively, observed from the balloon within the stratosphere. The differences are taken between observations separated by i meter in the vertical. Also shown are the vertical profiles of potential temperature and
Richardson number (the latter as a running 100 meter average).
Each of these quantities is used for the detection of turbulent lay- ers, two of which are indicated on the Figure. Note also that the potential temperature gradient within the layers is smaller than in
the surroundings, but always (except on the very smallest scales)
positive, indicating static stability and imperfect mixing.
placements resulting from an encounter with a patch with given parameters may be obtained from the solution of a
Brownian
motion with reflecting
boundary
conditions
[Gat-
diner,
1983]. The variance
er
2 is then derived
by averaging
over an ensemble of patches (weighting the average by hp totake account of the fact that if a patch with given charac- teristics exists, the probability of encounter is proportional
to the patch thickness). This leads to
•r = _ (1-½),
(2)
6hp
where
C ----
96 o• h3
p exp
[-(2n -1-
1)2•r2Kp•-p/hp
2]
ALISSE ET AL.' QUANTIFICATION OF STRATOSPHERIC MIXING 2623
satisfies
0 _< c <_ 1, and {.} de, ,tes the average
over all pos-
sible patches. c characterises thr •mperfection of the mixing that results from the finite diffusivity and finite lifetime of the patches. The limit c -• 0 corresponds to perfect mixing within the patches and was previously considered by Dewan
(1981) and Vanneste and Haynes (2000).
An expression for rm may be derived from knowledge of F, the volume fraction of the atmosphere that is turbulent
at any given time. A form of the result from queuing theory
known as Little's theorem[Papoulis,
1991] implies that
(3)
IraCombining
(1), (2) and (3) gives
finally
K •
_
(4)
12hprp
This expression, which can be regarded as an extension of
Dewan's result [Dewan, 1981], allows one to estimate the
overall diffusivity from observations of the distribution of height, diffusivity and lifetime of turbulent patches and from observations of F. In the next section it is applied to the data described in õ2.
Results
To derive the overall diffusivity K from (4), the factors
hprp and (1- c) in (4) need to be estimated;
this requires
some information on the distributions of the lifetimes of tur- bulent patches. Unfortunately, the balloon observations do not provide such information, and no direct alternative ob- servation seems available. We therefore assumed that the
0.100
0.010
0.001
lO 2
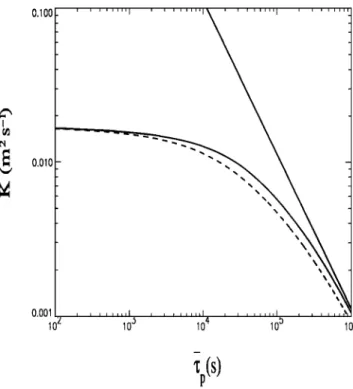
Figure 2. Global diffusivity K as a function of •p, the average lifetime of turbulent patches. Results obtained for a deterministic
distribution of the lifetime (solid curve) and for a Poisson distri- bution (dashed curve) are displayed. The straight line indicates
the global diffusivity in the perfect-mixing limit.
lifetime rp is independent of hp and Kp and has a sim-
ple probability distribution depending on a single param-
eter fp, the average lifetime. Figure 2 shows K as a func- tion of fp for two distributions: a deterministic distribution
with probability density p(rp) - 5(rp- •p) (solid curve,
5 is the Dirac function), and a Poisson distribution with
p(rp) -- exp(-rp/fp)/fp (dashed curve). The small differ-
ence between the curves obtained for each distribution sug-
gests that, for stratospheric parameters, the estimate of K is not very sensitive to the lifetime distribution.
The maximum estimate of K is about 0.02 m2s -•. This is
valid
if fp is small,
when
the numerator
cr
•' in (1) is small,
but
so is the denominator
r,• deduced
from (3) under the con-
straint of the observed F. As the assumed average lifetime
•p increases
cr
•' increases
to its maximum
value consistent
with perfect mixing, but r,• continues to increase accord-
ing to (3), eventually
giving K .;•.versely
proportional
to fp.
Physically, the decrease of K with fp appears because for large fp fluid particles are confined for long times in a given
turbulent patch and thus experience only small vertical ex- cursions. This effect demonstrates the key role played by the intermittency of the distribution of turbulent patches in
determining K. For plausible values of •p of a few hours,
the estimate for K is between 0.01 and 0.02 m •' s -•. Previous estimates for K have either been based on radar
observations
of turbulence [Woodman and Rastogi, 1984;
Fukao et al., 1994; Kurosaki et al., 1996; Nastrom and Eaton,
1997] or on high-resolution
aircraft observations
of chemical
tracers [Waugh
et al., 1997; Balluch and Haynes, 1997]. In
the latter there is no direct observation of the turbulence, but instead the assumption is made that the observed spatial variation of the chemical tracer arises from a combination of stirring by large-scale winds and the mixing effects of the turbulence. Our estimate for K is one of magnitude smaller than those made from the radar observations, but consistent with those made from the tracer observations. Our estimate also implies that in the lower stratosphere the contribution of turbulence to vertical dispersive transport is small rela- tive to the contribution from the combined effect of the mean 'Brewer-Dobson' circulation and quasi-horizontal mixing by large-scale eddies. On the other hand, it is much larger than
the molecular
diffusivity
(which
is of order 10-4m•'s-•in
the
lower stratosphere),
lending support to the idea that the tur-
bulence plays a significant role in vertical mixing. Of course, our estimate for K should be taken with caution, since it is based on a small data set which might not be representative of turbulent-patch activity in the whole lower stratosphere. It will be interesting to extend our techique to data obtained in different geographical regions.
Concluding remarks
The new approach presented here allows the derivation of a well-defined overall vertical diffusivity K from microstruc- ture measurements while accounting both for the spatial heterogeneity and for the temporal intermittency of strato- spheric turbulence. The results highlight the importance of the statistics of the patch lifetimes in determining the diffu- sivity. Such statistics are difficult to obtain, notably because of their Lagrangian nature, and dedicated experiments will be necessary if more accurate estimates are to be derived. The many similarities between stratospheric turbulence and turbulence in the ocean interior suggest that our approach
2624 ALISSE ET AL.: QUANTIFICATION OF STRATOSPHERIC MIXING
could be fruitfully applied to oceanic microstructure mea- surements. In that context, accurate estimates of overall
diffusivity are essential to quantify overall diapycnal fluxes
of heat, salinity and chemical
species
[Polzin et al., 1997].
Acknowledgments. This work was initiated during a visit of J.-R. A. to Cambridge, funded by a European Science Foundation exchange grant (TAO/9810). J. V. was funded by the
European Commission through grant FMBICT972004. P.H.H.'s
research is supported by the European Commission, the UK Nat- ural Environment Research Council (in part through the UK Universities Global Atmospheric Modelling Programme) and the Newton Trust.
References
Alisse, J.-R., and Sidi, C., Experimental probability density func-
tions in the stably stratified atmosphere, J. Fluid Mech., •0œ,
137-162, 2000.
Balluch, M., and P. H. Haynes, Quantification of lower strato- spheric mixing processes using aircraft data, J. Geophys. Res., 102, 23487-23504, 1997.
Dalaudier, F., C. Sidi, M. Crochet, and J. Vernin, Direct evidence
of'sheets' in the atmospheric temperature field, J. Atmos. Sci.,
51, 237-248, 1994.
Dewan, E. M., Turbulent vertical transport due to thin intermit- tent mixing layers in the stratosphere and other stable fluids, Science, 211, 1041-1042, 1981.
Edouard, S., B. Legras, F. Lef•vre, and R. Eymard, The effect of mixing on ozone depletion in the Arctic, Nature, 38.•, 444-447,
1996.
Fukao, S., M.D. Yamanaka, N. Ao, W. Hocking, T. Sato, M. Ya- mamoto, T. Nakamura, T. Tsuda, and S. Kato, Seasonal vari- ability of vertical eddy diffusivity in the middle atmosphere. 1. Three-year observations by the middle and upper atmosphere radar, J. Geophys. Res., D99, 18973-18987, 1994.
Gardiner, C. W. Handbook of stochastic methods for physics,
chemistry and the natural sciences, 442 pp., Springer, Berlin,
1983.
Holton, J. R., A dynamically based transport parametrization
for one-dimensional phtochemical models of the stratosphere,
J. Geophys. Res., D91, 2681-2686, 1986.
Kurosaki, S., M.D. Yamamata, H. Hashiguchi, T. Sato, and S. Fukao, Vertical eddy diffusivity in the lower and middle at- mosphere: a climatology based on the MU radar observations
during 1986-1992, J. Atmos. Solar-Terr. Phys., 58, 727-734,
1996.
-Nastrom, G. D., and F. D. Eaton, A brief climatology of eddy diffusivities over White Sands Missile Range, New Mexico, J.
Geophys. Res., D10œ, 29819-29826, 1997.
Papoulis, A. Probability, random variables, and stochastic pro-
cesses, 624 pp., McGraw-Hill, New-York, 1991.
Plumb, R. A., and M. K. W. Ko, Interrelationships between mix- ing ratios of long-lived stratospheric constituents, J. Geophys.
Res., D97, 10145-10156, 1992.
Polzin, K. I., J. M. Toole, J. R. Ledwell, and R. W. Schmitt, Variability of turbulent mixing in the abyssal ocean, Science,
276, 93-96, 1997.
Sparling, L. C., J. A. Kettleborough, P. H. Haynes, M. E. Mcin- tyre, J. E. Rosenfield, M. R. Schoeberl, and P. A. Newman, Diabatic cross-isentropic dispersion in the lower stratosphere,
J. Geophys. Res., D10œ, 25817-25829, 1997.
Tan, D. G. H., P.H. Haynes, A. R. MacKenzie, and J. A. Pyle,
The effects of fluid-dynamical stirring and mixing in the de-
activation of stratospheric chlorine, J. Geophys. Res., D103, 1585-1605, 1998.
Vanneste, J., and P. H. Haynes, Intermittent mixing in strongly stratified fluids as a random walk, J. Fluid Mech., 411, 165- 185, 2000.
Waugh, D. W. etal,Mixing of polar vortex air into middle lat-
itudes as revealed by tracer-tracer scatterplots, J. Geophys.
Res., 102, 13119-13134, 1997.
Woodman, R. F., and P. K. Rastogi, Evaluation of effective eddy
diffusive coefficients using radar observations of turbulence in the stratosphere, Geophys. Res. Left., 11, 243-246, 1984.
J.-R. Alisse and C. Sidi, Service d'A•ronomie du CNRS, Uni- versit• Paris 6, Tour 15, 4 place Jussieu-Bo•te 102, 75252 Paris Cedex 05, France. (email: [email protected])
P.H.Haynes, Centre for Atmospheric Science, Department of Applied Mathematics and Theoretical Physics, University of Cambridge, Silver Street, Cambridge CB3 9EW, UK. (email: phh @damtp.cam.ac. uk)
J. Vanneste, Dept of Mathematics and Statistics, University of
Edinburgh, King's Buildings, Edinburgh EH9 3JZ, UK. (email: vannest e @ m at hs. ed. ac. uk)
(Received January 21, 2000; revised June 15, 2000; accepted June 21, 2000.)