HAL Id: hal-02965976
https://hal.sorbonne-universite.fr/hal-02965976
Submitted on 13 Oct 2020
HAL is a multi-disciplinary open access
archive for the deposit and dissemination of
sci-entific research documents, whether they are
pub-lished or not. The documents may come from
teaching and research institutions in France or
abroad, or from public or private research centers.
L’archive ouverte pluridisciplinaire HAL, est
destinée au dépôt et à la diffusion de documents
scientifiques de niveau recherche, publiés ou non,
émanant des établissements d’enseignement et de
recherche français ou étrangers, des laboratoires
publics ou privés.
Kedr mud volcano (southern Lake Baikal)
Akihiro Hachikubo, Hirotsugu Minami, Satoshi Yamashita, Andrey Khabuev,
Alexey Krylov, Gennadiy Kalmychkov, Jeffrey Poort, Marc de Batist,
Alexandr Chenskiy, Andrey Manakov, et al.
To cite this version:
Akihiro Hachikubo, Hirotsugu Minami, Satoshi Yamashita, Andrey Khabuev, Alexey Krylov, et al..
Characteristics of hydrate-bound gas retrieved at the Kedr mud volcano (southern Lake Baikal).
Scientific Reports, Nature Publishing Group, 2020, 10, pp.14747. �10.1038/s41598-020-71410-2�.
�hal-02965976�
www.nature.com/scientificreports
characteristics of hydrate‑bound
gas retrieved at the Kedr mud
volcano (southern Lake Baikal)
Akihiro Hachikubo
1*, Hirotsugu Minami
1, Satoshi Yamashita
1, Andrey Khabuev
2,
Alexey Krylov
2,3,4, Gennadiy Kalmychkov
5, Jeffrey Poort
6, Marc De Batist
7,
Alexandr chenskiy
8, Andrey Manakov
9& oleg Khlystov
2We reported the characteristics of hydrate‑bound hydrocarbons in lake‑bottom sediments at the Kedr mud volcano in Lake Baikal. twenty hydrate‑bearing sediment cores were retrieved, and methane‑ stable isotopes of hydrate-bound gases (δ13C and δ2H of − 47.8‰ to − 44.0‰ V-PDB and − 280.5‰
to − 272.8‰ V-SMOW, respectively) indicated their thermogenic origin accompanied with secondary microbial methane. Powder X-ray diffraction patterns of the crystals and molecular composition of the hydrate‑bound gases suggested that structure ii crystals showed a high concentration of ethane (around 14% of hydrate-bound hydrocarbons), whereas structure I crystals showed a relatively low concentration of ethane (2–5% of hydrate-bound hydrocarbons). These different crystallographic structures comprised complicated layers in the sub‑lacustrine sediment, suggesting that the gas hydrates partly dissociate, concentrate ethane and form structure ii crystals. We concluded that a high concentration of thermogenic ethane primarily controls the crystallographic structure of gas hydrates and that propane, iso-butane (2-methylpropane) and neopentane (2,2-dimethylpropane) are encaged into crystals in the re‑crystallisation process.
Gas hydrates are crystalline clathrate compounds composed of water and gas molecules that are stable at low temperature and high partial pressure of each gas component1. Natural gas hydrates, which contain methane (C1) as a major component, exist in sea/lake sediment columns and permafrost layers and are considered to be
a possible global source of energy2,3. There are different views on the role of gas hydrates on global warming4–6. They are of concern as a large reservoir of C1; however, the amount of hydrate-bound gas is smaller than that
expected previously, which makes them unlikely to cause global warming by dissociation of C15,6. Moreover,
the current understanding of the formation, dissociation and maintenance processes of natural gas hydrates is still incomplete.
Molecular fractionation during formation of gas hydrate crystals occurs according to the size ratio of guest molecules to host cages and the difference in equilibrium pressure of each component of hydrocarbons. Milkov et al.7 reported that gas hydrates retrieved at the southern Hydrate Ridge (offshore Oregon) are rich in ethane (C2) but exclude propane (C3), because the crystal structure I (sI) cannot encage C3. Sassen et al.8 studied the gas
hydrates retrieved at the Gulf of Mexico and found that they are high in C2, C3 and butane (C4) but exclude
iso-pentane (i-C5, 2-methylbutane), because the crystal structure II (sII) cannot encage such large guest molecules.
Therefore, molecular composition of natural gas primarily controls the crystallographic structure of gas hydrates. Natural gas hydrates have been discovered in sub-lacustrine sediments in Lake Baikal, in association with fluid venting at mud volcanoes, pockmarks and cold seeps9,10. Although the Lake Baikal gas hydrates generally belong to sI, higher concentrations of C2 locally induce the formation of sII as sII gas hydrates form for a
particu-lar composition of C1 and C211,12. Co-existence of sI and sII hydrates in the same sediment core, retrieved at the
open
1Kitami Institute of Technology, 165 Koen-cho, Kitami 090-8507, Japan. 2Limnological Institute, SB RAS, 3
Ulan-Batorskaya St, Irkutsk, Russia 664033. 3Institute of Earth Sciences, St. Petersburg State University, 7-9,
Universitetskaya Nab., St. Petersburg, Russia 199034. 4VNIIOkeangeologia, Anglyisky prospect 1, St. Petersburg,
Russia 190121. 5Vinogradov Institute of Geochemistry, SB RAS, 1-a Favorsky St, Irkutsk, Russia 664033. 6Sorbonne
Université, CNRS, Institut des Sciences de la Terre de Paris, ISTeP, 4 place Jussieu, 75005 Paris, France. 7Renard
Centre of Marine Geology, Ghent University, Krijgslaan 281 s8, 9000 Ghent, Belgium. 8Irkutsk National Research
Technical University, 83 Lemontov St, Irkutsk, Russia 664074. 9Nikolaev Institute of Inorganic Chemistry, SB RAS, 3
Kukuy K-2 mud volcano (MV) in the central Baikal basin (Fig. 1), was reported by Kida et al.13,14. Some formation models for these ‘double structure’ gas hydrates were proposed by Hachikubo et al.15, Poort et al.16 and Manakov et al.17. The hypothesis shared by the latter two papers is that the sII hydrates are formed by re-crystallisation after dissociation of pre-existing sI hydrates. Because C2 is prone to be encaged in the hydrate phase rather than
C1, C2 can be concentrated into the hydrate during the re-crystallisation process with C2-rich sII forming18.
C2-rich sII gas hydrates (C2 concentration ca. 14% of volatile hydrocarbons) have been discovered not only
at the Kukuy K-2 MV but also at the Kukuy K-4 MV and the Kukuy K-10 gas hydrate mound, located in the central Baikal basin, and at the PosolBank seep, located in the southern Baikal basin (Fig. 1)9,19. Recently, double-structure gas hydrates were also recovered at the Kedr MV, located in the southern Baikal basin, between 2015 and 201710,20. This study focused on the characteristics of molecular and stable isotope compositions of hydrate-bound hydrocarbons retrieved at the Kedr MV area to improve our understanding of the formation process of double-structure gas hydrates.
The Kedr MV is located in the southern Baikal basin, at 27 km south of Listvyanka (Fig. 1), and it was sepa-rated into two study areas: a complex of mud-volcanic buildings (Kedr-1 area), where mud-volcanic breccia was found20, and a separate hill with gas hydrate in sediment (Kedr-2 area). Multi-beam echosounder data obtained in 2015 revealed that the Kedr MV consists of small mounds and pockmarks, and results of pore water geochem-istry suggested the existence of fluid discharge from greater depths20. This part of Lake Baikal is known for the presence of the coal-bearing sediments of the Tankhoy Formation, Oligocene–Miocene age21,22. These deposits would represent an ideal source for upward migrating gas that could lead to the formation of gas hydrates near the lake floor20,22. During expeditions onboard R/V G. Yu. Vereshchagin (VER) in 2015–2017, 42 sediment cores, including 20 hydrate-bearing cores, were sampled at the Kedr MV: samples were taken in August–September 2015 (VER15-03), August 2016 (VER16-03) and August 2017 (VER17-03). Sediment cores were retrieved using gravity corer (length 3.5 or 6.1 m). Coring targets were mainly small mounds and pockmarks, along with five peripheral locations (2016St21, 2016St22, 2016St25, 2016St26 and 2016St27) as references.
Figure 1. Bathymetry map of the Kedr mud volcano (MV) at the southern basin of Lake Baikal. The blue, red,
green and white points indicate structure I only, structure II only, both structures I and II and no gas hydrate, respectively. This map was created using Kashmir 3D, Version 9.3.1 (https ://www.kashm ir3d.com/).
www.nature.com/scientificreports/
Results
Gas hydrate crystals.
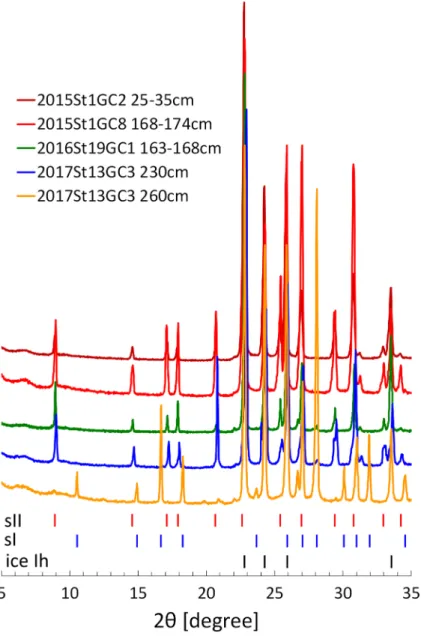
Gas hydrate crystals in the sediment cores displayed massive, granular, plate-like or vein-like inclusions in the sediments (Fig. 2). Several hydrate-bearing sediment cores had solid granules, sug-gesting the presence of sII crystals17. PXRD profiles of the gas hydrate samples agreed with the crystal shapes (Fig. 3): the granular shape of 2015St1GC2 and the upper layer of 2017St13GC3 (230 cm below lake floor, cmblf) corresponded to sII, whereas plate-like crystals of the lower layer of 2017St13GC3 (260 cmblf) corresponded to sI. Massive crystals of 2015St1GC8, accompanied with granules, corresponded to sII. All samples included ice Ih in the PXRD profiles, caused by partial dissociation of gas hydrates during the retrieval of the cores and handling onboard.Molecular and isotopic compositions of hydrate‑bound hydrocarbons.
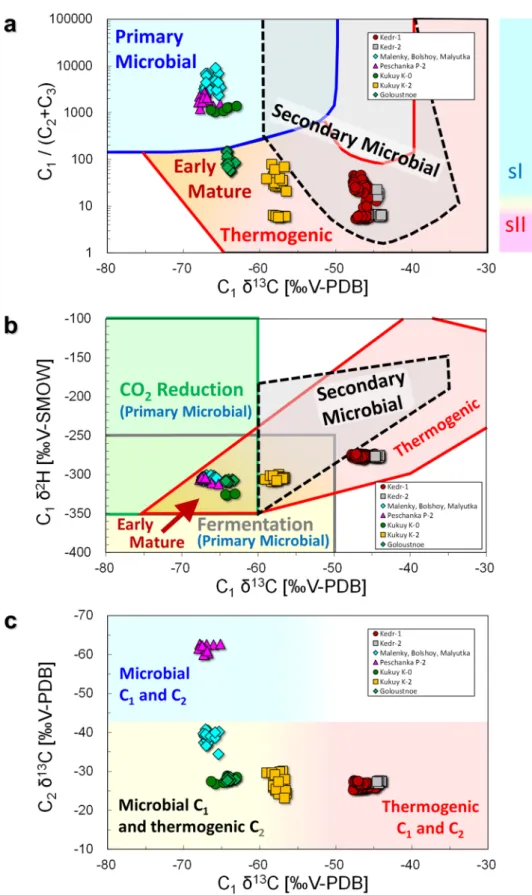
Figure 4 shows the rela-tionship between molecular and isotopic compositions of hydrate- bound hydrocarbons for the different sample sites in Lake Baikal. We obtained 84 samples of hydrate-bound gases from the Kedr-1 area and 12 from the Kedr-2 area. Molecular and isotopic compositions of the hydrocarbons in the hydrate-bound gases are listed in the Supplementary Information and are summarised in Table 1. C1 was the main component of thehydrate-bound hydrocarbons, whereas C2 was the second component. C2 proportions in the hydrocarbons were 2.1–15.6
vol% at Kedr-1 and 4.2–14.1 vol% at Kedr-2. C3 proportions were smaller than C2 and distributed over a wider
range at Kedr-1 (0.0003–0.3039 vol%) and Kedr-2 (0.0035–0.0349 vol%). Therefore, C1/(C2 + C3) in Fig. 4a is
mainly influenced by C1 and C2. C1/(C2 + C3) and C1 δ13C of the Kedr MV ranged from 5 to 47 and from − 47.8‰
to − 44.0‰, respectively. C1/(C2 + C3) of the Kukuy K-2 MV in the central Baikal basin are clearly separated
into two distinct groups responding to the gas hydrate structures: sI (21–80) and sII (~ 6)23. Conversely, there was no clear separation in C1/(C2 + C3) values for Kedr-1, suggesting that some gas hydrate samples contained
both sI and sII. The relationship between δ13C and δ2H of C
1 is shown in Fig. 4b. C1 δ2H of the Kedr MV was
Figure 2. Gas hydrates in sediment cores recovered from the Kedr-1 and Kedr-2 areas. Upward core direction
is toward the left in each. (a) 2015St1GC2 (Kedr-1, structure II), (b) 2015St1GC8 (Kedr-1, structure II), (c) 2015St1GC11 (Kedr-1, structure I), (d) 2015St1GC19 (Kedr-1, structure I) and € 2017St13GC3 (Kedr-2, upper layer: structure II, lower layer: structure I).
between − 280.5‰ and − 272.8‰, and these values were ~ 30‰ higher than those from other gas hydrate sites. Figure 4c shows an L-shaped distribution between C1 δ13C and C2 δ13C in the hydrate-bound gas at Lake
Bai-kal. C2 δ13C of the Kedr MV ranged from − 27.8‰ to − 25.3‰ and the values were almost the same as Kukuy
K-0, Kukuy K-2 and Goloustnoe. Iso-butane (i-C4, 2-methylpropane), n-butane (n-C4), neopentane (neo-C5,
2,2-dimethylpropane) and i-C5 were detected in the hydrate-bound hydrocarbons (Table 1); however, the
con-centration of n-pentane (n-C5) was under the detection limit of our gas chromatograph. The compositions of C3,
i-C4 and neo-C5 detected in the hydrate-bound gases of the sI were smaller than those of sII.
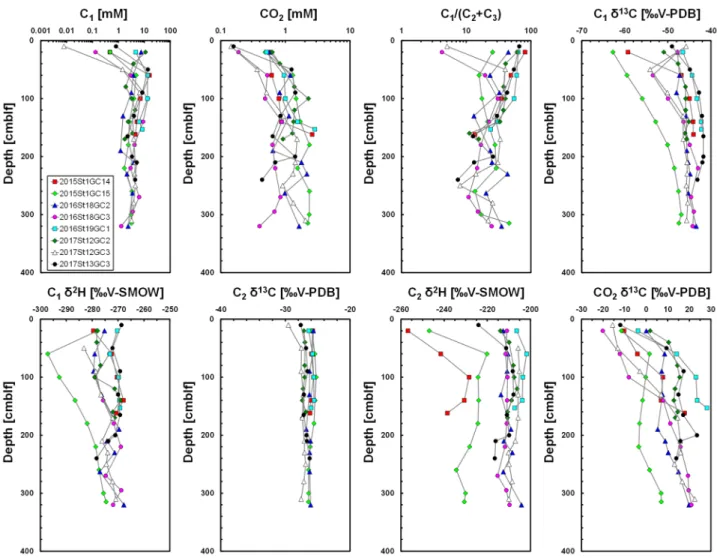
Molecular and isotopic compositions of sediment gases.
Figure 5 shows the selected depth profiles of sediment gas in the hydrate-bearing cores obtained using headspace gas method (all data are shown in the Supplementary Information). C1 concentrations of the all sediment cores increased with depth and reached1–10 mM at a depth of around 50 cm below lake floor (cmblf). The CO2 concentrations of all cores increased
slightly with depth. The value of C1/(C2 + C3) generally decreased with depth. Because C3 concentrations in the
sediment gases were three orders of magnitude smaller than C2 concentrations (average concentrations of C2 and
C3 for all sediment gases are 146 μM and 0.13 μM, respectively), these results indicated that the Kedr MV area
with gas hydrates is characterised by a high C2 concentration.
C1 δ13C of all cores increased with depth; however, it also increased beneath the lake floor (10–20 cmblf)
in 2016St18GC3 and 2017St12GC3 cores, where C1 concentrations were low, suggesting oxidation of C1 and
Figure 3. Powder X-ray diffraction profiles of the gas hydrate samples. 2015St1GC2 (25–35 cmblf),
2015St1GC8 (168–174 cmblf), 2016St19GC1 (163–168 cmblf) and 2017St13GC3 (230 cmblf) belong to structure II, whereas 2017St13GC3 (260 cmblf) belongs to structure I. cmblf, centimetres below lake floor.
www.nature.com/scientificreports/
Figure 4. Diagrams of hydrate-bound gases. (a) C1/(C2 + C3) plotted against C1 δ13C, based on the classification
of Milkov and Etiope25; (b) δ13C of C
1 plotted against δ2H, based on the classification of Milkov and Etiope25;
and (c) δ13C of C
2 plotted against δ13C of C1, based on the classification of Milkov28. Malenky, Bolshoy,
consumption of light C1. C1 δ13C of Kedr-1 and Kedr-2 was around − 45‰ and − 42‰, respectively. C1 δ2H of
hydrate-bearing cores was between − 280‰ and − 270‰ although that of 2015St1GC15 was between − 300‰ and − 270‰. C2 δ13C of all cores was almost constant with depth and averaged at around − 26‰, suggesting
thermogenic C2. C2 δ2H of hydrate-bearing cores was at around − 210‰; however, that of some sediment cores
(2015St1GC14 and 2015St1GC15) was between − 240‰ and − 230‰ at their base. CO2 δ13C of all cores generally
increased with depth, reaching + 20‰ (Kedr-1) and + 30‰ (Kedr-2).
Discussion
origin of hydrate‑bound hydrocarbons.
A relationship between C1/(C2 + C3) and C1 δ13C has beenapplied to identify the sources of hydrocarbons in submarine seeps24. Recently, this diagram was revised based on a large dataset25. As shown in Fig. 4a, hydrate-bound hydrocarbons at the Kedr MV have thermogenic and/or secondary microbial origins, whereas those of other gas hydrate sites (Malenky, Bolshoy, Malyutka, Peschanka P-2, Kukuy K-0, Kukuy K-2 and Goloustnoe; Fig. 1) in Lake Baikal demonstrate microbial or early mature ther-mogenic origins. The hydrate-bound C1 from all locations except those at the Kedr MV were interpreted to be
of microbial origin via methyl-type fermentation23 according to Whiticar’s old diagram26; however, the revised diagram25 suggests early mature thermogenic gases (Fig. 4b). Those of the Kedr MV plot at the boundary of the thermogenic and secondary microbial origin zones. Low C1 and C2 δ13C at the Peschanka P-2 MV indicated that
C1 and C2 are of microbial origin27,28, whereas Kedr MV shows high C1 and C2 δ13C indicating their thermogenic
origin (Fig. 4c). At other sites, C1 and C2 δ13C suggested that gases are mainly of microbial origin (in terms of C1)
with some thermogenic component (13C rich and higher concentration in C 2).
Stable isotopes in hydrate-bound C1 at the Kedr-1 and Kedr-2 areas suggested its thermogenic origin.
How-ever, it is close to the field of secondary microbial C1 in Fig. 4b, and the data are plotted in the overlap between
the fields of thermogenic and secondary microbial in Fig. 4a. Milkov29 mentioned that secondary microbial C
1
is characterised by C1-rich dry gas, large C1 δ13C (between − 55‰ and − 35‰) and large CO2 δ13C (more than + 2
‰). Although hydrate-bound and sediment gases in the Kedr MV were not C1 rich and contained 3%–15% of
C2, C1 δ13C was around − 45‰, which agrees with the secondary microbial C1. Because some data of secondary
microbial gas are plotted outside the field on the original graph25, we could include the gas data in the category of secondary microbial C1 in Fig. 4b.
Figure 6 shows the relationship between C1 δ13C and CO2 δ13C in the sediment gas obtained using headspace
gas method. According to the genetic diagram25, gas hydrate cores are plotted at the zones of the thermogenic and secondary microbial origins, whereas the cores at the peripheral area are primary microbial. The headspace gas data of the hydrate-bearing cores in Fig. 6 seem to be plotted in the field of thermogenic gas (low CO2 δ13C),
but the effect of light CO2 produced by methane oxidation in the subsurface layer also decreased CO2 δ13C as
shown in Fig. 5. These results suggested that secondary microbial C1 mixes into thermogenic gas. Coal-bearing
sediments exist around the Kedr area21,22, and secondary microbial C
1 can also form from coal beds30.
Hydrate-bound C1 of secondary microbial origin has been only reported at the Alaska North Slope31. This study is another
case for it.
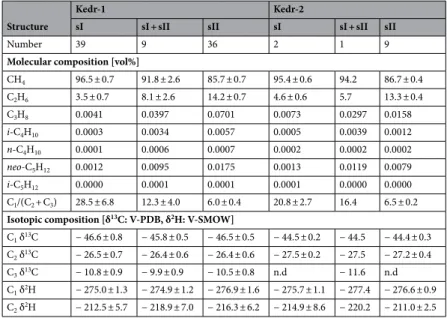
Table 1. Molecular and isotopic compositions of hydrate-bound hydrocarbons at the Kedr mud volcano
(MV). These data list mean values and standard deviations, sorted into three groups: sI, where C2 composition
was < 5%; sI + sII, where C2 composition was 5%–13%; and sII, where C2 composition was > 13%. n.d., not
determined. Structure
Kedr-1 Kedr-2
sI sI + sII sII sI sI + sII sII
Number 39 9 36 2 1 9
Molecular composition [vol%]
CH4 96.5 ± 0.7 91.8 ± 2.6 85.7 ± 0.7 95.4 ± 0.6 94.2 86.7 ± 0.4 C2H6 3.5 ± 0.7 8.1 ± 2.6 14.2 ± 0.7 4.6 ± 0.6 5.7 13.3 ± 0.4 C3H8 0.0041 0.0397 0.0701 0.0073 0.0297 0.0158 i-C4H10 0.0003 0.0034 0.0057 0.0005 0.0039 0.0012 n-C4H10 0.0001 0.0006 0.0007 0.0002 0.0002 0.0002 neo-C5H12 0.0012 0.0095 0.0175 0.0013 0.0119 0.0079 i-C5H12 0.0000 0.0001 0.0001 0.0001 0.0000 0.0000 C1/(C2 + C3) 28.5 ± 6.8 12.3 ± 4.0 6.0 ± 0.4 20.8 ± 2.7 16.4 6.5 ± 0.2
Isotopic composition [δ13C: V-PDB, δ2H: V-SMOW]
C1 δ13C − 46.6 ± 0.8 − 45.8 ± 0.5 − 46.5 ± 0.5 − 44.5 ± 0.2 − 44.5 − 44.4 ± 0.3
C2 δ13C − 26.5 ± 0.7 − 26.4 ± 0.6 − 26.4 ± 0.6 − 27.5 ± 0.2 − 27.5 − 27.2 ± 0.4
C3 δ13C − 10.8 ± 0.9 − 9.9 ± 0.9 − 10.5 ± 0.8 n.d − 11.6 n.d
C1 δ2H − 275.0 ± 1.3 − 274.9 ± 1.2 − 276.9 ± 1.6 − 275.7 ± 1.1 − 277.4 − 276.6 ± 0.9
www.nature.com/scientificreports/
Figure 5. Depth profiles of C1 and CO2 concentrations, C1/(C2 + C3) values, C1 δ13C, C1 δ2H, C2 δ13C, C2 δ2H
and CO2 δ13C in the headspace gas. cmblf, centimetres below lake floor.
Figure 6. A diagram of headspace gases. CO2 δ13C plotted against C1 δ13C, based on the classification of Milkov
formation process of the sii gas hydrates.
As stated before, the crystallographic structure of gas hydrates at the Kedr MV is mainly due to the composition of thermogenic C2 in the volatile hydrocarbons.The concentration of C3, which is one of the sII-forming components, was two to three orders of magnitude
smaller than that of C2, because biodegradation occurs and this preferentially reduces C3−5 of n-alkanes19,32, 33.
The concentration of n-C4 was smaller than that of i-C4, whereas that of n-C5 was not detected (Table 1). C3 δ13C
was around − 10‰, suggesting that light C3 is consumed by microbial activity. Assuming that sediment gas C3+
can be ignored, sediment gas ratio C1/C2 at the study area was 30 ± 17 (mean and standard deviation), and the
concentration of C2 was ~ 3%. Such a composition of thermogenic gas is, therefore, considered to be supplied
from a deep sediment layer, forming sI gas hydrates composed of mainly C1 and C211,12 in the lake floor sediment.
In the cases where sI gas hydrates plug and block migration pathways, upward fluid flow becomes more focused in other areas16. Once gas supply stops locally, gas hydrates begin to decompose, with the gas dissolving into gas–poor sediment pore water. In the system of C1 and C2, C2 is prone to be encaged in gas hydrate and
decreases the equilibrium pressure of mixed-gas hydrate. Therefore, C2-rich gas hydrate forms in parallel with
the decomposition of sI gas hydrate. The Colorado School of Mines Hydrate (CSMHYD) program34 showed that C2-rich sII gas hydrate (C2 concentration 17%) forms from mixed gas composed of C1 and C2 (C2 concentration
3%). The C2 concentration of hydrate-bound gas at the Kedr MV was ~ 14%, agreeing fairly well with the results
of the CSMHYD program. Such secondary generation of gas hydrates can produce compositions and crystal-lographic structures that are different from the original crystals. A calorimetric study of synthetic C1 and C2
mixed-gas hydrate revealed that double peaks of heat flow correspond to the dissociation process of C1 and C2
mixed-gas hydrate, suggesting that C2-rich gas hydrate forms simultaneously from dissociated gas and showed
that the second heat flow peak correspond to the dissociation of C2-rich gas hydrate18. The PXRD and solid-state 13C nuclear magnetic resonance techniques demonstrated that C
2-rich sI gas hydrate forms in the dissociation
process of C1 + C2 sII gas hydrate35.
Among twenty hydrate-bound cores in the Kedr area, four cores contained sI only, seven cores had sII only, and seven cores showed sII at the upper layer and sI at the lower layer, as observed at the Kukuy K-2 MV13,16,17. Furthermore, in the cores 2015St1GC15 and 2016St18GC2, gas hydrate structure had sI at the upper and lower layer, and sII at the middle layer. These results suggested that complex gas hydrate layers are composed of sI and sII in subsurface sediments as shown in the schematic illustration in Poort et al.16.
Depth profiles of C2 δ2H of gas hydrate cores from the Kedr MV are shown in Fig. 7. C2 δ2H of hydrate-bound
gases varied between − 227‰ and − 206‰, with a grouping around − 210‰. C2 δ2H of sediment gases was also
around − 210‰, indicating that C2 δ2H of the original thermogenic gas is − 210‰. As stated above, C2 δ2H of
some cores showed low values at their base. Based on the isotopic fractionation of hydrogen in C2 during the
formation of sI C2 hydrate36, δ2H of hydrate-bound C2 was 1.1‰ lower than that of residual C2. However, this is
www.nature.com/scientificreports/
too small to explain the wide distribution in C2 δ2H shown in Fig. 7. On the other hand, Matsuda et al.37 reported
that isotopic fractionation of hydrogen in C2 is dependent on the crystallographic structure: 1‰–2‰ for sI
and ~ 10‰ for sII. Gas hydrates plotting around − 220‰ in C2 δ2H can be explained as a secondary generation
of sII from dissociated gas hydrates, of which C2 δ2H was around − 210‰. However, some sII samples showed
high C2 δ2H (around − 210‰), whereas some sI samples showed low C2 δ2H (around − 220‰). These results
indicated that formation and dissociation processes of gas hydrates produce complicated isotopic profiles in C2
δ2H under non-equilibrium conditions.
characteristics of hydrate‑bound gases in sii.
C3, i-C4, n-C4 and neo-C5 can be encaged in the largerhexadecahedral cages of sII1. n-C
4 and neo-C5 can be encaged using a help gas (e.g. C1) to fill in the smaller
dodecahedral cages of sII, because they cannot form pure n-C4 and neo-C5 hydrates, respectively. Figure 8 shows
the concentration of C3, i-C4, n-C4, neo-C5 and i-C5 plotted against C2 concentration. The figure illustrates a clear
division between sI (3–4%) and sII (14%) C2 concentrations. Data points between C2 concentrations of 5% and
13% were considered to have a mixture of sI and sII. Concentrations of C3, i-C4, n-C4 and neo-C5 had a positive
correlation with the concentration of C2, and these concentrations in sII were 1 or 2 orders of magnitude larger
than those in sI, suggesting that C3, i-C4, n-C4 and neo-C5 are encaged with C2 in the sII formation process.
C3 values of 0.001%–0.01%, ~ 0.0001% of n-C4, and 0.0001%–0.01% of neo-C5 were also detected in sI
hydrate-bound gas (Fig. 8), despite these hydrocarbons being unable to be encaged in sI. This can be explained by gases being adsorbed with sediments and gas hydrate crystals, which are then trapped in the grain boundary of polycrystalline gas hydrate crystals, and the gases are encaged if a small amount of sII crystals are present. For example, Uchida et al.38 examined natural gas hydrate retrieved at the Mackenzie Delta (onshore Canada) and detected C3 encaged in sII using Raman spectroscopy, although PXRD results suggested that the sample was sI
and the major component of hydrate-bound gas was C1 (more than 99%).
neo-C5 is considered to form from the decomposition of gem-dimethylcycloalkanes derived from the terpenes
of terrestrial organic matter39. It is easily enriched by preferential diffusion due to the nearly spherical molecules and its diffusion coefficient, which is higher than that of less branched isomers40. The sII hydrates retrieved at the Kukuy K-2 MV (central Baikal basin) contained 0.026–0.064% of neo-C5 in the volatile hydrocarbons13,14, and
those at the Kedr MV had a maximum value of 0.054% of neo-C5 (Supplementary Information Table S1). On the
contrary, in the case of natural gas hydrates retrieved at the Joetsu Basin (Japan Sea), neo-C5 was excluded and
remained in sediment during the formation of sI gas hydrates from C-rich gas41. The molecular size of i-C is
considerably large to be encaged in the large cages of sII. Maximum concentration of i-C5 in the hydrate-bound
gases was in several parts per million in both the fields of sI and sII (Fig. 8), indicating that i-C5 is not a
hydrate-bound hydrocarbon and adsorbed with gas hydrate crystals and/or trapped in their grain hydrate-boundary.
conclusion
We reported the molecular and stable isotope compositions of hydrate-bound and sediment gases at the Kedr MV in the southern Baikal basin. The empirical classifications of the molecular and isotopic compositions of hydrate-bound hydrocarbons showed that the gas source is mainly thermogenic, one of the end members of hydrate-bound gases in Lake Baikal. Large CO2 δ13C in the sediment gases suggested that secondary microbial
C1 mixes with thermogenic gas. Double-structure gas hydrates composed of sI and sII were observed, likely
created by sI crystals partly dissociating and C2-rich sII crystals forming. The C2 δ2H values of hydrate-bound
gas revealed that light C2 is preferentially encaged into sII crystals; however, some exceptions indicated that
more complicated processes of gas exchange might exist between sI, sII and the dissolved gas in pore water. Because C2 is preferentially concentrated into the gas hydrate phase, high concentration of thermogenic C2
produce sII crystals with C1, and C2 is encaged into the large cages of sII with C3, i-C4, n-C4, and neo-C5 in the
re-crystallisation process.
Methods
Gas hydrate crystals were collected onboard R/V G. Yu. Vereshchagin and stored in liquid nitrogen. Powder X-ray diffraction (PXRD) measurements were performed to check the crystallographic structure. Samples for PXRD were finely ground at a temperature of 77 K and then kept at 173 K. The X-ray diffraction patterns were recorded at 2θ = 5 − 35° using Cu Kα radiation (λ = 1.5418 Å) and a Bruker D8 Advance diffractometer equipped with a TTK 450 Anton Paar temperature controlling device. The positions of diffraction peaks corresponding to sI and sII hydrates and hexagonal ice (Ih) were calculated with the use of reference data on space group and unit cell parameters of the respective compounds42.
Hydrate-bound gases were collected using water displacement method and stored in 5 mL glass vials sealed with butyl septum stoppers. To avoid microbial alteration, 0.3 mL of preservative (50 wt% aqueous solution of benzalkonium chloride) was introduced into the vials. Gas sampling was conducted for each layer of gas hydrate in the hydrate-bearing cores. Several vials of samples were taken from a hydrate nodule. Sediment gases were collected using headspace gas method to calculate the depth profiles of each gas component in the sediment cores. To create a 5 mL headspace, 10 mL of sediment and 10 mL of saturated aqueous solution of NaCl were introduced into 25 mL-glass vials. The headspace was flushed with helium, the carrier gas used in the gas chromatography, to reduce air contamination43. The headspace gases were then placed into the 5 mL glass vials to separate them from sediment particles or water and to prevent any microbial activity during storage.
The molecular compositions of the hydrocarbons (from C1 to C5) were determined using a gas chromatograph
(GC-2014, Shimadzu, Kyoto, Japan) equipped with a packed column (Shimadzu Sunpak-S; length 2 m, inner diameter [ID] 3 mm), along with a thermal conductivity detector and flame ionisation detector for detecting high and low concentrations of hydrocarbons respectively. The two detectors were connected in series. The detection limit was 0.5 ppmv (C1–C3) and 5 ppmv (C4–C5). The analytical error estimated by multiple injections of standard
gases was < 1.2% for each gas component. Stable carbon and hydrogen isotopic ratios of the hydrocarbons and CO2 were measured using a continuous-flow isotope-ratio mass spectrometer (CF-IRMS, DELTA V, Thermo
Fisher Scientific, Waltham, MA, USA) coupled with a gas chromatograph (TRACE GC Ultra, Thermo Fisher Scientific). The gas chromatograph was equipped with a Carboxen-1006 PLOT capillary column (length 30 m, ID 0.32 mm, film thickness 15 μm, Sigma-Aldrich, St. Louis, MO, USA). In the case of samples with low C1
concentration, a Sigma-Aldrich Carboxen-1010 PLOT capillary column (length 30 m, ID 0.32 mm, film thick-ness 15 μm) was also used to separate air components from C1. Stable isotope compositions were reported as δ
values (in per-mille):
where R denotes the 13C/12C or 2H/1H ratio. δ13C and δ2H are given with reference to the V-PDB and V-SMOW
standards, respectively, determined using NIST RM8544 (NBS19) for δ13C and NIST RM8561 (NGS3) for δ2H.
The analytical precision was 0.3‰ for hydrocarbon (C1–C3) δ13C and 1‰ for δ2H.
Data availability
All the gas data are reported in the Supplementary Information.
Received: 16 April 2020; Accepted: 12 August 2020
References
1. Sloan, E. D. & Koh, C. A. Clathrate hydrates of natural gases (CRC Press, Boca Raton, FL, 2008).
2. Makogon, Y. F., Holditch, S. A. & Makogon, T. Y. Natural gas-hydrates—a potential energy source for the 21st Century. J. Pet. Sci.
Eng. 56, 14–31. https ://doi.org/10.1016/j.petro l.2005.10.009 (2007).
3. Boswell, R. & Collett, T. S. Current perspectives on gas hydrate resources. Energy Environ. Sci. 4, 1206–1215. https ://doi. org/10.1039/C0EE0 0203H (2011).
4. Kennedy, M., Mrofka, D. & von der Borch, C. Snowball Earth termination by destabilization of equatorial permafrost methane clathrate. Nature 453, 642–645. https ://doi.org/10.1038/natur e0696 1 (2008).
(1) δ[‰] = R sample−Rstandard Rstandard × 1000
www.nature.com/scientificreports/
5. Milkov, A. V. Global estimates of hydrate-bound gas in marine sediments: how much is really out there?. Earth Sci. Rev. 66, 183–197.
https ://doi.org/10.1016/j.earsc irev.2003.11.002 (2004).
6. Milkov, A. V. & Sassen, R. Two-dimensional modeling of gas hydrate decomposition in the northwestern Gulf of Mexico: signifi-cance to global change assessment. Glob. Planet Change 36, 31–46. https ://doi.org/10.1016/S0921 -8181(02)00162 -5 (2003). 7. Milkov, A. V. et al. Ethane enrichment and propane depletion in subsurface gases indicate gas hydrate occurrence in marine
sediments at southern Hydrate Ridge offshore Oregon. Org. Geochem. 35, 1067–1080. https ://doi.org/10.1016/j.orgge ochem .2004.04.003 (2004).
8. Sassen, R., Sweet, S. T., DeFreitas, D. A. & Milkov, A. V. Exclusion of 2-methylbutane (isopentane) during crystallization of structure II gas hydrate in sea-floor sediment Gulf of Mexico. Org. Geochem. 31, 1257–1262. https ://doi.org/10.1016/S0146 -6380(00)00144 -3 (2000).
9. Khlystov, O. et al. Gas hydrate of lake baikal: discovery and varieties. J. Asian Earth Sci. 62, 162–166. https ://doi.org/10.1016/j. jseae s.2012.03.009 (2013).
10. Khlystov, O. M., Khabuev, A. V., Minami, H., Hachikubo, A. & Krylov, A. A. Gas hydrates in Lake Baikal. Limnol. Freshwater Biol.
1, 66–70 https ://doi.org/10.31951 /2658-3518-2018-A-1-66 (2018).
11. Subramanian, S., Kini, R. A., Dec, S. F. & Sloan, E. D. Jr. Evidence of structure II hydrate formation from methane + ethane mixtures.
Chem. Eng. Sci. 55, 1981–1999. https ://doi.org/10.1016/S0009 -2509(99)00389 -9 (2000).
12. Subramanian, S., Ballard, A. L., Kini, R. A., Dec, S. F. & Sloan, E. D. Jr. Structural transitions in methane + ethane gas hydrates — part I: upper transition point and applications. Chem. Eng. Sci. 55, 5763–5771. https ://doi.org/10.1016/S0009 -2509(00)00162 -7
(2000).
13. Kida, M. et al. Coexistence of structure I and II gas hydrates in Lake Baikal suggesting gas sources from microbial and thermogenic origin. Geophys. Res. Lett. 33, L24603. https ://doi.org/10.1029/2006G L0282 96 (2006).
14. Kida, M. et al. Natural gas hydrates with locally different cage occupancies and hydration numbers in Lake Baikal. Geochem.
Geophys. Geosyst. 10, Q05003. https ://doi.org/10.1029/2009G C0024 73 (2009).
15. Hachikubo, A. et al. Model of formation of double structure gas hydrates in Lake Baikal based on isotopic data. Geophys. Res. Lett.
36, L18504. https ://doi.org/10.1029/2009G L0398 05 (2009).
16. Poort, J. et al. Thermal anomalies associated with shallow gas hydrates in the K-2 mud volcano Lake Baikal. Geo-Mar. Lett. 32, 407–417. https ://doi.org/10.1007/s0036 7-012-0292-0 (2012).
17. Manakov, A. Yu., Khlystov, O. M., Hachikubo, A. & Ogienko, A. G. A physicochemical model for the formation of gas hydrates of different structural types in K-2 mud volcano (Kukui Canyon, Lake Baikal). Rus. Geol. Geophys. 54, 475–482. https ://doi. org/10.1016/j.rgg.2013.03.009 (2013).
18. Hachikubo, A. et al. Dissociation heat of mixed-gas hydrate composed of methane and ethane. In Proc. 6th Int. Conf. on Gas
Hydrates, 6–10 July, 2008, Vancouver, Canada (2008). https ://hdl.handl e.net/2429/2694
19. Kalmychkov, G. V., Pokrovsky, B. G., Hachikubo, A. & Khlystov, O. M. Geochemical characteristics of methane from sediments of the underwater high Posolskaya Bank (Lake Baikal). Lithol. Min. Resour. 52, 102–110. https ://doi.org/10.1134/S0024 49021 70200 55 (2017).
20. Minami, H. et al. Hydrogen and oxygen isotopic anomalies in pore waters suggesting clay mineral dehydration at gas hydrate-bearing Kedr mud volcano, southern Lake Baikal Russia. Geo-Mar. Lett. 38, 403–415. https ://doi.org/10.1007/s0036 7-018-0542-x
(2018).
21. Rasskazov, S. V. et al. Sediments in the Tertiary Tankhoi field, south Baikal basin: stratigraphy, correlation and structural transfor-mations in the Baikal region (in Russian). Geodyn. Tectonophys. 5, 993–1032. https ://doi.org/10.5800/GT-2014-5-4-0165 (2014). 22. Khlystov, O. M. et al. New evidence on the relief of the southern underwater slope in the south Baikal basin. Geogr. Nat. Resour.
39, 33–38. https ://doi.org/10.1134/S1875 37281 80100 55 (2018).
23. Hachikubo, A. et al. Molecular and isotopic characteristics of gas hydrate-bound hydrocarbons in southern and central Lake Baikal.
Geo-Mar. Lett. 30, 321–329. https ://doi.org/10.1007/s0036 7-010-0203-1 (2010).
24. Bernard, B. B., Brooks, J. M. & Sackett, W. M. Natural gas seepage in the Gulf of Mexico. Earth Planet. Sci. Lett. 31, 48–54. https ://doi.org/10.1016/0012-821X(76)90095 -9 (1976).
25. Milkov, A. V. & Etiope, G. Revised genetic diagrams for natural gases based on a global dataset of >20,000 samples. Org. Geochem.
125, 109–120. https ://doi.org/10.1016/j.orgge ochem .2018.09.002 (2018).
26. Whiticar, M. J. Carbon and hydrogen isotope systematics of bacterial formation and oxidation of methane. Chem. Geol. 161, 291–314. https ://doi.org/10.1016/S0009 -2541(99)00092 -3 (1999).
27. Taylor, S. W., SherwoodLollar, B. & Wassenaar, L. I. Bacteriogenic ethanein near-surface aquifers: Implications for leaking hydro-carbon well bores. Environ. Sci. Technol. 34, 4727–4732. https ://doi.org/10.1021/es001 066x (2000).
28. Milkov, A. V. Molecular and stable isotope compositions of natural gas hydrates: a revised global dataset and basic interpretations in the context of geological settings. Org. Geochem. 36, 681–702. https ://doi.org/10.1016/j.orgge ochem .2005.01.010 (2005). 29. Milkov, A. V. Worldwide distribution and significance of secondary microbial methane formed during petroleum biodegradation
in conventional reservoirs. Org. Geochem. 42, 184–207. https ://doi.org/10.1016/j.orgge ochem .2010.12.003 (2011).
30. Scott, A. R., Kaiser, W. R. & Ayers, W. B. Jr. Thermogenic and secondary biogenic gases, San Juan Basin, Colorado and New Mexico – implications for coalbed gas producibility. Am. Assoc. Pet. Geol. Bull. 78, 1186–1209. https ://doi.org/10.1306/A25FE AA9-171B-11D7-86450 00102 C1865 D (1994).
31. Lorenson, T. D., Collett, T. S. & Hunter, R. B. Gas geochemistry of the Mount Elbert Gas Hydrate Stratigraphic Test Well, Alaska North Slope: Implications for gas hydrate exploration in the Arctic. Mar. Petrol. Geol. 28, 343–360. https ://doi.org/10.1016/j.marpe tgeo.2010.02.007 (2011).
32. James, A. T. & Burns, B. J. Microbial alteration of subsurface natural gas accumulations. AAPG Bull. 68, 957–960 (1984). 33. Katz, B. J. Microbial processes and natural gas accumulations. Open Geol. J. 5, 75–83. https ://doi.org/10.2174/18742 62901 10501
0075 (2011).
34. Sloan, E. D. Jr. Clathrate hydrates of natural gases (Marcel Dekker, NY, 1998).
35. Kida, M., Jin, Y., Takahashi, N., Nagao, J. & Narita, H. Dissociation behavior of methane-ethane mixed gas hydrate coexisting structures I and II. J. Phys. Chem. A 114, 9456–9461. https ://doi.org/10.1021/jp105 5667 (2010).
36. Hachikubo, A. et al. Isotopic fractionation of methane and ethane hydrates between gas and hydrate phases. Geophys. Res. Lett.
34, L21502. https ://doi.org/10.1029/2007G L0305 57 (2007).
37. Matsuda, J., Hachikubo, A., Ozeki, T. & Takeya, S. Effect of crystallographic structure on hydrogen isotope fractionation of ethane in the system of methane and ethane mixed-gas hydrate (in Japanese). Annu. Rep. on Snow and Ice Studies in Hokkaido 37, 27–30 (2018).
38. Uchida, T. et al. Physical properties of natural gas hydrate and associated gas-hydrate-bearing sediments in the JAPEX/JNOC/ GSC et al. Mallik 5L-38 gas hydrate production research well in Scientific Results from the Mallik 2002 Gas Hydrate Production Research Well Program, Mackenzie Delta, Northwest Territories, Canada (eds. Dallimore, S. R. & Collett, T. S.) (Geological Survey of Canada, Bulletin 585, 2005).
39. Hunt, J. M. & Whelan, J. K. Dissolved gases in Black Sea sediments. DSDP Initial Rep. 42, 661–665. https ://doi.org/10.2973/dsdp. proc.42-2.125.1978 (1978).
40. Schaefer, R. G. & Leythaeuser, D. C2–C8 hydrocarbons in sediments from Deep Sea Drilling Project Leg 75, holes 530A, Angola
41. Hachikubo, A., Yanagawa, K., Tomaru, H., Lu, H. & Matsumoto, R. Molecular and isotopic composition of volatiles in gas hydrates and in pore water from Joetsu Basin, eastern margin of Japan Sea. Energies 8, 4647–4666. https ://doi.org/10.3390/en806 4647 (2015). 42. Manakov, A. Y., Kosyakov, V. I. & Solodovnikov, S. F. Structural chemistry of clathrate hydrates and related compounds in
Com-prehensive Supramolecular Chemistry II (ed. Atwood, J. L.) 161–206 (Oxford, Elsevier, 2017).
43. Sakagami, H. et al. Molecular and isotopic composition of hydrate-bound and sediment gases in the southern basin of Lake Baikal, based on an improved headspace gas method. Geo-Mar. Lett. 32, 465–472. https ://doi.org/10.1007/s0036 7-012-0294-y (2012).
Acknowledgements
We greatly appreciate the assistance of the shipboard crews of RV G. Yu. Vereshchagin during the Lake Baikal expeditions. We are grateful to Prof. A. Milkov, Dr. G. G. Akhmanov and an anonymous reviewer for their con-structive comments. This work was supported by funding agencies in Japan (Japan Society for the Promotion of Science KAKENHI 26303021, 16H05760 and 17H03300 and the presidential grant of the Kitami Institute of Technology). The work was also supported by the project of LIN SB RAS (AAAA-A16-116122110064-7), IGC SB RAS # IX.127.1.2. (0350-2019-0004), RSF-19-17-00226 and 01-FPK-19 of the INRTU. X-ray diffraction studies were supported by paragraph V.44.4.9. ‘Development of the scientific foundations of the physical chem-istry of clathrate (gas), semi-clathrate and ionic clathrate hydrates’ of the program of basic scientific research ‘Development of the scientific basis of the directed synthesis of new inorganic and coordination compounds and functional materials based on them’.
Author contributions
A.H. designed the study, performed gas analysis and drafted the manuscript; H.M., S.Y., A.K. and A.K. conducted the fieldwork and prepared the data; G.K. helped with gas analysis; J.P. conceived the model of gas hydrate forma-tion; M.D. revised and edited the manuscript; A.C. conducted geophysical survey; A.M. did the PXRD analysis and O.K. designed the framework of the cruises. All authors contributed to the drafts and gave final approval for publication.
competing interests
The authors declare no competing interests.
Additional information
Supplementary information is available for this paper at https ://doi.org/10.1038/s4159 8-020-71410 -2.
Correspondence and requests for materials should be addressed to A.H. Reprints and permissions information is available at www.nature.com/reprints.
Publisher’s note Springer Nature remains neutral with regard to jurisdictional claims in published maps and
institutional affiliations.
Open Access This article is licensed under a Creative Commons Attribution 4.0 International
License, which permits use, sharing, adaptation, distribution and reproduction in any medium or format, as long as you give appropriate credit to the original author(s) and the source, provide a link to the Creative Commons licence, and indicate if changes were made. The images or other third party material in this article are included in the article’s Creative Commons licence, unless indicated otherwise in a credit line to the material. If material is not included in the article’s Creative Commons licence and your intended use is not permitted by statutory regulation or exceeds the permitted use, you will need to obtain permission directly from the copyright holder. To view a copy of this licence, visit http://creat iveco mmons .org/licen ses/by/4.0/.