HAL Id: hal-00317006
https://hal.archives-ouvertes.fr/hal-00317006
Submitted on 1 Jan 2003
HAL is a multi-disciplinary open access
archive for the deposit and dissemination of
sci-entific research documents, whether they are
pub-lished or not. The documents may come from
teaching and research institutions in France or
abroad, or from public or private research centers.
L’archive ouverte pluridisciplinaire HAL, est
destinée au dépôt et à la diffusion de documents
scientifiques de niveau recherche, publiés ou non,
émanant des établissements d’enseignement et de
recherche français ou étrangers, des laboratoires
publics ou privés.
Using routine meteorological data to derive sky
conditions
D. Pagès, J. Calbó, J. A. González
To cite this version:
D. Pagès, J. Calbó, J. A. González. Using routine meteorological data to derive sky conditions.
Annales Geophysicae, European Geosciences Union, 2003, 21 (3), pp.649-654. �hal-00317006�
Annales
Geophysicae
Using routine meteorological data to derive sky conditions
D. Pag`es1, J. Calb´o1,2, and J. A. Gonz´alez11Department of Physics, University of Girona, Girona, Spain 2Institute of the Environment, University of Girona, Girona, Spain
Received: 5 November 2001 – Revised: 17 April 2002 – Accepted: 24 April 2002
Abstract. Sky condition is a matter of interest for public and weather predictors as part of weather analyses. In this study, we apply a method that uses total solar radiation and other meteorological data recorded by an automatic station for de-riving an estimation of the sky condition. The impetus of this work is the intention of the Catalan Meteorological Service (SMC) to provide the public with real-time information about the sky condition. The methodology for deriving sky condi-tions from meteorological records is based on a supervised classification technique called maximum likelihood method. In this technique we first need to define features which are derived from measured variables. Second, we must decide which sky conditions are intended to be distinguished. Some analyses have led us to use four sky conditions: (a) cloud-less or almost cloudcloud-less sky, (b) scattered clouds, (c) mostly cloudy – high clouds, (d) overcast – low clouds. An addi-tional case, which may be treated separately, corresponds to precipitation (rain or snow). The main features for estimating sky conditions are, as expected, solar radiation and its tem-poral variability. The accuracy of this method of guessing sky conditions compared with human observations is around 70% when applied to four sites in Catalonia (NE Iberian Peninsula). The agreement increases if we take into account the uncertainty both in the automatic classifier and in visual observations.
Key words. Meteorological and atmospheric dynamics (in-struments and techniques; radiative processes) – Atmo-spheric composition and structure (cloud physics and chem-istry)
1 Introduction
Clouds play an important role in the atmosphere over many different temporal and spatial scales. Time trends, parame-terizations, feedbacks, radiation processes and global distri-bution of cloud features are still uncertain, as described by
Correspondence to: J. Calb´o ([email protected])
the last technical report of the Intergovernmental Panel on Climate Change (see the IPCC Technical Summary, available through the Internet at http://www.ipcc.ch/). It is especially interesting to mention the existence of difficulties in assess-ing cloud cover in some specific situations.
For cloud cover assessment, ground-based observations of two kinds are possible: visual observations, which may be too subjective, and whole sky cameras, such as the ARM WSI or the Yankee Environmental Systems TSI. Both op-tions are expensive, thus, limiting the number of observation sites over the world. In addition, ground-based observations cannot reach areas greater than approximately 50 km in ra-dius (Henderson-Sellers et al., 1987). Moreover, given the upward view of these observations, there are serious difficul-ties in detecting high clouds when low clouds are present. There are, however, long time series of ground-based visual observations at some sites. Furthermore, ground-based ob-serving systems may offer good spatial resolution when de-scribing clouds, thus, allowing for mesoscalar phenomenon detection. Ground-based observations are also important when cloud position with respect to the Sun is relevant, for example, in radiative transfer studies (Sabburg and Wong, 2000). One must remember that standard cloud type def-initions are based on cloud morphology as seen from the ground.
On the other hand, cloud data can be derived from ra-diometric measurements from satellites. Satellite observa-tions can image large geographical areas, and can cover the whole Earth. Besides, they may be used to obtain physical characteristics of clouds, such as optical thickness. Obvi-ously, satellites cannot view the whole Earth continuously: a satellite’s resolution can be half an hour and some kilo-meters for geostationary satellites (e.g. METEOSAT) or one day and 1 km for polar satellites (e.g. MODIS instrument on TERRA satellite). By the year 2003, Meteosat Second Generation data will be available, providing better temporal (15 min) and spatial resolution (1 km at nadir). These res-olutions match more adequately temporal and spatial char-acteristic scales of sky conditions, which can be as small as
650 D. Pag`es et al.: Sky conditions from meteorological data tens of minutes and a few kilometers. Another issue is that
satellites have downward views, which make it difficult to detect low clouds. Specifically, satellite observation of bro-ken low clouds is highly dependent on surface properties, for example, detection of cumulus fields over land will depend on surface reflectance and proportion of cloud shadow on the surface. In any case, ground-based observations and satel-lite measurements are complementary (Hughes, 1984; Charl-son, 2001).
Back on the ground, the number of automatic weather sta-tions is increasing all over the world, and nowadays there are regions with good spatial distribution of this type of station. Very often these stations are equipped with pyranometers, so studies relating radiation (and other measurements) with sky conditions might be useful in many places for several rea-sons. First, they may provide cloud information required by radiative transfer models with the adequate temporal resolu-tion. Second, they may produce a sky condition assessment compatible with the needs of both weather observers and the general public.
The major aim of this work is to assess the capability of a methodology to determine sky conditions from meteorologi-cal data automatimeteorologi-cally recorded at automatic meteorologimeteorologi-cal stations. Specifically, the Catalan Weather Service (Servei de Meteorologia de Catalunya, SMC) is willing to provide the general public with real-time information about the sky condition at its meteorological stations. Instead of hiring hu-man observers, deploying video or photo devices, or analyz-ing satellite images, we shall explore here a cheap system to obtain a diagnostic of the sky condition, since it is based on processing some already measured variables.
The methodology was already introduced by Calb´o et al. (2001), and is synthetically explained in Sect. 2, along with the database used to apply the method, and the tools used to test it. Calb´o et al. (2001) used total and diffuse irradi-ance measurements with a 5 minute resolution to retrieve sky conditions representative of 1 h intervals. They suggested an automatic cluster classification technique with a maximum likelihood criterion; they tested the method for distinguish-ing different number of clusters, and compared the results with non-collocated visual observations. Under those con-ditions, they obtained accuracy indices of 45% (9 clusters) and 60% (5 clusters). In the present paper, we make use of the same classification method, but with different variables and clusters. Specifically, measurements used here are total solar irradiance, plus other meteorological variables, such as relative humidity and temperature; diffuse irradiance is not available. Data resolution is 1 min, while our aim is to de-termine sky conditions representative of 1/2 h intervals. Four databases (measurements and visual observations) are used here. Moreover, the present work is oriented towards the above-mentioned particular application.
As for previous similar research, Duchon and O’Malley (1998) developed a method based on thresholds to make a diagnostic of sky condition in 7 clusters. Their only vari-ables were two radiative features: a normalized clearness in-dex and its standard deviation. Long et al. (1999) suggested
the use of a clear sky identification algorithm (Long and Ack-erman, 2000) to derive the so-called normalized diffuse cloud effect. This variable is then empirically related to cloud cover. Tunc (1999) and Kasten and Czeplak (1980) sug-gested other relationships between radiation measurements and sky conditions.
2 Methodology 2.1 Classifier
The method we have chosen to assess the sky condition is a cluster supervised classification technique using a maximum likelihood criterion (Calb´o et al., 2001). This technique is often used for pattern recognition in satellite imagery. Back-ground information for this method can be found in Duda and Hart (1973), where the theoretical basis is developed, and in Richards (1995), where application to satellite imagery is ex-plained.
The first step in the method is building a feature vector x for a particular case (i.e. for a particular time and site). The feature vector includes N variables (features) which are derived from the measured ones. In the present work, the only variables we want to use are those usually measured by an automatic weather station: total solar irradiance, temper-ature, relative humidity, wind speed and direction, pressure and precipitation. Then, the method calculates values of dis-criminant functions gi(x) for each cluster wi. Each cluster corresponds to each sky condition to be distinguished. Val-ues of discriminant functions depend on the conditional prob-ability P (wi|x) that the particular sample represented by x belong to cluster wi. Finally, the maximum likelihood crite-rion is:
x ∈ wi ⇔gi(x) > gk(x), ∀k 6= i , (1)
where each discriminant function can be written as: gi(x) = ln[P (wi)] −
1 2 ln |6i|
−1/2(x − µi)T6i−1(x − µi) (2) if a Gaussian distribution for p(x|wi)is assumed. In Eq. (2),
µi is the vector of averaged features of all samples belong-ing to cluster wi;P (wi)is the a priori probability for a sam-ple to belong to cluster wi, which can be related to the cli-matic probability; and 6iis the covariance matrix obtained
from all feature vectors belonging to cluster wi. This means that we have built an N dimensional space of features, where a particular sample (sky condition) corresponds to a point. Clusters of points, corresponding to similar sky conditions, are defined through their centers (µi), shapes 6iand a priori
probabilities P (wi).
Therefore, for a practical application of such a methodol-ogy, several decisions must be taken: how many and what clusters are to be distinguished, and how many and what fea-tures are available to be used. Then, a data set is needed to calculate values of µi, 6i, and eventually, P (wi).
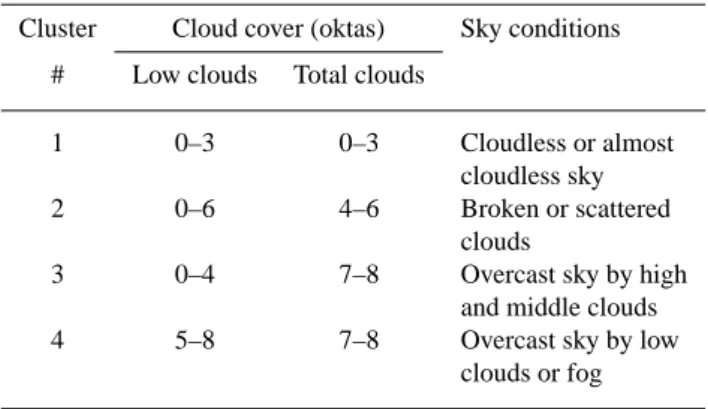
Table 1. Description of the four sky conditions used in our analysis
Cluster Cloud cover (oktas) Sky conditions # Low clouds Total clouds
1 0–3 0–3 Cloudless or almost
cloudless sky
2 0–6 4–6 Broken or scattered
clouds
3 0–4 7–8 Overcast sky by high
and middle clouds
4 5–8 7–8 Overcast sky by low
clouds or fog
The number and type of features are not fixed by the clas-sification method, so we have defined a series of features, derived after measured variables that are supposed to be rel-evant, i.e. to introduce information for distinguishing among sky conditions. Subsequently, we have assessed which sub-group of these set of features produces the best results. All features are defined over half an hour periods, since it is the time interval used by the SMC to update its public broadcast of weather information. Features tested in the present work are the following: (i) normalized clearness index, Kn; (ii) so-lar radiation variability V AR4; (iii) mean air relative
humid-ity, U ; (iv) mean air temperature, T ; (v) mean wind speed, W. Feature Knis the ratio between measured total irradiance and estimated total irradiance in cloudless conditions at the same site, date and time; this ratio is corrected to remove the intrinsic daily evolution due to changes in optical air mass (Gonz´alez and Calb´o, 1999). Feature V AR4is directly
re-lated to the difference between the length of the actual Kn vs. time curve and the length of an horizontal curve, which corresponds to a cloudless sky. The more variable the global irradiance (and correspondingly, Kn) is in a given period, the higher this feature (Calb´o et al., 2001).
In this supervised cluster analysis technique, the number and type of clusters (i.e. sky conditions to be distinguished) is to be defined by the user. After several preliminary tests, we adopted 4 clusters for further analysis. These four sky condi-tions are defined based on the total amount of clouds and the amount of low clouds (see Table 1). One reason for choosing these sky conditions is that they correspond approximately to four categories largely used by the SMC in its weather fore-casts and public broadfore-casts of weather information.
2.2 Database and algorithm training
The process to obtain µi, 6i, and P (wi)is called training, and it is done by using a database, called training set, where each record of the ensemble is previously (manually) classi-fied. So we calculate µi and 6i from all feature vectors x
corresponding to records in cluster wi; while P (wi)may be estimated as proportional to the number of records in each cluster.
Table 2. Position of sites and a priori probabilities P (wi) for
each site Station Position P (w1) P (w2) P (w3) P (w4) Girona 41.9◦N, 2.8◦E, 49% 17% 19% 15% 90 m Lleida 41.5◦N, 0.5◦E, 54% 21% 13% 12% 150 m Sort 42.4◦N, 1.1◦E, 54% 24% 7% 15% 700 m Deltebre 40.7◦N, 0.8◦E, 56% 17% 10% 17% 10 m
The database used in the present work contains data from four different sites representing different climatic regions in Catalonia, NE of the Iberian Peninsula (see Table 2). There is an automatic weather station at each site, with the mea-surements that we need, and an observer that reports total and low cloudiness and type of clouds. Data were collected during one year approximately (May 1999 – May 2000), ob-taining an average of 600 suitable records for each site. 2.3 Evaluation indexes
Once the classifier is trained, we must evaluate its perfor-mance by using a number of previously and manually classi-fied records (the so-called test set). In the present work, the very same database has been used for training and testing the method, unless otherwise noted.
The score of the method is shown by a contingency ta-ble called confusion matrix, where each element Cij is the number of records pertaining to cluster i that have been au-tomatically classified in cluster j . So the diagonal elements correspond to the records that have been correctly classified. Since we have to compare several matrices, we calculated some indexes that summarize the information in each matrix.
The most commonly used index is the accuracy index
A = P i Cij P i,j Cij , (3)
which is the ratio of correctly classified records over the total number of records. Although its meaning is clear, this index does not explain anything about how the accuracy is spread in the matrix. Therefore, we have also used the kappa index
κ = N ·P k Ckk−P k Ck+·C+k N2−P k Ck+·C+k , (4) where Ck+ = P j Ckj, C+k = P i
Cik, and N is the num-ber of samples in the test set. This κ index makes a global assessment of the performance of the classifier; it includes
652 D. Pag`es et al.: Sky conditions from meteorological data
Table 3. Description and evaluation indexes for the best classifier
at each station
Station Features P (wi) Confusion A κ
matrix(1) Girona KnV AR4U T No 118 10 11 2 73% 60% 10 24 10 7 11 5 40 9 1 5 2 39 Lleida KnV AR4U T W No 260 68 3 15 70% 55% 14 91 13 10 3 14 35 25 1 8 8 45 Sort KnU T No 363 23 4 9 67% 45% 114 43 14 30 11 8 15 14 3 6 15 85 Deltebre KnV AR4U T W Yes 125 3 5 2 70% 42% 29 5 5 5 7 1 6 5 7 0 1 20
(1)In the confusion matrix, rows correspond to “observed”
classifi-cation, and columns correspond to “automatic” classification.
the user’s point of view, and somewhat corresponds to the improvement of the classifier with respect to a random clas-sification with equal probabilities for all clusters.
3 Results and conclusion
Table 2 shows the a priori probabilities P (wi)obtained at the four sites used in the present work. P (wi)have been ob-tained as directly proportional to the frequency of appearance of each sky condition. All sites show a very high probabil-ity of almost clear skies. Little differences in probabilities of other sky conditions are related to particular climatic charac-teristics of each site, for example, Sort is a mountain site in the Pyrenees, Lleida is known for its continental climate, and Deltebre is placed just on the Mediterranean coast.
In Table 3, we show a summary of results obtained af-ter training and testing the automatic classifier. Actually, for each site we show some description and the evaluation in-dexes of the best classifier that we have obtained. This means that a number of trials have been carried out, for example, to check which features produce the best result at each site. Note that accuracy indexes are close to 70% at the four sites, while κ indexes are in a range between 42 and 60%. The worst κ index corresponds to Deltebre, the site with the low-est number of records to train and tlow-est the classifier.
In general, the two radiative features Knand V AR4, plus
humidity U , are the most relevant variables to be considered for sky condition identification. Temperature T and, at some sites, wind speed W may slightly help to improve the accu-racy of the classifier. Lacking diffuse radiation data, normal-ized clearness index Knis the most important parameter be-cause it gives a measure of extinction of solar radiation (note that Kn is basically a global transmittance). The following feature in importance, the variability parameter V AR4,
ac-counts for variations in the normalized clearness index within the time interval (1/2 h). It takes minimum values when the clearness index is constant and maximum values when the clearness index shows large variability. Therefore, it helps the classifier to detect skies with significant horizontal struc-ture. Of course, for a cloudiness horizontal pattern to be detected as temporal variability, some change (either in the pattern itself or in the position of the pattern relative to Sun or the pyranometer) must occur. Note that at Sort we could not use V AR4, since 1-min data needed for computing
vari-ability was not available at this site. This is the reason that explains poorer performance of the classifier at this site, and confirms the interest of using short interval measurements to compute radiation variability. Relative humidity also adds some information in the classifier. This is easily explained: generally speaking, the higher the cloud cover and the lower the cloud level, the higher the humidity, i.e. low-level clouds are usually associated to high relative humidity.
We checked the effect of using or not using the a priori probabilities. At all sites but one (Deltebre), the classifier ob-tains higher scores when equal probabilities for all sky con-ditions are used. We think that the very high a priori proba-bility of class 1 (which is explained by its coastal position), plus the low number of suitable samples for training and test-ing at Deltebre, are the reasons for this particular behaviour at this site.
As far as the number of clusters (sky conditions) chosen is concerned, we looked for a balance between the number of clusters and the accuracy of the algorithm. This balance is met when using 4 clusters, which are also directly related to the symbols of weather forecasts published by the Sevei de Meteorologia de Catalunya. With these 4 sky conditions, the accuracy index is the already mentioned 70%, while analyses not shown here with the same databases concluded that with 5 clusters, the index is lowered to approximately 60%. Note that 60% accuracy for 5 clusters is the same figure that we had obtained in our previous work (Calb´o et al., 2001). In the present work, we consider that for the practical application that is intended, 70% accuracy is more suitable.
All results shown in Table 3 were obtained using the same set of data for training the classifier and for testing its perfor-mance. In addition, all results correspond to using samples with solar altitude greater than 20◦. The effect of limiting the use of the classifier to such cases is a significant improve-ment of its performance. We relate this effect to problems with measurements (cosine effect of pyranometers, occulta-tion of the Sun behind some obstacles in the horizon, etc.), with visual observation of clouds when the Sun is just over
the horizon, and with features Knand V AR4(cloudless sky
irradiance estimate is usually poorer for low solar altitudes). We also checked the effect of using different data sets for training and testing the classifier for Lleida site, splitting the database into two sets. One set was used to train the classifier and the other one to test it. Depending on the particular case, the evaluation index κ ranged from 44% to 47%, versus a value of 55% when the very same data were used as a training set and testing set. The assessment with different data sets is formally more correct, but we could not use different data sets at all sites, since the number of suitable records was not big enough.
At Girona, some additional observations were available, along with the standard cloud observations and meteorolog-ical data. This additional information allowed us to find at least three significant sources of misclassification of samples. First, very thin clouds, or clouds that lie far from the solar beam, are hardly detected, since they create little change in total solar radiation. As some authors have concluded (Long et al., 1999), diffuse radiation is a key measurement to deal with these sky conditions. Diffuse radiation, however, is not a typical measurement at automatic meteorological stations, and is not available at the sites used in the present work.
Second, human observations, which are the basis of the “correct” classification, are subjective. Thus, different ob-servers may have some bias in recording cloud observations, both regarding the fractional sky cover and the cloud type.
Third, the discreteness of cloud cover measurements (an entire number between 0 and 8 oktas) provides that little dif-ferences in the actual sky that may change the “correct” sky condition classification of a particular sample, while features are almost unchanged (thus leading to identical automatic classification).
In order to consider the combined effect of the two latter issues, we have assigned an uncertainty of 1 okta in observa-tions of cloud cover. Then, we have re-assessed the perfor-mance of the classifier. At Girona, for example, the accuracy index A improves up to 80%, versus the initial 73%. More-over, another way to account for the uncertainties involved is to count as correct all samples that are classified in clus-ters close to the actually correct one. In other words, one computes the accuracy index including not only values in the diagonal of the confusion matrix, but also values that are be-side the diagonal. For Girona, this means an improvement of A from 73% to 87%, and of κ from 60% to 82%. Ob-viously, these values should be considered as maximum val-ues, and are given here to provide an estimate of the effect of uncertainty in visual observation of clouds on the automatic classifier applied in the present work.
In summary, we can say that an automatic classifier based on maximum likelihood techniques, as suggested by Calb´o et al. (2001), may be applied to determine the sky condition over a site, with an expected accuracy greater than 70%. This figure is obtained as an approximate average of applying such a technique at four sites in Catalonia, trying to distinguish be-tween four different sky conditions, and using typical mea-surements available in automatic weather stations. Since
an-other sky condition (precipitation) is immediately diagnosed from the rain gauge measurement, the overall accuracy for five sky conditions is even higher. Moreover, if we consider that a possible user of this information (i.e. the general public to whom the weather broadcast is addressed) is not interested in the exact cloud cover, the percentage of cases that may be labelled as correct should also be higher.
In principle, this technique may be applied to any site where an automatic weather station equipped with a pyra-nometer is available. Since the classifier may be trained with data from the very same site, eventually it can be adapted to any climate. In agreement with the Catalan Meteorological Service, plans for our research team include to keep testing this technique at other sites, and to implement it in the algo-rithm that continuously manages automatic station data for real-time broadcast of meteorological information.
Acknowledgements. This work was motivated and supported by the Servei de Meteorologia de Catalunya (Catalan Meteorological Ser-vice). We must thank the work of several observers that helped us to build the required databases: Ramon Baylina at Sort, Francesc Castellv at Lleida, and Alicia Bo at Deltebre. We thank Dr. Andreas Macke for encouraging the publication of this work, originally pre-sented as a poster presentation in the EGS 26th general assembly. Finally, we acknowledge the anonymous reviewer for several sug-gestions that significantly improved our paper.
Topical Editor J. P. Duval thanks a referee for his help in evalu-ating this paper.
References
Calb´o, J., Gonz´alez, J. A., and Pag`es, D.: A Method for Sky-Condition Classification from Ground-Based Solar Radiation Measurements, Journal of Applied Meteorology, 40 (22), 2194– 2200, 2001.
Charlson, R. J.: Extending Atmospheric Aerosol Measuremets to the Global Scale, IGACtivities Newsletter of the International Global Atmospheric Chemistry Project, 25, 11–14, 2001. Duda, R. O. and Hart, P. E.: Pattern Classification and Scene
Anal-ysis, Wiley, New York, 1973.
Duchon, C. E. and O’Malley, M. S.: Estimating cloud type from pyranometer observations, Journal of Applied Meteorology, 38, 132–141, 1998.
Gonz´alez, J. A. and Calb´o, J.: Influence of the Global Radiation Variability on the Hourly Diffuse Fraction Correlations, Solar Energy, 65 (2), 119–131, 1999.
Henderson-Sellers, A., Seze, G., Drake, F., and Desbois, M.: Sur-face and satellite cloudiness for Europe in 1983, Journal of Geo-physical Research, 92 (D4), 4019–4033, 1987.
Hughes, N. A.: Global Cloud Climatologies: a Historical Re-view, Journal of Climate and Applied Meteorology, 23, 724–751, 1984.
Kasten, F. and Czeplak, G.: Solar and terrestrial radiation dependent on the amount and type of cloud, Solar Energy, 24, 177–189, 1980.
Long, C. N., Ackerman, T. P., DeLuisi, J. J., and Augustine, J.: Es-timation of Fractional Sky Cover from Broadband SW Radiome-ter Measurements, Proceedings 10th Conference on Atmospheric Radiation June 28 – July 2, Madison (Wisconsin), 1999.
654 D. Pag`es et al.: Sky conditions from meteorological data Long, C. N. and Ackerman, T. P.: Identification of clear skies
from broadband pyranometer measurements and calculations of downwelling shortwave cloud effects, Journal of Geophyiscal Research, 105 (D12), 15 609–15 626, 2000.
Richards, J. A.: Remote Sensing Digital Image Analysis, Springer-Verlag, Berlin, 1995.
Sabburg, J. and Wong, J.: The effect of clouds on enhancing UVB irradiance at the Earth’s surface: a one year study, Geophysical Research Letters, 27 (20), 3337–3340, 2000.
Tunc, S.: Enhancement of Solar and Ultraviolet Surface Irradiance Under Partial Cloudy Conditions, KNMI Scientific Report WR 99–01, De Bilt (The Netherlands), 1999.