HAL Id: hal-00143966
https://hal.archives-ouvertes.fr/hal-00143966
Submitted on 29 Apr 2007HAL is a multi-disciplinary open access archive for the deposit and dissemination of sci-entific research documents, whether they are pub-lished or not. The documents may come from teaching and research institutions in France or abroad, or from public or private research centers.
L’archive ouverte pluridisciplinaire HAL, est destinée au dépôt et à la diffusion de documents scientifiques de niveau recherche, publiés ou non, émanant des établissements d’enseignement et de recherche français ou étrangers, des laboratoires publics ou privés.
CD4 cell count above 400 x 10(6) cells/l.
Rodolphe Thiébaut, Isabelle Pellegrin, Geneviève Chêne, Jean François
Viallard, Hervé Fleury, Jean François Moreau, Jean Luc Pellegrin, Patrick
Blanco
To cite this version:
Rodolphe Thiébaut, Isabelle Pellegrin, Geneviève Chêne, Jean François Viallard, Hervé Fleury, et al.. Immunological markers after long-term treatment interruption in chronically HIV-1 infected patients with CD4 cell count above 400 x 10(6) cells/l.. AIDS, Lippincott, Williams & Wilkins, 2005, 19 (1), pp.53-61. �hal-00143966�
Title: Immunological markers after long term treatment interruption in chronically HIV-1
infected patients with CD4 count above 400 cells/mm3
Running title: Markers evolution after STI
Authors: Rodolphe Thiébaut 1,2, Isabelle Pellegrin 4, Geneviève Chêne 2, Jean François
Viallard 5, Hervé Fleury 4, Jean François Moreau 3,4, Jean Luc Pellegrin 5, Patrick Blanco 3,4
Affiliations
1. INSERM E0338 and 2. INSERM U593, ISPED, Bordeaux 2 University, Bordeaux, France 3. CNRS UMR5164 CIRID, Bordeaux 2 University, Bordeaux, France
4. Department of Virology and Immunology and 5. Department of Internal Medicine and Infectious Diseases, Bordeaux University Hospital, France
Corresponding author and request for reprints
Rodolphe Thiébaut
INSERM E0338 & U593, ISPED Université Bordeaux 2, Case 11,
146 Rue Léo Saignat, 33076 Bordeaux Cedex, France Tel: (33) 5 57 57 45 21 Fax: (33) 5 56 24 00 81 Email: [email protected]
Abstract
Objective: To analyse immunological markers associated with CD4+ lymphocyte T-cell
count (CD4+) evolution during 12-month follow-up after treatment discontinuation.
Design: Prospective observational study of chronically HIV-1 infected patients with CD4+
above 400 cells/mm3.
Results: CD4+ changes took place in two phases: a first rapid decrease in the first month
(-142 cells/mm3 on average), followed by a slow decline (-17 cells/mm3 on average) The
second slope of CD4+ decline was not correlated with the first and no factor but baseline plasma HIV RNA was associated with it. The decline in CD4+ during the first month was steeper in patients with higher CD4+ and weaker plasma HIV RNA baseline levels. Moreover, the decline was less pronounced (p<10-4) in patients with CD4+ nadir above 350
cells/mm3 (-65 cells/mm3/month) as compared to those below 350 cells/mm3 (-200
cells/mm3/month). A high number of dendritic cells [DCs] whatever the type was associated
with high CD4+ at the time of treatment interruption and its steeper decline over the first month. Moreover, the myeloid DC level was stable whereas the lymphoid DC count which tended to decrease in association with CD4+ decrease, was negatively correlated with the HIV RNA load slope.
Conclusions: The results support the use of the CD4+ nadir to predict the CD4+ dynamic
after treatment interruption and the consideration of the CD4+ count after one-month of interruption merely reflects the 12-month level of CD4+. Although DCs seem to be associated with the CD4+ dynamic, the benefit of monitoring them has still to be defined.
Keywords
HIV infection, treatment interruption, CD4+, HIV RNA, immunologic markers, viral markers, dendritic cells
Introduction
Antiretroviral treatment interruptions have been introduced in the course of the antiretroviral treatment of HIV infected patients based on the recent recognition that virus eradication is no longer achievable [1] and because of the issues associated with long-term treatment with highly active antiretroviral therapy (HAART) such as compliance, side effects and drug resistance [2, 3]. In addition, on the sole basis of immune system physiology, some authors have argued that treatment interruption might result in a stimulation of the immune system against HIV [4-7]. As a result, partial or complete antiretroviral treatment interruption has been evaluated in chronically infected patients or during primo-infection [4, 8-16]. On the whole, available data on the kinetics of immune markers in the context of long-term antiretroviral treatment interruption in chronically infected patients are still scarce. A better understanding of the immune response in this situation might, nevertheless, help (i) to evaluate the consequences and the indications for treatment interruption in clinical practice, and (ii) to evaluate the status of the immune system in chronically infected patients who have been treated for several years. Recently, some reports have focused on the key role of dendritic cells (DC) in HIV pathogenesis. Owing to their central role in the immune system, these cells have been implicated in the dissemination of the infection [17] but have also been associated with long-term non-progression [18]. Such cells may play a role in the control of viral replication [19] through the secretion of type 1 Interferon (lymphoid DC) [20] and in the modulation of T cell response after treatment interruption. Thus, we included longitudinal monitoring of peripheral blood DC subsets including myeloid DCs and lymphoid DCs.
The aim of the present study was to analyse specific immunological markers in addition to classical determinants associated with the changes in the CD4+ cell count during a 12-month follow-up period after treatment discontinuation to better define patients eligible for treatment cessation for whom this strategy is as safe as possible.
Methods
Design and data collection
Patients referred to the participating clinical unit (G2, Haut-Lévêque Hospital, Bordeaux, France) and for whom a discontinuation of their antiretroviral therapy with a CD4+ count level above 400 cells/mm3 and CD4+ T cell percentage (%) > 20% were included in the
cohort upon their agreement. Treatment was interrupted because of side effects, personal convenience or because HAART would not have been started based on today’s more conservative guidelines. The primary care provider made decisions regarding when to resume therapy. After treatment interruption, data were recorded prospectively during scheduled visits at one month (M1), M3, M6, M9 and M12. Other information was provided through the Aquitaine Cohort database as all patients participated in this cohort [21]. In short, the Aquitaine Cohort is a prospective hospital-based cohort of HIV-1 infected patients under routine clinical management initiated in 1987 in Bordeaux University Hospital and four other public hospitals in Aquitaine, South-western France. Clinical, biological and therapeutic information are collected prospectively at each visit.
Phenotypic analysis of white blood cells in peripheral blood from patients
Peripheral blood samples for analysis were collected on EDTA and processed within the following 5 hours. Whole blood aliquots (0.1 mL) were incubated with the monoclonal antibody mixture (0.02) for 15 minutes, then FACS lysing solution from BD Sciences (BD Sciences, Pont de Claix, France) was added for another 10 minutes before cells were analysed in the FACSCalibur (BD Sciences). Total lymphocyte gating was set up on physical parameters as well as on CD45 to prevent inclusion of red blood cells in the lymphocyte gate. A minimum of 5000 total lymphocytes were taken into account for each test. The following combinations of monoclonal antibodies were utilized for the phenotypic analysis:
CD45/CD3/CD4/CD8, CD45/CD3/HLA-DR, CD3/CD4/CD8/HLA-DR, Lineages +/CD11C/CD123/HLA-DR. Results were expressed as percentages of positive cells among total lymphocytes and as absolute counts obtained with the True count kit (BD Sciences) in cell numbers/mm3, except for dendritic cells whose numbers were expressed /mL of blood.
Statistical methods
The kinetics of the CD4+ count and the HIV RNA viral load were estimated using a piecewise linear mixed model taking into account the correlation between repeated measurements in a same patient [22]. Baseline was defined as the time of treatment interruption. Data were censored from the time of treatment resumption or from the last available follow-up (most often 12 months). The model was used to estimate the baseline level at the time of treatment interruption, the first slope during the first month and the second slope thereafter. The time point of slope change was the time that led to the best model (i.e. highest likelihood) thus providing the estimated values closest to observed ones. The effect of covariates (measured at M0 or M1) on baseline and on the two slopes was tested by a Wald test for interactions. A multivariable model including all significant variables in unadjusted analyses was performed. The model also allowed for the estimation of the correlation between individual baseline, first slope and second slope through the random effects correlation matrix. The joint kinetic of markers (CD4, CD8, CD8 DR+, HIV RNA, dendritic cells) during the first month was studied by calculating the Pearson correlation between observed slopes at one month. When adapted, continuous variables were categorised according to their distribution (median and quartiles). For HIV RNA, results on the continuous scale were fitted imputing 1.4 log10 copies/mL for undetectable values (i.e. log10 (50/2) copies/mL). Results
were similar using a multiple imputation approach to take into account undetectable values (data not shown).
The time to resumption of treatment was censored at 12 months if the patient did not resume therapy. The association between this delay and several characteristics was tested using a Log-rank test. Strata were defined for each continuous variable according to the tertiles of its distribution. Analyses were performed using SAS software version 8.2 (SAS Institute, Inc., Cary, NC).
Results
Study population
From 22/03/2002 to 11/04/2003, 57 patients were included. The median follow-up was 11.5 months (Interquartile range [IR]: 8.2, 12.5). The patients’ characteristics at the time of treatment interruption (baseline) are shown in Table 1. The median number of measurements of the following immunological markers: CD4+, CD8+, CD4 DR+, CD8 DR+, Dendritic cells and HIV RNA was 5 per patient (IR: 4, 6).
CD4+ T lymphocytes kinetics
At baseline, the CD4+ T-lymphocyte median count was 734 cells/mm3 (IR: 584, 962).
At M1 (one month after baseline), it decreased to 662 cells/mm3 (IR: 494, 797) and, at M12
(12 months after baseline), to 455 cells/mm3 (IR: 352, 644)(Table 2). This biphasic changes in
the CD4+ T-lymphocyte count after treatment cessation was well represented by a two slope model (Figure 1). The estimation of the first mean slope in the first month was -142 cells/mm3/month (95% confidence interval [CI]: -205, -79) and the estimation of the second
slope was -17 cells/mm3/month (CI: -22, -12). The CD4+ T-lymphocyte level at baseline was
significantly negatively correlated with the first slope (r=-0.63, p<10-2): the higher the CD4+
T-lymphocyte baseline level was, the steeper the CD4+ T-lymphocyte count decline during the first month. The second slope was neither correlated to baseline level (p=0.38) nor to the first slope (p=0.29).
Effect of CD4+ nadir
The CD4+ T-lymphocyte nadir before treatment interruption was significantly associated with the CD4+ T-lymphocyte kinetic after treatment termination (Table 3). The lower the nadir was, the steeper the CD4+ decline during the first month (-4.6 cells/month per
10 cells lower, p=0.02). The influence of the CD4+ T-lymphocyte nadir on CD4+ kinetic after antiretroviral treatment interruption was best described in relation to a threshold of 350 cells/mm3 (median, Table 1) rather than on a continuous scale (model log-likelihood -1709
and –1716, respectively; the higher value being better). At the time of treatment interruption, patients with a history of CD4+ T-lymphocyte nadir of less than or above 350 cells/mm3 had
similar CD4+ T-lymphocyte counts (p=0.56, Table 3). However, this nadir threshold led to the delineation of two different behaviours in the first month following treatment interruption since, in patients with a nadir below 350 cells/mm3,the CD4+ T-lymphocyte count decline
was steeper leading to a mean level of 561 cells/mm3 (CI: 485; 636) at M1 and 366 (CI: 297;
434) at M12 as compared to 740 (CI: 660; 819) and 539 (CI: 471; 607), respectively, for patients with a nadir above 350 cells/ mm3 (Figure 2a). This effect of nadir CD4+
T-lymphocytes was independent of baseline HIV RNA viral load as its effects remained even after adjusting for baseline HIV RNA level (p=0.04, difference in first slope ∆ = -127 cells/mm3 compared to p=0.035, ∆ = -134 cells/mm3). Moreover, this effect was still
significant in the fully adjusted model (Table 3).
Effect of baseline HIV RNA load
The CD4+ T-lymphocyte levels at baseline tended to differ according to plasma HIV RNA load (p=0.07). Indeed, the mean CD4+ T-lymphocyte level was 734 cells/mm3 (CI: 583,
884) for those with an HIV RNA load of > 3.3 log10 copies/mL, and 689 cells/mm3 (CI: 546,
833) for those with an HIV RNA load between 1.7 and 3.3 log10 copies/mL as well as 882
cells/mm3 (CI: 773, 991) for those with an undetectable HIV RNA (<1.7 log10 copies/mL).
The CD4+ T-lymphocyte count decline within the first month after treatment interruption was significantly steeper for the patients with a lower HIV RNA (p<10-2) achieved under
respectively. During the period after M1, the CD4+ T-lymphocyte slopes significantly decreased in each group (all p<10-3) but tended to be steeper in patients with the highest HIV
RNA load (p=0.15): -25 cells/mm3/month (CI: -33, -16), -16 (CI: -24, -7), -14 (CI: -20, -7),
respectively (Figure 2b). In the multivariable model, the effect of HIV RNA load on CD4+ T lymphocytes kinetics did not remain statistically significant (Table 3).
Effect of other baseline factors
Other baseline variables associated with the CD4+ T-lymphocyte level at baseline and during follow-up included the CD8+ T-lymphocyte percentage, the percentage of activated CD4+ DR+ T-lymphocytes, myeloid and lymphoid dendritic cell levels (Table 3). The higher the CD4+ DR+ T-lymphocyte counts and dendritic cells levels (both types) were, the higher the initial CD4+ T-lymphocyte level was (p=0.03, 0.002 and 0.04, respectively) and the steeper the CD4+ T-lymphocyte count decline at M1 was (p=0.04, 0.02 and 0.01, respectively). The higher the CD8+ T-lymphocyte percentage was, the lower the initial CD4+ T-lymphocyte level was (p=0.002) and the blunter the CD4+ T-lymphocyte count decline was at M1 (p=0.03). Assuming that mobilization and/or the effect of some cell subsets is correlated to the viral load, we looked at the possible association of these cell subsets with the CD4+ T-lymphocyte count taking into account the HIV RNA level. After adjustment for the baseline HIV RNA level only, the effects of the CD4+ DR+ T-lymphocyte count and myeloid dendritic cells remained unchanged (variation of estimations less than 20%). However, the strength of the effect of the CD8+ T-lymphocyte percentage and the effect of the lymphoid dendritic cells on CD4+ dynamics was decreased (Table 3). In the full multivariable model, the effects which remained significant were: the effect of myeloid dendritic cells on the CD4+ baseline (+19.5 cells/mm3 per 103 cells/mL higher, p=0.001) and the first slope (-10.7
cells/mm3/month, p=0.03), the effect of CD4+ DR+ T-lymphocyte count on the first CD4+
slope (-28 cells/mm3/month per 1% CD4+ DR+ higher, p=0.05).
Dynamics of other markers
Plasma HIV RNA load increased from a median of 1.9 log10 copies/mL (1.7, 3.3) at
baseline to 4.4 log10 copies/mL (3.7, 4.8) at M1 and 4.6 (4.4, 4.9) at M12. The change in HIV
RNA load followed a biphasic kinetic similar to that of CD4+ T-lymphocyte as described above with a breakpoint at one month. The estimated first month increase was of 1.92 log10
copies/mL/month (CI: 1.58; 2.26). Thereafter, the HIV RNA load remained stable (0.015 copies/mL/month, CI: -0.0065; 0.036).
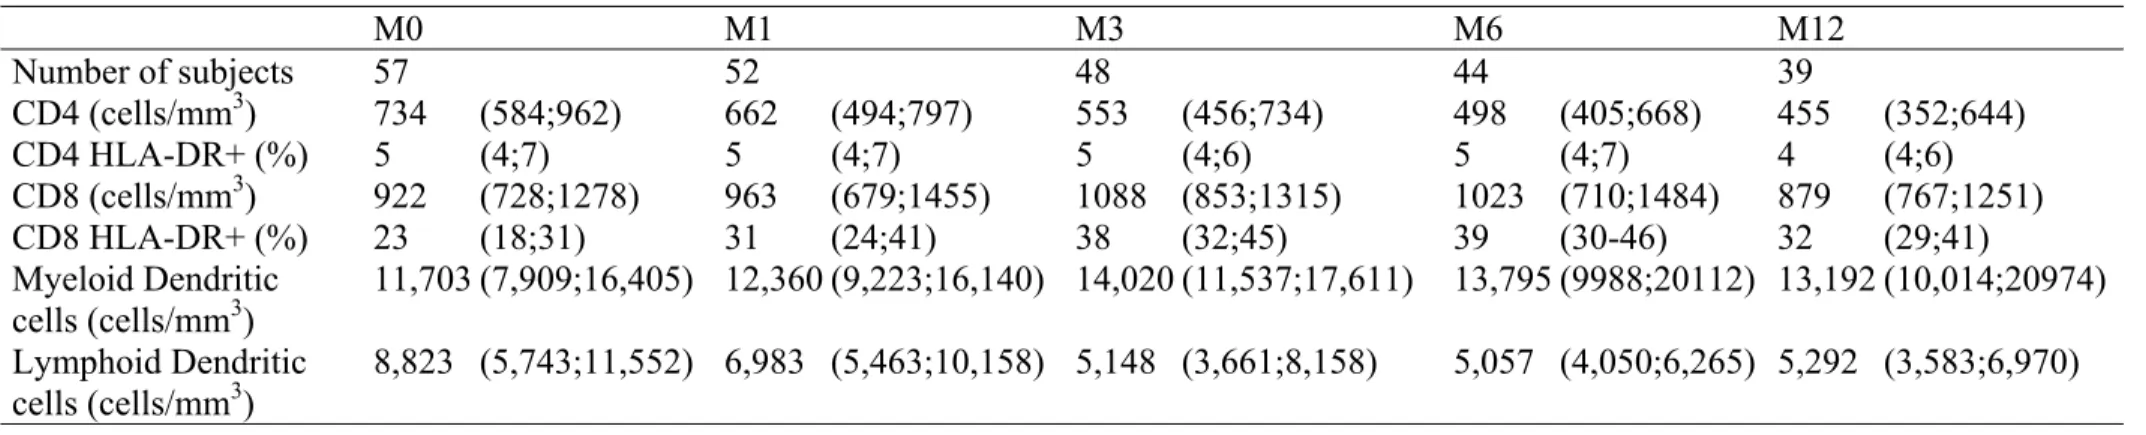
Immunological response to treatment interruption was also explored through modifications in activated cell subsets and dendritic cells (Table 2). Whereas the levels of CD4+ DR+ T-lymphocytes and of myeloid dendritic cells tended to be stable during the first month, the percentages of CD8+ and activated CD8+ DR+ T-lymphocytes subsequently increased with a median slope of 2.8 %/month (IR: 0.20; 5.8) and 4.9 %/month (IR: 1.21;11.1), respectively. In the meantime, we observed a median decline in the lymphoid dendritic cell level of -1156 cells/mm3/month (IR: -3853; 1815).
Joint change in markers
The CD4+ T-lymphocyte count drop observed in the first month following treatment interruption was negatively correlated with the increases in HIV RNA load (r=-0.64, p<10-4),
the CD8+ T-lymphocyte percentage (r=-0.53, p<10-4), the activated CD8+ DR+
T-lymphocyte percentage (r=-0.56, p<10-4) and positively correlated with the decline in
The decline in lymphoid dendritic cells was itself negatively correlated with the HIV RNA load, the CD8+ T-lymphocyte percentage and the activated CD8+ DR+ T-lymphocyte percentage increases (r=-0.53, r=-0.32, r=-0.47, all p values <0.05) indicating a link between the number of lymphoid dendritic cells and the viral load which in itself would foster CD8+ T-lymphocytes activation and proliferation. The first month slopes of HIV RNA load, activated CD4+ DR+, CD8+, activated CD8+ DR+ T-lymphocyte percentages and lymphoid dendritic cells did not seem to influence the CD4+ T-lymphocyte count slope significantly after one month until month 12 (p=0.31, 0.40, 0.87, 0.75, 0.97, respectively) which probably represents a situation where all variables are in equilibrium.
Predictors of antiretroviral treatment resumption
Reasons for resumption of antiretroviral treatment by 12 months (n=8) were: patient’s decision (n=3), occurrence of primo-infection symptoms such as thrombocytopenia (n=2), rapid decrease in CD4 count below 300 cells/mm3 (n=3). The time elapsed till treatment
resumption was not significantly different according to HIV RNA load zenith (p=0.11), CD4+ T-lymphocyte level at M0 (p=0.12) or HIV RNA at M0 (p=0.34). The only factor, measured at M0 or before, significantly associated with the time to resumption of the antiretroviral treatment was the CD4+ nadir (p<10-3). All patients resuming their treatment presented a
CD4+ nadir less than 256 cells/mm3 (first tertile). The Kaplan-Meier plot is shown in Figure
Discussion
In this study of the modifications in markers after long-term supervised treatment interruption in chronically HIV-1 infected patients, the change in CD4+ count took place in two phases: a first steep decrease in the first month (-142 cells/mm3 on average), followed by
a smooth decline (-17 cells/mm3 on average) as recently reported in another study [23].
According to baseline CD4+ and HIV RNA levels, our estimations of short term [9, 16, 23] and long term [11, 12, 16] CD4+ changes are similar to other studies as is also the case for HIV RNA [8, 15, 16].
Interestingly, the second slope of CD4+ T-lymphocyte decline was not correlated with the first and no factor but baseline HIV RNA influenced this second slope. As a consequence, the CD4+ level at the end of the 12-month follow-up was mainly determined by the baseline level and CD4+ modification during the first month. This finding implies that the management of supervised treatment interruption in chronically infected patients should be re-evaluated at one month. Furthermore, the decline in CD4+ during the first period may be anticipated, as it was steeper in patients with higher baseline CD4+ and lower HIV RNA levels. This result is in agreement with all previously published studies [9, 11, 13] but one [12]. Moreover, for a given CD4+ level at the time of treatment interruption, the decline was less pronounced in patients with a CD4+ nadir above 350 cells/mm3. This effect is much
greater than the baseline HIV RNA effect. In fact, patients with lower baseline HIV RNA presented higher baseline CD4+ and steeper short-term decline leading to comparable CD4+ levels at one month (Figure 2b). However, those with a CD4+ nadir <350 cells/mm3 presented
similar baseline CD4+ but their short term decline was greater (-134 cells/mm3/month lower).
Therefore, when antiretroviral treatment interruption is under consideration, the decision should take into account the CD4+ nadir. Moreover, this result underlines that, in addition to
poor CD4+ T lymphocyte restoration under treatment [24, 25], the CD4+ decline after treatment interruption is greater in patients having already experienced a more pronounced HIV-CD4+ cell depletion, although this finding is in discrepancy with the study published by Tebas et al. [11]. The importance of the CD4+ nadir on CD4+ T lymphocytes kinetics after treatment interruption in chronically infected patients has also been reported recently [16] and is likely to reflect the extend of T-lymphocyte repertoire contraction and the difficulty associated with restoring sufficient diversity after HAART initiation. Thus, this information should be integrated in the decision-making process on when to initiate antiretroviral treatment since reaching a value of less than 350 cells/mm3 may compromise the immune
response after subsequent treatment interruption.
One of the aims of our study was to analyse the dynamic and the links potentially existing between several immunological factors particularly in the first month after treatment interruption. As expected, a higher proportion of activated CD4+ T-lymphocytes at baseline was associated with a steeper decrease in the CD4+ T-lymphocyte count, the half-life of such cells being very short [26]. The adjustment for plasma HIV RNA level modified slightly the effect of activated CD4+ T-lymphocyte count reflecting the fact that the activation process is not only mediated through antigenic stimulation [27]. If the activated CD8 DR+ lymphocyte count at baseline did not significantly influence the change in CD4+ T-lymphocyte count, the dynamics of the CD8+ DR+ T-T-lymphocyte count was positively correlated with the viral RNA load increase and the CD4+ T-lymphocyte count decrease as has been reported in patients undergoing antiretroviral treated [28]. A higher percentage of the CD8+ T-lymphocyte count, as a surrogate marker for the CTL antiviral response, was associated with a slower decline in CD4+ T-lymphocyte count and seems to be closely associated with the magnitude of antigenic stimulation measured by the plasma HIV RNA
level as its effect on CD4+ T-lymphocyte was not independent. This result is in agreement with those reported in treated patients where the partial antigenic stimulation due to intermittent viremia or persistent low levels of HIV RNA leads to an effective HIV-specific T cell response [29]. This idea was first described in the context of acute infection [5]. However, some authors have claimed that, although interrupting drug therapy can boost the HIV-specific CD8+ T cell response, the immune response is limited because of a lack of cytotoxic T-cell diversity, leading to poor control of virus production [30, 31]. In our study, we observed high levels of HIV viral load despite an increase in activated CD8+ T cells.
The effects of the different dendritic precursor cells on CD4+ count modification were similar. However, this effect seems to be associated partly with HIV RNA load for lymphoid but not for myeloid dendritic cells. The dynamics of each differed: myeloid dendritic cell counts were stable whereas lymphoid dendritic cell counts tended to decrease in association with CD4+ T-lymphocytes and in negative correlation with the HIV RNA load slope. In summary, although the influences of baseline myeloid and lymphoid dendritic cells on changes in the CD4+ T-lymphocyte count were comparable, the mechanism through which they are involved is more directly linked to the magnitude of the antigenic stimulation for the lymphoid subset than for myeloid cells. This is in agreement with a negative correlation between lymphoid and HIV RNA load reported elsewhere [32]. Therefore, the decrease in the number of circulating lymphoid dendritic cells with disease progression, which is presumably associated with a decrease in IFN alpha production, should contribute to the lack of HIV virus control [20]. Taken together, these data suggest that lymphoid DC are directly involved in the antiviral response probably through secretion of IFN alpha and through the specific CD8 T cell response [33], whereas myeloid DC seem to be more involved in the dissemination of the infection probably because of their unique DC-Sign expression.
In conclusion, treatment interruption in patients with a CD4+ T-lymphocyte count above 400 cells/mm3 is followed by a substantial increase in plasma HIV RNA load and a decline in the
CD4+ T-lymphocyte count within the first month. Thereafter, there is a nearly steady state in those patients who do not resume their therapy during 12-month follow-up. The nadir of the CD4+ T-lymphocyte count before treatment interruption exerted a major influence on the level of CD4+ T-lymphocyte count reached after one month and therefore on the probability of resuming therapy. This information should become one of the criteria taken into consideration when deciding on treatment interruption, at least in patients above 400 CD4+ T-lymphocytes/mm3 and should stimulate further research to evaluate strategies allowing at
further increase in the CD4+ cell count before interruption. The monitoring of DC cells should be considered on longer follow up to increase our understanding of the complex relationship between the virus and different DC subsets in vivo.
References
1. Chun TW, Fauci AS. Latent reservoirs of HIV: obstacles to the eradication of
virus. Proc Nat Acad Sci Usa 1999, 96:10958-10961.
2. Miller V. Structured treatment interruptions in antiretroviral management of HIV-1. Curr Opin Infect Dis 2001, 14:29-37.
3. Lori F, Lisziewicz J. Structured treatment interruptions for the management of
HIV infection. JAMA 2001, 286:2981-2987.
4. Ruiz L, Martinez-Picado J, Romeu J, et al. Structured treatment interruption in
chronically HIV-1 infected patients after long-term viral suppression. AIDS 2000, 14:397-403.
5. Rosenberg ES, Altfeld M, Poon SH, et al. Immune control of HIV-1 after early
treatment of acute infection. Nature 2000, 407:523-526.
6. Garcia F, Plana M, Ortiz GM, et al. The virological and immunological
consequences of structured treatment interruptions in chronic HIV-1 infection.
AIDS 2001, 15:F29-F40.
7. Ruiz L, Carcelain G, Martinez-Picado J, et al. HIV dynamics and T-cell immunity
after three structured treatment interruptions in chronic HIV-1 infection. AIDS
2001, 15:F19-27.
8. Neumann AU, Tubiana R, Calvez V, et al. HIV-1 rebound during interruption of
highly active antiretroviral therapy has no deleterious effect on reinitiated treatment. AIDS 1999, 13:677-683.
9. Youle M, Janossy G, Turnbull W, et al. Changes in CD4 lymphocyte counts after
interruption of therapy in patients with viral failure on protease inhibitor-containing regimens. Royal Free Centre for HIV Medicine. AIDS 2000,
10. Ortiz GM, Wellons M, Brancato J, et al. Structured antiretroviral treatment
interruptions in chronically HIV-1-infected subjects. Proc Nat Acad Sci Usa 2001, 98:13288-13293.
11. Tebas P, Henry K, Mondy K, et al. Effect of prolonged discontinuation of
successful antiretroviral therapy on CD4+ T cell decline in human immunodeficiency virus-infected patients: implications for intermittent therapeutic strategies. J Infect Dis 2002, 186:851-854.
12. Mussini C, Bugarini R, Perno CF, et al. Kinetics of CD4 cells after discontinuation
of antiretroviral therapy in patients with virological failure and a CD4 cell count greater than 500 cells/mu l. AIDS 2002, 16:1551-1554.
13. Tarwater PM, Parish M, Gallant JE. Prolonged treatment interruption after
immunologic response to highly active antiretroviral therapy. Clin Infect Dis
2003, 37:1541-1548.
14. Fischer M, Hafner R, Schneider C, et al. HIV RNA in plasma rebounds within days
during structured treatment interruptions. AIDS 2003, 17:195-199.
15. Eriksson LE, Falk KI, Bratt GA, Leandersson AC, Wahren B, Leitner T. HIV type 1
DNA development during long-term supervised therapy interruption. Aids Res
Hum Retrovirus 2003, 19:259-265.
16. Maggiolo F, Ripamonti D, Gregis G, Quinzan G, Callegaro A, Suter F. Effect of
prolonged discontinuation of successful antiretroviral therapy on CD4 T cells: a controlled, prospective trial. AIDS 2004, 18:439-446.
17. Geijtenbeek TB, Kwon DS, Torensma R, et al. DC-SIGN, a dendritic cell-specific
HIV-1-binding protein that enhances trans-infection of T cells. Cell 2000, 100:587-597.
18. Soumelis V, Scott I, Gheyas F, et al. Depletion of circulating natural type 1
interferon-producing cells in HIV-infected AIDS patients. Blood 2001,
98:906-912.
19. Grassi F, Hosmalin A, McIlroy D, Calvez V, Debre P, Autran B. Depletion in blood
CD11c-positive dendritic cells from HIV-infected patients. AIDS 1999,
13:759-766.
20. Teleshova N, Frank I, Pope M. Immunodeficiency virus exploitation of dendritic
cells in the early steps of infection. J Leukoc Biol 2003, 74:683-690.
21. Thiébaut R, Morlat P, Jacqmin-Gadda H, et al. Clinical progression of HIV-1
infection according to the viral response during the first year of antiretroviral treatment. AIDS 2000, 14:971-978.
22. Le Moing V, Thiébaut R, Chêne G, et al. Predictors of long-term increase in
CD4(+) cell counts in human immunodeficiency virus-infected patients receiving a protease inhibitor-containing antiretroviral regimen. J Infect Dis 2002,
185:471-480.
23. Fagard C, Ananworanich J, Le Braz M, et al. Biphasic Decline of CD4 Cell Count
during Scheduled Treatment Interruptions. 11th Conference On Retroviruses and
Opportunistic Infections. San Francisco, February 8-11, 2004.
24. Markowitz N, Bebchuk JD, Abrams DI. Nadir CD4(+) T cell count predicts
response to subcutaneous recombinant interleukin-2. Clin Infect Dis 2003, 37:E115-E120.
25. Lange CG, Lederman MM, Medvik K, et al. Nadir CD4+ T-cell count and numbers
of CD28+ CD4+ T-cells predict functional responses to immunizations in chronic HIV-1 infection. AIDS 2003, 17:2015-2023.
26. Perelson AS, Essunger P, Cao Y, et al. Decay characteristics of HIV-1-infected
compartments during combination therapy. Nature 1997, 387:188-191.
27. Cohen Stuart JW, Hazebergh MD, Hamann D, et al. The dominant source of CD4+
and CD8+ T-cell activation in HIV infection is antigenic stimulation. J Acquir
Immune Defic Syndr 2000, 25:203-211.
28. Hunt PW, Deeks SG, Rodriguez B, et al. Continued CD4 cell count increases in
HIV-infected adults experiencing 4 years of viral suppression on antiretroviral therapy. AIDS 2003, 17:1907-1915.
29. Ortiz GM, Hu J, Goldwitz JA, et al. Residual viral replication during antiretroviral
therapy boosts human immunodeficiency virus type 1-specific CD8(+) T-cell responses in subjects treated early after infection. J Virol 2002, 76:411-415.
30. Autran B, Carcelain G. AIDS. Boosting immunity to HIV--can the virus help?
Science 2000, 290:946-949.
31. Oxenius A, Price DA, Gunthard HF, et al. Stimulation of HIV-specific cellular
immunity by structured treatment interruption fails to enhance viral control in chronic HIV infection. Proc Nat Acad Sci Usa 2002, 99:13747-13752.
32. Beaumont T, Hoh R, Deeks S, McCune JM. High Numbers of Functional
Pre-Dendritic Cells Type 2 Are Maintained in Patients with Non-Progressive HIV Disease. 11th Conference On Retroviruses and Opportunistic Infections. San
Francisco, February 8-11, 2004.
33. Salio M, Cella M, Vermi W, et al. Plasmacytoid dendritic cells prime
IFN-gamma-secreting melanoma-specific CD8 lymphocytes and are found in primary melanoma lesions. Eur J Immunol 2003, 33:1052-1062.
Table 1. Patient’ characteristics at the time of treatment interruption (N=57).
Characteristics at the time of treatment interruption Distribution
Female, n (%) 16 (28)
Median age in years (IQR) 44 (39-51)
Hepatitis status:
Hepatitis B: Ag HbS positive, n (%) 4 (7)
Hepatitis C: Hepatitis C virus antibody positive, n (%) 10 (19) Median time from first antiretroviral regimen in years (IQR) 6.0 (4.2-7.5) Median time from first HAART regimen in years (IQR) 4.2 (3.4-5.6) Median number of antiretroviral regimens (IQR) 3 (2-4) HAART as first antiretroviral regimen, n (%) 35 (66) Regimen at the time of treatment interruption, n (%)
Two NRTIs 10 (20)
Three NRTIs 9 (18)
Two nucleosides and one PI 5 (10)
Two nucleosides and one NNRTI 19 (38)
Other 7 (14)
Plasma HIV RNA < 1.7 log10 copies/mL, n (%) 28 (49)
Median time since first undetectability in months (IQR) 40 (30-54) Median zenith of plasma HIV RNA in log10 copies/mL (IQR) 4.24 (3.59-4.74)
Median CD4+ gain while treated by the last ARV regimen (IQR) 315 (107-477)
Median nadir of CD4+ cell count (IQR) 346 (234-483)
IQR: Interquartile range, HAART: Highly active antiretroviral therapy, PI: Protease
inhibitors, NRTI: nucleoside reverse transcriptase inhibitor, NNRTI: non-nucleoside reverse transcriptase inhibitor, ARV: antiretroviral
Table 2. Evolution of immunological markers values (median, interquartile range) from treatment interruption (M0), one month after (M1), three months (M3), and every 3 months up to 12 months (M12).
M0 M1 M3 M6 M12 Number of subjects 57 52 48 44 39 CD4 (cells/mm3) 734 (584;962) 662 (494;797) 553 (456;734) 498 (405;668) 455 (352;644) CD4 HLA-DR+ (%) 5 (4;7) 5 (4;7) 5 (4;6) 5 (4;7) 4 (4;6) CD8 (cells/mm3) 922 (728;1278) 963 (679;1455) 1088 (853;1315) 1023 (710;1484) 879 (767;1251) CD8 HLA-DR+ (%) 23 (18;31) 31 (24;41) 38 (32;45) 39 (30-46) 32 (29;41) Myeloid Dendritic cells (cells/mm3) 11,703 (7,909;16,405) 12,360 (9,223;16,140) 14,020 (11,537;17,611) 13,795 (9988;20112) 13,192 (10,014;20974) Lymphoid Dendritic cells (cells/mm3) 8,823 (5,743;11,552) 6,983 (5,463;10,158) 5,148 (3,661;8,158) 5,057 (4,050;6,265) 5,292 (3,583;6,970)
Table 3. Effect of immunological and virological markers at the time of treatment interruption on mean CD4+ level at this time, on the first slope during the first month following treatment interruption and on the second slope after one month to 12 months. Mixed effects models accounting for correlation between measurements of a single subject.
Factorsa at treatment interruption Univariable models Multivariable model Effect (p value) on average Effect (p value) on average
Level at interruption First slope per month Second slope per month Level at interruption First slope per month Second slope per month
bCD4+ count nadir <350 cells/mm3 vs. ≥ 350 cells/mm3 -45.0 (0.56) -134.3 (0.04) -0.54 (0.91) -10.5 (0.89) -161.8 (0.02) 6.8 (0.27) cHIV RNA (for 1 log
10 copies/mL higher) -66.4 (0.09) 102.2 (<10-3) -5.7 (0.01) - - - cHIV RNA: > 3.3 log
10 copies/mL 1.7-3.3 log10 copies/mL <1.7 log10 copies/mL Ref (0.07) -44.2 148.3 Ref (0.008) -62.7 -215.0 Ref (0.15) 8.6 11.0 Ref (0.59) -100.4 -125.8 Ref (0.67) 13.1 -56.2 Ref (0.26) 14.7 18.9
dPercentage of CD8+ (for 1% higher) -11.3 (0.002) 6.7 (0.03) 0.01 (0.96) -0.53 (0.93) -4.7 (0.39) 0.58 (0.28)
CD4 DR+ count (for 1% higher) 28.0 (0.03) -23.1 (0.04) 0.07 (0.93) 19.0 (0.25) -28.9 (0.05) 1.05 (0.46) CD8 DR+ count (for 1% higher) -6.6 (0.11) 6.7 (0.07) -0.09 (0.76) -10.8 (0.08) 9.1 (0.13) 0.31 (0.64) Myeloid Dendritic cells (for 103 cells/mm3 higher) 14.3 (0.002) -9.7 (0.02) 0.004 (0.99) 19.5 (0.001) -10.7 (0.03) -0.46 (0.28)
eLymphoid Dendritic cells (for 103 cells/mm3 higher) 18.4 (0.04) -19.5 (0.01) 0.92 (0.14) 2.63 (0.79) -7.29 (0.41) 0.78 (0.35)
a. Age, gender, hepatitis co-infection, HIV RNA zenith, whether the first antiretroviral treatment was HAART or not, absolute CD8 count had no significant effect either on level at interruption or on slopes (p>0.20).
b. Effect when adjusting only for HIV RNA: -59.7 (0.44) on baseline, -127.3 (0.03) on first slope, 0.81 (0.86) on second slope. c. The model fitting HIV RNA into categories was better that on a continuous scale (AIC 3565 vs. 3595, respectively).
d. Effect when adjusting only for HIV RNA: -18.2 (<10-4) on baseline, 3.7 (0.3) on first slope, 0.48 (0.08) on second slope.
e. Effect when adjusting only for HIV RNA: 15.1 (0.12) on baseline, -13.6 (0.10) on first slope, 0.67 (0.32) on second slope. ARV: Antiretroviral, PBMC: Peripheral Blood Mononuclear Cells
Figure 1. Mean and 95% confidence interval of observed and predicted CD4+ cell count after treatment interruption. Predictions were carried out using a piecewise linear mixed model assuming a common change point at one month.
0 200 400 600 800 1000 0 3 6 9 Time (months)
CD4+ cell count (cells/mm
3 )
12
Figure 2. Mean and 95% confidence interval of predicted CD4+ cell count according to HIV RNA load category (<1.7, between 1.7 and 3.3 and > 3.3 log10 copies/mL) at the time of treatment interruption (a) or CD4+ nadir < or ≥350 cells/mm3 (b).
0 100 200 300 400 500 600 700 800 900 1000 0 1 2 3 4 5 6 7 8 9 10 11 12 Time (months) Nadir >350 Nadir < 350 (a) 0 200 400 600 800 1000 1200 0 1 2 3 4 5 6 7 8 9 10 11 12 Time (months)
Log HIV RNA<1.7 Log HIV RNA>3.3 Log HIV RNA 1.7-3.3 (b)
Figure 3. Kaplan Meier plot (and 95% confidence interval bounds in dashed lines) of time to antiretroviral therapy resumption for subjects with a CD4+ lymphocytes T nadir (lower value throughout follow-up before treatment interruption) between 60 and 256 cells/mm3 (first tertile) accounting for 8 events on 18 subjects. No patient restarted therapy in the two other categories: [260;425] and [427;720].
Proportion without treatment 0 10 20 30 40 50 60 70 80 90 100 Time (months) 0 1 2 3 4 5 6 7 8 9 10 11 12