MITLIBRARIES
3
9080 02618 1377
"^-iiiuiLmuiijIiuliL H!i^mi!n'-ip;-^;.iin.T i(;n!!iw:;!;ifn:!'';jii'' HiiiiiRllHi'.tiSi'li;:-i'.i5ii!'.niH'"n;n'.V'!inawtftrHMi»!i!HB31
:.M415
no.06-29
2006
PpH
Digitized
by
the
Internet
Archive
in
2011
with
funding
from
Boston
Library
Consortium
IVIember
Libraries
DEWEy
HB31
.M415
Y] .o(f~
Massachusetts
Institute
of
Technology
Department
of
Econonnics
Working
Paper
Series
THE
ECONOMIC
LIVES
OF
THE
POOR
Abhijit
V.
Banerjee
Esther
Duflo
Working
Paper
06-29
October
31,
2006
Room
E52-251
50
Memorial
Drive
Cambridge,
MA
021
42
This paper can be
downloaded
without charge from theSocial Science Research
Network
Paper Collection atMASSACHUSETTS
INSTITUTEOF
TECHNOLOGY
NOV
9 20Q6The Economic
Livesof
thePoor
AbhijitV. Banerjee
and
EstherDufloOctober
2006
Abstract
This paper uses survey data
from
13 countries todocument
theeconomic
lives ofthe poor (those livingon
less than $2 dollarperday
per capita atpurchasingpower
parity ) or the extremelypoor
(those livingon
less than $1 dollar per day).
We
describe theirpatterns of
consumption
and
income
generation as well as their access to marketsand
publicly providedinfrastructure.
The
paper concludes with a discussionof
some
apparentanomalous
choices. JEL:010,015,016.
Keyword:
Poverty,Development,
Consumption
ChoicesAbhijitV. Banerjee
and
EstherDuflo
areboth Professorsof
Economics and
Directors oftheAbdul
LatifJameel Poverty Action Lab, Massachusetts InstituteofTechnology,
Cambridge,
In
what
turned outto be arhetoricalmaster-move,the1990
World
Development Report
from
theWorld
Bank
definedthe "extremely poor" peopleoftheworld
as thosewho
arecurrentlyliving
on no
more
than $1 perday
per person,measured
atthe 1985 purchasingpower
parity (PPP)exchange
rate.'Even
thoughtherehave
alwaysbeen
poverty lines— indeedone
dollarperday
was
chosen
inpartbecause ofits proximitytothepovertylines usedby
many
poor
countries'—this particularone
hascome
todominate
theconversations aboutpovertyin aparticularly stark
way.
But
how
actuallydoes one liveon
less thanone
dollarperday?
Thisessay isabout theeconomic
lives ofthe extremelypoor: thechoices they face, the constraintsthey grapple with,and
thechallenges they meet.The
availableevidenceon
theeconomic
livesoftheextremelypoor
is incomplete inmany
important ways.However,
anumber
ofrecent datasetsand
abody
ofnew
researchhave
added
a lottowhat
we know
about theirlives,and
takentogether thereis probablyenough
tostartbuilding an
image of
theway
they live theirlives.Our
discussion oftheeconomic
livesof
theextremelypoor
buildson
householdsurveys
conducted
in 13 countries listed inTable 1:Cote
d'lvoire,Guatemala,
India, Indonesia,Mexico,
Nicaragua, Pakistan,Panama, Papua
New
Guinea, Peru, SouthAfrica, Tanzania,and
Timor
Leste.We
mainly
usethe Living StandardMeasurement
Surveys
(LSMS)
conducted
by
the
World
Bank
and
the"Family
Life Surveys"conductedby
theRand
Corporation, all ofwhich
are publiclyavailable. Inaddition,we
also usetwo
surveys thatwe
conductedinIndiawith ourcollaborators.
The
firstwas
carried out in2002
and2003 in 100hamlets ofUdaipurDistrict,Rajasthan (Baneijee, Deaton, Duflo, 2004). Udaipuris one ofthepoorerdistrictsofIndia,
with a largetribal populationandanunusually high level offemaleilliteracy (atthe timeofthe
1991 census, only5 percent of
women
were
literate inrural Udaipur).The
second(Banerjee, Duflo, Glermerster, 2006) surveyed2,000households in"slums" (orinformalneighborhoods) ofHyderabad, the capital ofthestate of
Andhra
Pradesh and oneoftheboom-towns
ofpost-liberalization India.
We
chosethesecountriesand
surveysbecause theyprovidedetailedinformation
on
extremely poor householdsaround
theworld,from
AsiatoAfricato LatinAmerica,
including informationon what
theyconsume,
where
theywork,and
how
theysaveand
borrow.To
flesh out ourmain
themes
fiarther,we
alsodraw
freelyon
the existingresearchliterature.
From
each ofthese surveyswe
identifiedthe extremelypoor
asthose living inhouseholds
where
theconsumption
percapita isless than $1.08 perpersonper day, aswell asthemerely "poor" definedas those
who
live under $2.16 aday
usingthePPP
inyear 1993 asbenchmark.^
The
useof consumption,ratherthanincome, ismotivatedby
thebetterqualityof
the
consumption
data inthese surveys (Deaton,2004). Table 1 providessome
background
infomiation
on
these surveys. It liststhecountries,and
the sourceofthe surveydata. It alsoliststhe
sample
sizes: thenumbers and
theproportions ofthe extremelypoor
and
thepoor in' In
1993, thepovertylinewasupdatedto$1.08perpersonperdayatthe 1993PPPexchangerate (thisistheline
we
usein thispaper).^Forexample,the"All IndiaRural" povertylineusedbytheIndianPlanning Commission was Rs328perperson
permonth,or$32in PPPdollarsin 1999/2000.
each survey.
The
fraction ofindividuals living under$1 dollarperday
in the survey varyfrom
2percent in
Panama
to47
percentinUdaipur,and
the fraction living under $2 perday
variesfrom
6 percentinPanama
to 86 percentinUdaipur. All thenumbers
discussedin this paperare availablein theappendix.There are
many
importantissues with ouridentification ofthe poor. First,purchasingpower
parityexchange
rates,which
are essential tocompute
a "uniform" povertyline,have
been
criticized as inadequate, infrequentlyupdated,and
inapplicableto theconsumption
oftheextremely
poor
(Deaton, 2004, 2006). Prices are typically higherinurbanthan inrural areas,and even
inrural areas, thepoor
may
pay
differentprices than everyoneelse. Also, reporting periods varysignificantlyfrom
survey to surveyand
this, ithasbeen shown,
systematicallyaffects
what
people report.These problems
may
affectuslessbecausewe
arenotfocusedon
countingthe exactnumber
ofpoor. In describingwhat
their lives looklike,misclassifying anumber
of
households should not
change
anythingvery important abouttheaverageswe
observeinthedata,unless the
number
affected areverylarge,and
thoseartificiallymoved
intooroutofpovertyareverydifferentthan theother poor. Itturns out that
most
of our conclusionsdo
notchange
ifwe
lookatthepoor
ratherthanthe extremelypoor,which
isof course reassuring.Nevertheless
one
cannot obviously entirely ruleout thepossibility that ourresultsmay
have
been
verydifferenthad
we
used
a differentpoverty line.We
will alsoassume
thatthepeoplewe
are describing as thepoor
are thelong-termpoor
in the sensethattheirpermanent
income
isactually closeto theirobserved consumption.If, instead, they
were
just transitingthrough poverty,some
ofthe behaviorsthatwe
willobserve (suchas lackofsavings)
would
be lesspuzzling,and
others (likethe lackofassets)would
bemuch
more
so.We
feel thatthisis a reasonableassumption
inmost
ofthe countries, since the fraction ofthe populationbelow
$2.16 aday
isactually sizeable (40percent ofthepopulation or
more
in themedian
countryand
more
than70
percentinquite afew)and
it isunlikelythatthere are quite so
many
transients.'*However,
for this reason, thepoor
inPanama
(where
only6percentofthepopulation ispoor) or South Africa (where 19percent are)may
notbe easily
compared
to thepoor
insome
oftheother countries,where
theyaremuch
more
numerous.
The
Living
Arrangements
of the
Poor
The
typical extremelypoor
family tendstobe
ratherlarge, atleastby
the standardsof
today'srich countries.
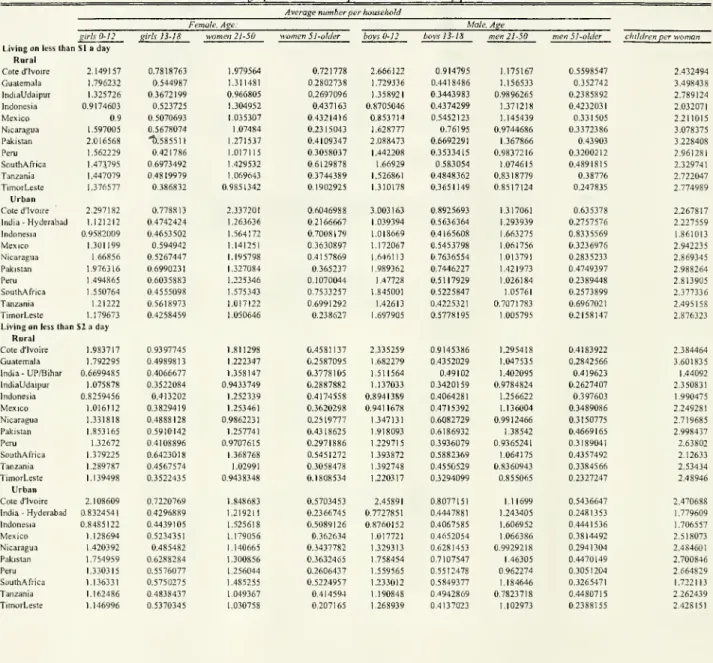
The number
of
familymembers
variesbetween
about 6and
about 12,with a
median
value (across the differentcountries) ofbetween
7and
8,compared
to 2.5 in the2000
U.S. census, forexample.Unfortunatelynot all surveys reportfertilityrates,
which
would
have been
the idealway
tocheck
how
much
of
thesehighnumbers
comes
from
the fact that here are a lotofchildren.
The
datadoeshowever
giveussome
broad
measures
oftheagestructure inthese"*The
extremely poorarelessnumerous, butas
we
observed above, our conclusionsare largelyindependentofthefamilies (the
number
ofthosebelow
13,between
13and
18,above
51, etc.).The
number
of
adults (i.e. those over 18) rangesfrom
about 2.5 toabout 5, withamedian
of about 3,which
suggests a family structurewhere
it iscommon
foradultsto live with people theyare not conjugally relatedto (parents, siblings,uncles, cousins, etc.). Thisis acommon
findingin theliterature
on
developingcountries,and
hasoftenbeen
relatedto the fact thatwhen
everypenny
counts, ithelpsto spreadthefixed costs ofliving (likehousing) overa larger
number
ofpeople. Consistent withthis view,
we
do
see a fallinfamily sizewhen we
go
from
theextremely
poor
to the entiregroup
below $2
a day, ofthe orderof one
halfofone
person ormore, though atleast
some
partofthiscomes
from
the fact thatthe extremelypoor
familieshave
more
children living*&with them.The
other fact isthat therearea largenumber
ofchildreninthese families. Thisdoesnot necessarily
imply
high levelsoffertility,as families oftenhave
multiple adultwomen.
When
we
lookatthenumber
ofchildren (ages to 18)perwoman
in thechild-bearing age(ages21-50)
we
getnumbers between
2and
4inboththeruraland
theurban sample,though
the urbanratiostendto be slightlylower.
These
would
notbe especiallyhigh iftheywere
actually fertilityrates,but they are
not—
forexample, a 51 year-old couldhave
a childwho
isnow
36,butwe
onlyinclude thosewho
arebelow
18.A
more
useful exercise withthis data isto
compare
thenumber
ofyoung
people (thosebelow
18) inthese families withthenumber
ofolderpeople (those
above
51).The
ratiovariesbetween
3and
9 in the ruralsample
withamedian of
6,and
between
2and
11 inthe urban sample, with amedian
once again ofaround
6.The
correspondingnumber
intheU.S. is around 1. This is averyyoung
population.One
reasonthe population isyoung
is that thereare alot ofyounger
people,which
reflectshigh fertility ifnot
now,
atleast inthe recentpast.A
second
reason isthat there areactuallyvery
few
olderpeople.The
ratio ofthenumber
olderpeople(overage 51)tothenumber
of people of "prime-age" (21-50) tendsto bebetween
0.2and
0.3 inboth the ruraland
theurban sample.
The
correspondingnumber
in the U.S., forexample, isapproximately 0.6.The
difference probablyowes
a lottothehighermortalityratesamong
thosewho
areolderand
poor
inpoor
countries,though
itis possiblethatolderpeople are underrepresentedin oursample because
they tendto be richer.However
inthe lattercase,we
might
have
expected tofind
more
oftheolderpeopleamong
thepoor
(ascompared
to the extremely poor),whereas
inthedata thereis
no
clear pattern.How
the
Poor
Spend
Their
Money
A
common
image
oftheextremelypoor
isthattheydo
not get tomake
many
realchoices. Indeedthere
must
besome
peoplewho
work
as hard astheycan—
which
may
notbeparticularly hard, becausethey areunderfed
and
weak
—
and
earn barelyenough
to covertheirbasic needs
which
theyalways
try to fulfill inthe leastexpensiveway.
Historically,povertylines in
many
countrieswere
originallysettocapture exactlythis definitionofpoverty—
atthebudget
needed
tobuy
a certainamount
ofcalories, plussome
other indispensable purchases(such as housing).
A
"poor" personwas by
definitionsomeone
withoutenough
toeat.Yet
the averagepersonlivingatunderSl perday
does notseem
toputevery availablepenny
intobuying
more
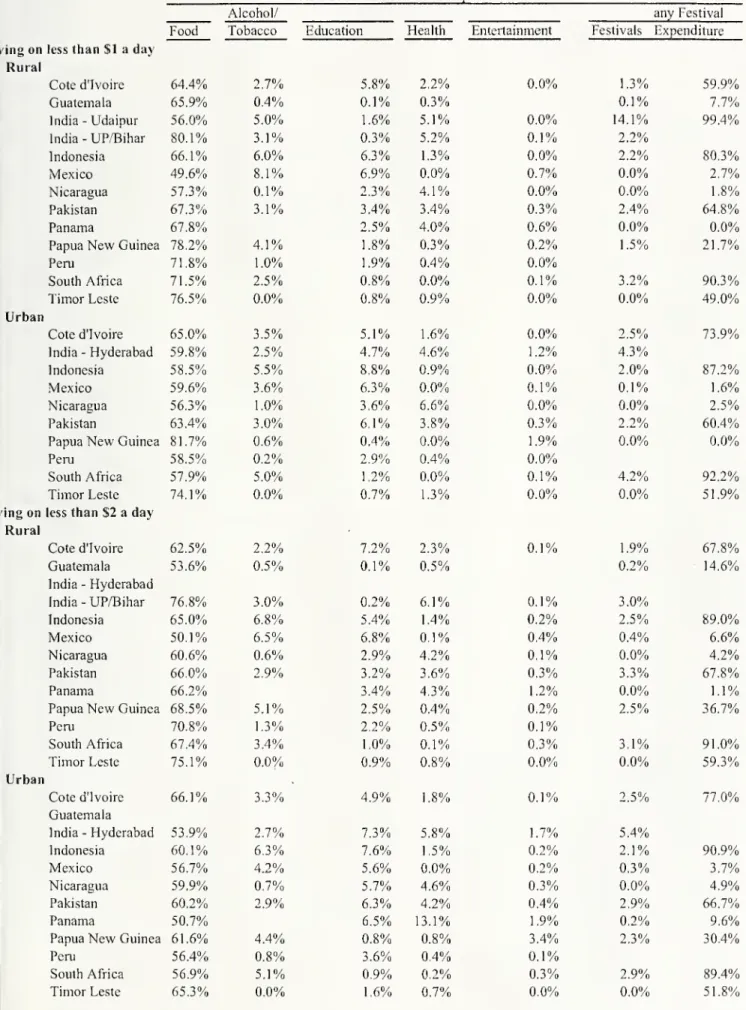
calories.Among
our 13 countries, foodtypically representsfrom 56
to78 percent
among
ruralhouseholds,and
56 to74
percentin urbanareas.For
theruralpoor
inMexico,
slightly lessthanhalfthebudget (49.6 percent) allocatedtopurchase food.^Of
course they couldbe spending therestof
themoney
on
othercommodities
which
they also greatly need.
Yet
among
thenon-food
items thatthepoor
spend
significantamounts
of
money
on, alcoholand
tobaccoshow
up
prominently.The
extremelypoor
in rural areas spent4.1 percentof
theirbudgeton
tobaccoand
alcohol inPapua
New
Guinea, 5.0 percentinUdaipur, India; 6.0percentin Indonesia
and
8.1 percentinMexico; though
inGuatemala,
Nicaragua,
and
Peru,no
more
than 1 percent ofthebudgetgets spenton
thesegoods
(possiblybecausethey prefer other intoxicants).
Perhaps
more
surprisingly, itisapparentthatspendingon
festivals is an importantpartof
thebudget formany
extremelypoor
households. InUdaipur, overthecourse ofthe previousyear,
more
than99
percentofthe extremelypoor
householdsspentmoney
on
awedding,
afuneral, or areligious festival.
The
median household
spent 10 percentofitsarmual budgeton
festivals. In SouthAfrica,
90
percentofthe households livingunder
$1 perday
spentmoney
on
festivals. InPakistan, Indonesia,
and Cote
d'lvoire,more
than 50 percentdid likewise.Only
insome
LatinAmerican
countries inoursample—
Panama,
Guatemala,Nicaragua—
are festivalsnot a notable partoftheyearlyexpenditure for asignificant fraction
of
thehouseholds.However
in theLSMS
surveys,unlike theUdaipur
survey,peopleare notaskedtoaccountseparately forthe foodthatthey
bought
because therewas
afestival. Itis thereforeprobablyno
accident thatthe
Udaipur
number
is thehighest across the surveys,and
there isreason tosuspectthat
LSMS
numbers
would
have
been
higherhad
thedatabeen
directlycollected inthose surveys.
On
the otherhand,theunder
$1 perday
householdsspend
very littleon
theforms ofentertainmentthat are
common
in richcountries, suchasmovies, theater, orvideo shows. Inall13 ofthe countries in our sample,inthe
month
precedingthe survey theaverage extremelypoor household
spentless than 1 percenton any
ofthese forms ofentertainment.The
comparable
number
for theUnited States is 5 percent.We
can only speculate aboutthe roots ofthis difference:
Has
the importance giventofestivalsand
otherindigenous formsof
Thefactthattheshare spenton food,whichisoftenseenasaphysiological necessity, varies somuchacross
countriesisitselfinteresting.Onepossibilityisthat thisrepresents the factthatthepoorhavemorechoiceinsome
countries thaninothers,becauseconsumption goodsarerelativelyarecheaperrelative tofoodinsomecountries.
For example, India,alarge economywithalonghistoryof beingrelativelyclosed,has evolvedalargemenuof low-costandlower-qualityconsumer goodsthatareproducedalmostexclusivelyforthedomestic market,
examplesinclude tooth-paste,cigarettes,andclothing.Othercountriesmustbuythesegoodsathigherpriceson
theglobalmarket. Ifthemanufacturedconsumer goodsthattheaverage personbuysin Indiatendtobe
inexpensiverelative to theirtraded counterparts, theratiobetweentheconsumption exchangerateatpurchasing
powerparityandtheofficialexchangerateoughttoberelativelylowinIndia. Moregenerally: thelowerthis ratio,thelowertheshareoftheconsumptionthatshould bemadeupoffood. Inourdata,itturnsoutthatthe
correlationbetweentheratioofthepurchasingpowerparityexchangerateforconsumptiontotheofficial
exchangerate in 1993andthe shareof expenditurespentonfoodis0.33amongthese 12 countries,althoughthis sampleisof coursetoosmallto supportdefiniteconclusion.
entertainment
crowded
outmovie-going, orit is lack ofaccess tomovie
theatresand
such, thatgives festivals theplace thatthey
occupy
in theirlives.The
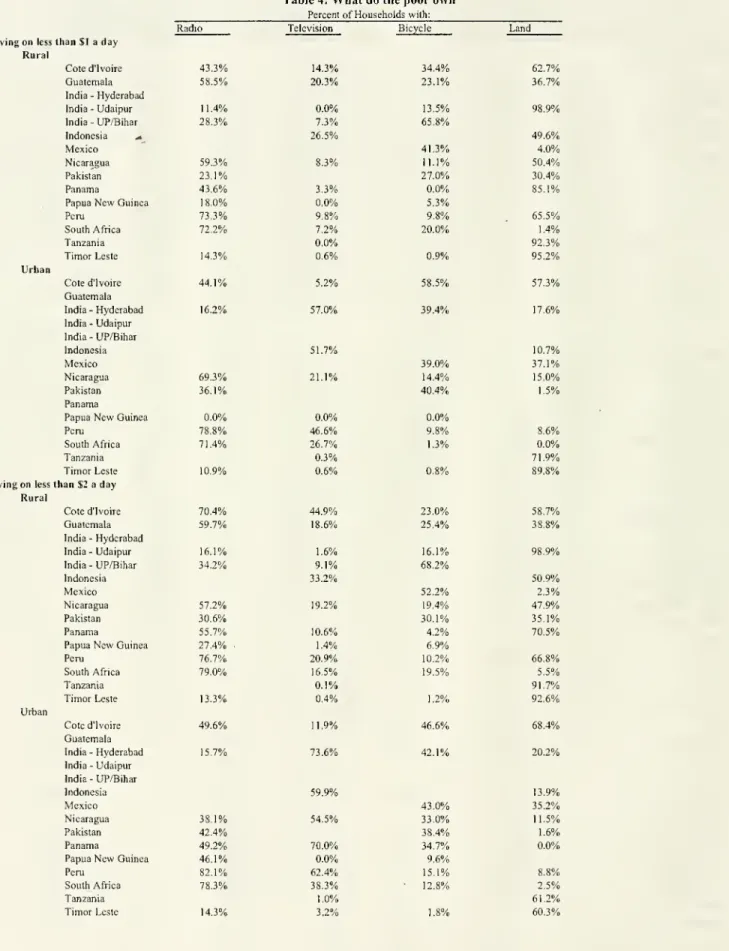
propensity toown
a radio or atelevision, awidespread
form
of entertainment forAmerican
households varies considerablyacross countries. For example,among
ruralhouseholds livingunder$1 per day,
ownership
ofaradio is 11 percentin theUdaipur
survey,almost
60
percent inNicaragua
and
Guatemala,and
above 70
percentin South Africaand
Peru.Similarly,
no one
owns
a televisionin Udaipur, butinGuatemala
nearly a quarterofhouseholds do,
and
inNicaragua, thepercentage is closerto a halfThese two
phenomena
appeartobe related. InUdaipur,where
the share spenton
festivals is the highest, radio
and
televisionownership
isvery low. InPakistan, the fractionspent
on
festivals is 3.3 percentand
only30
percenthave
aradio.By
contrast, inNicaragua
where
57percent ofthe rural poor households,respectively,have
a radioand
21 percentand
19percent
own
atelevision, veryfew
householdsreport spending anythingon
festivals.^One
wrinkle
on
this explanationis thatthe urbanpoor
who
aremuch
more
likely toown
a televisionthanthe rural
poor
(60 versus 33 percent in Indonesia, 61 versus 10 percentinPeru, 38 versus17percent in SouthAfrica),
do
notspend
lesson
festivals than theirruralcounterparts.While
this observationisbased
on
onlyafew
datapoints, ithintsatthe possibility of anunmet
demand
forentertainmentamong
the ruralpoor—
theywould
also like tobuy
atelevision, butperhaps the television signaldoes notreach theirneighborhoods.
Ineither case,it ishardtoescapetheconclusionthatthe
poor do
see themselvesashaving asignificant
amount
ofchoice,and
choose notto exercise itinthedirection ofspendingmore
on
food—
the typicalpoor
household
inUdaipur
couldspendup
to30 percentmore
on
food than itactuallydoes,justbased
on what
itspendson
alcohol, tobacco,and
festivals.Indeed
inmost
ofthe surveysthe share spenton
food isaboutthesame
forthepoor and
theextremely poor, suggestingthatthe extremely
poor
do
notfeel an extracompulsion
topurchasemore
calories.This conclusion echoes anold findinginthe literature
on
nutrition:Even
theextremelypoor
do
notseem
tobe ashungry
foradditional calories as onemight
expect.Deaton and
Subramanian
(1996), using 1983 datafrom
the Indian state of Maharashtra,found
thateven
forthe poorest, a 1 percentincrease
on
overallexpendituretranslates intoabout atwo-thirdsofapercent increase in thetotal food expenditure ofa
poor
family.Remarkably,
the elasticity isnotverydifferent forthepoorest individualsinthe
sample
and
the richest(althoughnobody
is particularlyrich inthis sample).The
Deaton and
Subramanian
estimate isone
ofthe higher estimates. Straussand
Thomas
(1997)found
an elasticityofdemand
for food withrespecttoexpenditure percapitaof about aquarterforthepoorestBrazilians.
Theultimatesourceofvariation heremight be therelativepricesofradiosandtelevisions. Thereisastrong
correlationbetweentheratioofthepurchasingpower exchange rateforconsumptionandtheofficialexchange
rateandtheprobabilitythatahouseholdownsa radio(thecorrelationis0.36). Thelogicisprobablyquitesimilar
to theargumentpresentedearlier inthecontextof foodconsumption(vizfootnote ?footnote 11?!1).Radiosare
tradable (theyareallmadeinChina). Sinceamongmanufactures,non-tradablegoodsare
much
lesscostlyinsomecountriesthanothers,whiletradedgoodstendtobemore similarly priced,peopleatthesame expenditure
Another
way
tomake
thesame
point is to lookatwhat
ediblestheextremelypoor
arebuying.
Deaton and Subramanian
(1996)note thatamong
grains, in terms ofcaloriesperrupee,themillets (jowar
and
bajra) are clearly the bestbuy.Yet
in theirdata,only abouttwo-thirdsofthetotal spending
on
grains ison
these grains,while another20
percentison
rice,which
costsmore
than twice asmuch
percalorie,and
aftirther 10 percent or so is spenton
wheat,which
isa
70
percentmore
expensiveway
to getcalories. In addition, thepoor spend
almost 7 percentoftheirtotalbudget
on
sugar,which
is bothmore
expensive than grains as asourceofcaloriesand
bereftofany
othernutritionalvalue.The same
affinity forsugaralsoshows up
in ourUdaipur
data:The
poor
spend
almost 10 percentoftheirfood budgeton
thecategory "sugar,salt
and
otherprocessed foods" (thisdoes not includecooking
oil,which
makes
up
another 6percentoftheexpenditures
on
food).Even
forthe extremelypoor, for every 1 percent increaseinthefoodexpenditure, abouthalfgoes intopurchasing
more
calories,and
halfgoesintopurchasing
more
expensive (andpresumably
better tasting) calories.Finally, tothe extent that
we
cantell, thetrendseems
tobe
tospend
even
lessmoney
on
food. InIndia, forexample
itwent from 70
percentin 1983 to 62 percent in 1999-2000,and
the share ofmillet inthe food budget
dropped
tovirtuallyzero (Deaton,2005).Not
surprisingly, the
poor
arealsoconsuming
fewercalories over time(Meenakshi and
Vishwanathan,
2003),though
it ispossible that thischange
reflectsthe fact theirwork
involveslessphysical effort(Jha,2004).
The Ownership of
AssetsWhile
all the surveyshave
some
information aboutassets, thelistofassets varies.To
obtaina relatively coherent listacross countries,
we
focuson
radios, televisions,and
bicycles.The
share of peoplewho own
theseparticular assets varies significantly across countries.As
we
already discussed,ownership
ofradioand
television varies a lotfrom
countrytocountry,butis
low
in severalofthose countries.One
reasonmay
be
thelack ofsignal.The
other
may
be thatitis noteasytobuy
a television ifyou
are extremelypoor: It isan expensiveand
lumpy
transactionthatone
hasto saveup
forifone
isbom
poor.We
do
see a fairly steepincome
gradient intheownership
ofradioand
television: Inall countries,the share ofruralhouseholds
owning
a television is substantially larger forthosewho
liveon
less than $2 aday
thanthoseliving
on
less than $1 a day. For example, the shareowning
a television increasesfrom
14percent forthoselivingon
$1 aday
to45
percent forthose livingon
less than$2 adollara
day
inCote
d'lvoire;from
7 to 17 percent in SouthAfrica;and
from
10 to 21 percentinPeru. Thispatternhas
been
observed inothercontexts(Filmerand
Pritchett,2001),and
hasbeen
the basisforusingthe lack of durablegoods
as amarker
forpoverty.Our
datasuggeststhat this
proxy
canbe appropriatewithina country, but itcouldeasilybe
misleadingtouse thismeasure
ina cross-country comparison.Among
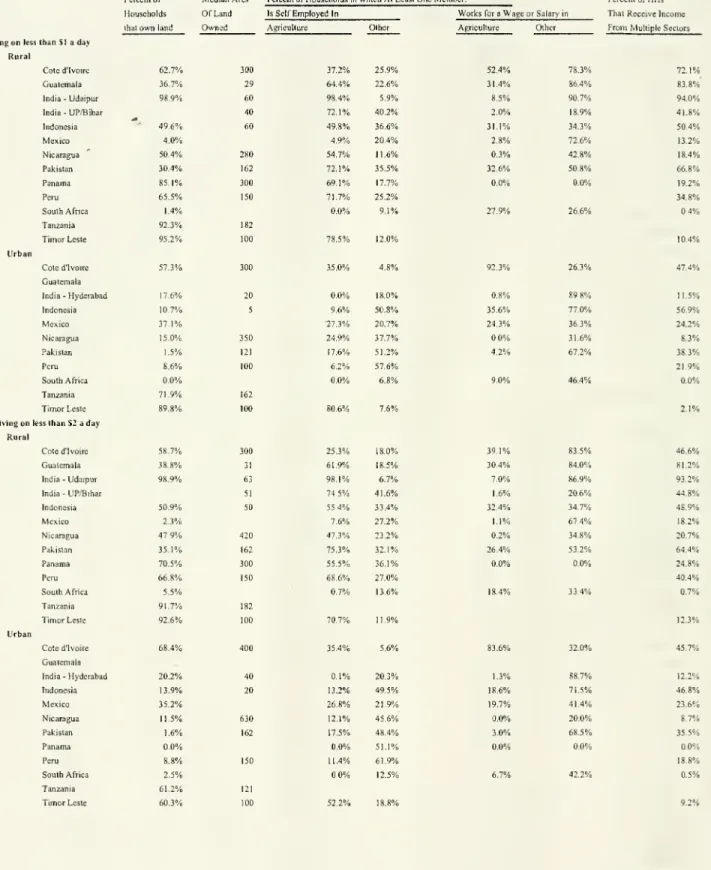
productive assets,landis theone
thatmany
peopleintheruralsurveysseem
toown
though
there areenormous
country-to-countryvariation.Only
4 percent ofthose livingunder
$1 aday
own
land inMexico,
1.4percent in SouthAfrica;30
percent inPakistan,37
percentinGuatemala, 50 percent in
Nicaragua
and
Indonesia, 63 percent inCote
d'lvoire; 65percentinPeru;
and
85 percent inPanama.
In theUdaipur
sample,99
percent ofthehouseholds
below
$1 aday
own
some
landin additionto thelandon
which
theirhouse
isbuilt,when
theextremelypoor
do
own
land, the plots tend tobe quite small.The
median
landholdingamong
the poorwho
own
land isone
hectare orless in Udaipur, Indonesia,Guatemala and
Timor,
between
1and
2 hectares in Peru,Tanzania, Pakistan,and
between
2and
3 hectaresinNicaragua, Coted'lvoire,
and
Panama.
Apart
from
land, extremelypoor
households inrural areas tendtoown
very littleby
way
of
durablegoods, including productiveassets:34
percentown
abicycle inCote
d'lvoire,but less than 14 percent inUdaipur, Nicaragua,
Panama,
Papua
New
Guinea, Peru,and
EastTimor. InUdaipur,
where
we
have
detailedasset data,we
findthatmost
extremelypoor
households
have
abed
ora cotbutonlyabout 10 percenthave
a chair or a stooland
5 percenthave
atable.About
halfhave
aclockor awatch. Less than 1 percent hasan electric fan,asewing
machine,abullockcart, amotorized cycleofany
kind, oratractor.No
one
has aphone.
As
we
willseebelow,this isnotbecausemost
ofthesehouseholdsareemployees and
therefore
have
no
usefor such assets:On
the contrary,many
ofthe extremelypoor
householdsoperate their
own
businesses,butdo
sowith almostno
productiveassets.The
Pursuitof
Healthand
Well-beingShould
we
woiry
aboutthefact that thepoor
arebuying
less food than they could?According
toDeaton and
Subramanian
(1996),the poorestpeople—
the ones in thebottom
decileinterms of percapitaexpenditure
—
consume
on
averageslightly lessthan1400
calories a day. Thisis about halfofwhat
theIndiangovernment
recommends
foraman
withmoderate
activity, ora
woman
withheavy
physical activity.^The
shortfallseems enormous,
thoughone
could question
whether
theinitialrecommendation
was
appropriate.However,
theUdaipur
data,
which
has other healthindicators, suggeststhathealth isdefinitely reason forconcern.Among
the extremelypoor inUdaipur, only 57 percentreport thatthemembers
oftheirhousehold
had
enough
to eat throughouttheyear.Among
thepoor
adults inUdaipur, theaverage
"body mass
index" (thatis, weight inkilograms dividedby
thesquare oftheheight inmeters) is 17.8. Sixty-fivepercentofadult
men
and
40
percentofadultwomen
have
abody
mass
indexbelow
18.5, the standardcutoffforbeingunderweight
(WHO
expert consultation,2004).
Moreover,
55 percent ofthepoor
adults inUdaipur
areanemic,which
means
theyhave
an insufficient
number
ofredblood
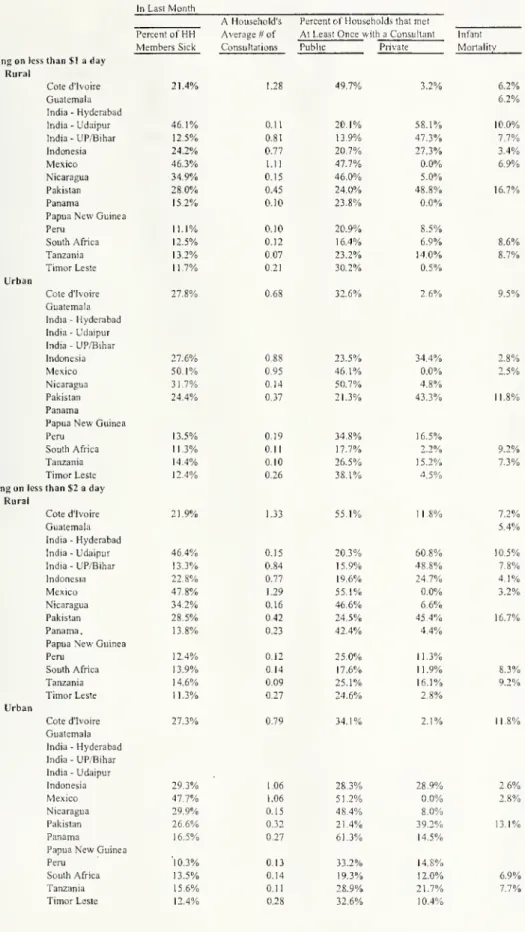
cells.The
poorare frequently sick orweak. InUdaipur, 72percentreportat leastone
symptom
ofdiseaseand
46
percent report an illnesswhich
has leftthem
bedriddenornecessitated a visitto the doctoroverthe lastmonth. Forty-threepercentofthe adults
and 34
percent ofthe adultsaged
under 50reporthaving difficultywith carrying outatleast
one
oftheir"activities ofdaily hving", such asworking
inthe field,walking, ordrawing
waterfrom
awell. Diarrhea isextremely frequentamong
children.About
one-seventh ofthepoor have
vision problems,which
may
alsobedue
tonutritional deficits (causedby
either
poor
nutrition, or thediseases thatafflictthem, or acombinationof
the two).Detailed information
on
health is not availablein allthe surveyswe
have, butmost
reporthealth episodes thatleft ahousehold
member
bedridden foraday
ormore, or requiredthem
to see a doctor.While
this datais less thanperfect, giventhatthepoormay
be
lessprone'See htlp:''.'ww'.v.t'ao.org/dociimeni:s/show cdr.asiy^irl rile~''DOCREP/xfl
to recall
and
reportsuch sicknesses than therich, the general pattern is ofaremarkably
highlevel ofmorbidity.
Among
theruralpoor
livingunder
$1 aday
inPeru, SouthAfrica, EastTimor,
Panama, and
Tanzania,between
11and
15 percent of households report havingamember
eitherbeing bedridden for at least aday
orrequiringa doctor.The
number
isbetween
21and 28
percentin Pakistan, Indonesia,and
Coted'lvoire,and
between
35and
46
percent inNicaragua, Udaipur,
and Mexico.
The
poor
generallydo
notcomplain
abouttheirhealth—
butthen theyalsodo
notcomplain
aboutlifein general either.
While
thepoor
certainly/ee/ poor, their levels ofself-reportedhappinessor self-reported healthlevels are notparticularly
low
(Banerjee, Duflo,and
Deaton,2004).
On
theotherhand, thepoor
do
reportthatthey areunder
a greatdeal ofstress, bothfinancial
and
psychological. InUdaipur, about 12 percent saythat therehasbeen
aperiodofone
month
ormore
inthe lastyearinwhich
theywere
so "worried, tense, oranxious"that itinterferedwith
normal
activities like sleeping,working,and
eating.Case
and
Deaton
(2005)compare
datafrom
South Africatothedatafrom
Udaipur
and
datafrom
theUnited States.They
findthatthe answers ofpoor
South Africansand poor
Indians about stress lookverysimilar, whilereported levelsofstress arevery
much
lowerin theUnited States.The
most
frequentlycitedreason forsuch tensions ishealth
problems
(citedby 29
percent ofrespondents), withlackof food
and
deathcoming
next(13 percenteach).Over
thelastyear, in45 percent ofthe extremely
poor
households inUdiapur
(and 35 percent ofthoseliving under$2 a day)adults
had
to cutthesize oftheirmeal
atsome
pointduringtheyearand
in 12percent
of
them, childrenhad
tocut the sizeoftheirmeals. In the extremelypoor
householdsunder
$1 perday,37
percent report that,atsome
pointin thepast year, the adults inthehousehold
went
withoutameal
for an entireday. Cuttingmeals
is also strongly correlatedwith unhappiness.Carrying
enough
savingstomake
sure thattheyneverhave
tocutmeals,shouldnotbetoo hard forthesehouseholds since,as noted above, they
have
substantial slack in theirbudgetsand
cuttingmeals
isnot thatcommon.
Itwould
alsomake
iteasierforthem
todealwithhealthcare emergencies.
As
such,saving abitmore would seem
likea relatively inexpensiveway
toreducestress.InvestmentinEducation
The
extremelypoor
spend
very littleon
education.The
expenditureon
educationgenerallyhovers
around
2percent ofhousehold
budgets: higherinPakistan(3 percent),Indonesia(6 percent)
and Cote
d'lvoire (6percent), butmuch
lowerinGuatemala
(0.1
percent),
and
SouthAfrica (0.8percent).The
fractiondoes notreallychange
verymuch when
we
go from
thepoor
to theextremelypoor, orfrom
rural areastourbanareas,though
inafew
countrieslike Pakistan,urbanfamilies
spend
substantiallymore
thanrural families. Thislow
level of expenditure
on
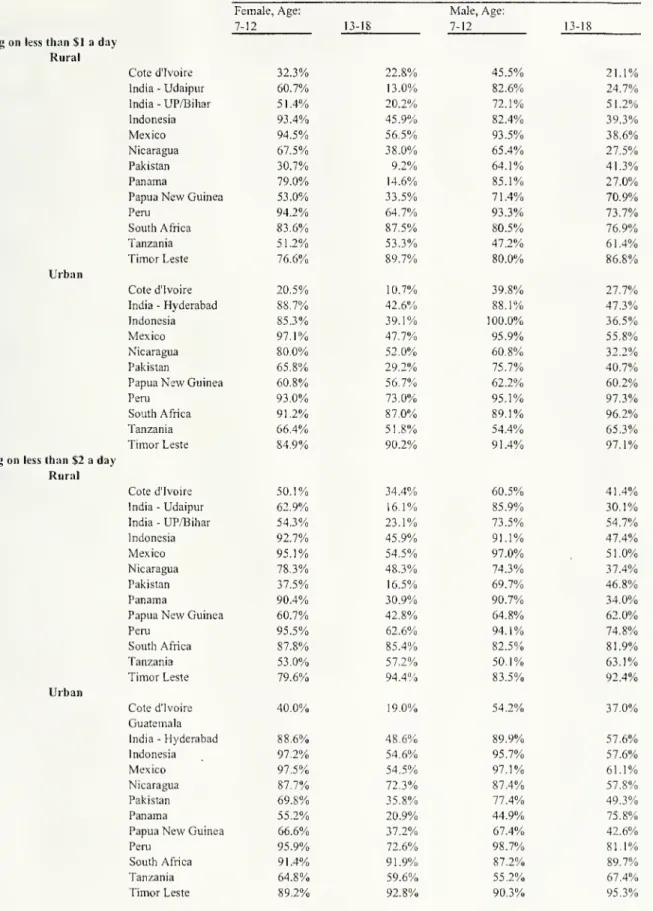
educationis notbecause the childrenareoutofschool. In 12 ofthe 13 countriesinour sample, withthe exception ofCote
d'lvoire, atleast50 percentof
bothboys
and
girlsaged
7to 12 in extremelypoor
households are in school. Inabout half the countries,theproportion enrolled is greaterthan 75 percent
among
girls,and
more
than 80 percentamong
boys.
The
reason spending islow
is thatchildreninpoor
households typicallyattend publicmore
on
education, itis typically becausegovernment
schoolshave
fees (as inIndonesiaand
Cote
d'lvoire).What
they aredoingmight
therefore beperfectly sensible, given thatthis is thereason
why
public educationexists.The
one
concerncomes
from
themounting
evidence,reported below,thatpublic schools are often dysfunctional: Thiscould
be
thereasonwhy
even
very poorparents in Pakistanare pullingtheirchildren out ofpublic schools
and
spendingmoney
tosendthem
to private schools.How
the
Poor
Earn
Their
Money
Walking
down
themain
street ofthe biggestslum
in themedium
sized Southern Indiancity of
Guntur
atninein themorning, thefirstthingone
notices are the eateries: In frontof
every sixth
house
that directly faced the road,by
ourcount, therewas
awoman
sittingbehindalittlekerosene stovewith a
round
cast-iron griddleroasting on it.Every few
minutessomeone
would
walk up
toherand
ordera dosa, the riceand beans pancakes thatalmost everyone eats forbreakfast in SouthIndia.She
would
throw
a cupful ofthe batteron
the griddle, swirl itaround
to coveralmosttheentiresurfaceand
drizzlesome
oilaround
theedges.A
minute
ortwo
later, shewould
slide an off-whitepock-marked pancake
off the griddle,douse
it insome
sauce, folditina
newspaper
orabanana
leafand
hand
itto her client, inreturn for arupee(roughly 15 cents, atPPP).
When
we
walked back
down
thatsame
street anhour
later, thewomen
were
gone.We
found
one insideherhouse, fillingher daughter's platewith lunch thatshehad
cooked
whilemaking
the dosas.She
toldus that laterthatday, shewas
goingout tovend
hersaris, the longpiece ofdecorative cloth thatIndian
women
drapearound
themselves.She
getsplainnylonsaris
from
theshop
and
stitchesbeads and small shiny pieceson
them,and once
aweek,
she takesthem from house
tohouse,hoping
thatwomen
would
buy
them
towear on
special occasions.And
theydo
buy
them, she said confidently. All the otherdosa
women
we
met
thatday had
a similarstory:once
they aredone
frying dosas, theydo something
else.Some
collect trash; othersmake
picklesto sell; otherswork
as laborers.Entrepreneurship
and
MultipleOccupations
Among
thePoor
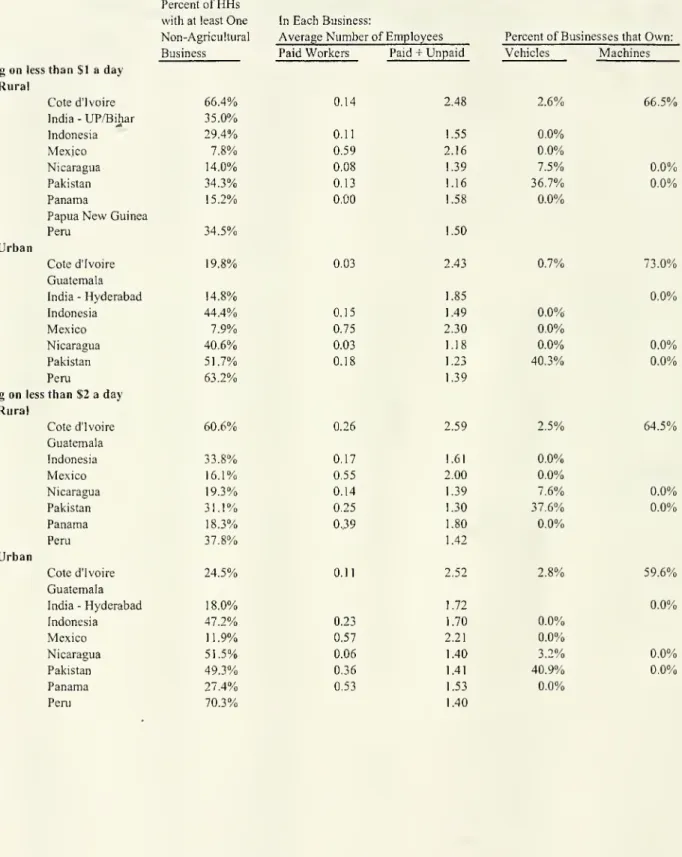
Allovertheworld, a substantialfraction ofthe
poor
actas entrepreneursin thesense ofraisingthe capital, carryingout the investment, and beingthe fiill residualclaimants forthe
earnings. InPeru,
69
percentofthehouseholdswho
liveunder
$2 aday
inurbanareas operatea non-agricultural business. InIndonesia, Pakistan,
and
Nicaragua, thenumbers
arebetween 47
and
52percent.A
large fraction ofthe ruralpoor
operate afarm (exceptinMexico
and
SouthAfrica,
between
25 percent and 98 percentofthe householdswho
earn less than adollaraday
reportbeingself
employed
in agriculture).^Moreover,
many
ofthe ruralpoor
(from 7 percentin
Udaipur up
to 36 percentinPanama)
alsooperate anonagricultural business.The lowlevelofagricultureamongtheextremely poorinSouthAfricaiseasily explained. Theblackpopulation,
whichcontainsalmostalloftheextremelypoorpeople,werehistoricallyunderthe apartheidregimenotallowed
toown landoutside the"homelands,"andmostofthe landinthehomelandswasnotworthcultivating.
Many
poor
householdshave
multipleoccupations. Like thedosa
women
of Guntur, 21percentofthehouseholds livingunder
$2
aday
inHyderabad
who
have
a business actuallyhave
more
than one, while another 13 percenthave
bothabusinessand
a laborer's job.Thismultiplicity of occupationsinurbanareasis
found
inmany
other countries aswell, though noteverywhere.
Among
thoseearning lessthan $2 aday,47
percent oftheurban householdsinCote
d'lvoireand
Indonesia get theirincome from
more
thanone
source;36
percentinPakistan; 20.5 percentin Peru;
and
24
percentinMexico.
However,
inurban South Africaand
Panama,
almostno one
hasmore
thanone
occupationand
only 9 percentdo
soinNicaragua
and
Timor
Leste.^ 'Thispattern
of
multiple occupations is strongerin rural areas. InUdaipur
district, aswe
discussedearlier, almost
everybody
owns some
landand
almosteverybody
doesatleastsome
agriculture.
Yet
only 19 percentofthehouseholdsdescribe self-employmentin agriculture asthe
main
sourceoftheir income.Working
on
someone
else's landiseven
rarer, with only 1percentreportingthis astheir
main
sourceof income. Inotherwords, thepoor
cultivate thelandthey
own, no
lessand
usually,no
more. Yet, agriculture isnot the mainstay ofmost of
these households.The
most
common
occupation forthepoor
inUdaipur
isworking
as a dailylaborer: 98 percentof households living
under
$1 perday
inruralareas reportdoingthisand 74
percentclaim itis their
main
sourceof
earnings.Thispatternis confirmed
by
datafrom
asmallersurvey of27
villagesrandomly
sampled from
eightdistrictsinWest
Bengal
(Banerjee, 2006). Inthis survey,even
householdsthat claim to
be
the operators for a plot ofland,spend
only40
percent oftheirtime inagricultural activities
on
theirown
land.The
fraction isnot verydifferent formen
and
women
—
women
do
less direct agriculturalwork
butmore
animal rearing,along withgrowing
fruits
and
vegetables. Theirotheractivities include teaching,sewing
and
embroidery,unpaid
household
work,and
gathering fuel. Strikingly, almost 10percentof
thetimeof
the averagehousehold
is spenton
gathering fuel, eitherforuse athome
orfor sale.The
median
familyinthis survey has three
working
members
and
seven occupations.In
most
oftheLiving StandardMeasurement
Surveys,households arenotaskedtheirmain
sourceofearnings,butthe patternofdiversificationamong
ruralhouseholds is apparentnevertheless. In
Guatemala,
65 percent oftherural extremelypoor
say theygetsome
income
from
self-employmentinagriculture, 86 percentwork
as laborers outsideagriculture,and
24
percentare self-employedoutside agriculture. In Indonesia, 34 percent
of
the rural extremelypoor
householdswork
as laborers outsideofagriculture,and
37 percent earnincome from
selfemployment
outsideofagriculture. In Pakistan, 51 percentoftheruralextremelypoor
earnincome from
laboroutside ofagriculture,and
35 percentfrom
abusiness outside ofagriculture.Overall, the fractionofthe ruralextremely
poor
householdswho
reportthatthey conductmore
than
one
type ofactivity toearna living is 50 percent inIndonesia, 72 percent inCote
d'lvoire,84 percent inGuatemala,
and
94
percent in Udaipur. It issmaller,butnot negligible—between
10
and
20
percent—
in Nicaragua,Panama,
Timor
Teste,and Mexico.
Once
again, anexception to thisgeneral pattern is SouthAfrica,
where
less than 1 percent oftherural poororextremely
poor
reportmultiple occupations.This
may
howeverbeadataproblem; AnthropologistsdoclaimthattheyobservemultipleoccupationsinSouth African households(FrancieLund,verbalcommunicationtoAngusDeaton).Temporaiy
Migration toWork
Where
do
ruralhouseholds,which
areoften awalk
ofa half-hour ormore
from
the nearest road, findallthisnon-agriculturalwork?
The
answer
turns outtobe theobvious one:they migrate.
Temporary
migration israrelydocumented
insurveys, butintheUdaipur
survey,which
had
questionsaboutthisactivity,60
percent ofthe pooresthouseholdsreport thatsomeone
from
theirfamilyhad
lived outside forapartoftheyearin orderto obtainwork. For 58 percent ofthe families, thehead
ofthehouseholdhad
migrated.The
migrants typicallycompletemultipletrips in a year.
However,
peopledo
not leaveforverylong:The
median
lengthofacompleted
migration isone
month,and
only 10 percentof migration episodes exceedthreemonths.
Nor
do
most
ofthemigrants travelvery far: 28 percentstay inthe districtof Udaipur,and
only42
percent leave the stateofRajasthan.In contrast,
permanent
migrationforwork
reasons israre, althoughmany
women
move
when
they get married.Even
ifwe
lookathouseholds currently livinginurbanareas,where
theinflow
of immigrants
ispresumably
higherthanin rural areas,the share of extremelypoor
households
who
had one
member
thatwas
bom
elsewhere andhad
migrated forwork
reasonswas
just4
percent in Pakistan, 6 percentinCote
d'lvoire, 6 percent inNicaragua,and
almost10 percent in Peru.
The
1991Census
ofIndia reports that only 14.7percentof
themale
population lives
somewhere
otherthanwhere
theywere
bom.
Indonesiais theonly country inourdata
where
theproportionishigher: 41 percentofthe urban householdscame
from
elsewhere. Indonesia isalsothe only countiyin this
sample where
migrationwas
explicitlysubsidized.
Lack
of
SpecializationA
patternseems
to emerge.Poor
familiesdo
seekouteconomic
opportunities, but theytendnotto get too specialized.
They
do
some
agriculture,but nottothepointwhere
itwould
afford
them
afull living (forexample by
buying/renting/sharecroppingmore
land).They
alsowork
outside, butonly inshortbursts—theydo
notmove
pemianently
to theirplace ofoccupation.
This lack ofspecializationhas its costs.
Many
ofthesepoor
householdsreceivemost
oftheir
eamings from
theseoutside jobs, despiteonlybeingaway
for 18weeks
oftheyearon
average(in the caseof Udaipur).
As
short-term migrants,theyhave
little chance oflearningtheirjobsbetter orending
up
in ajobthat suits their specific talents orbeing promoted.Even
thenon-agriculturalbusinessesthatthepoor
operatetypically requirerelativelylittle specificskills.
For
example, thebusinesses inHyerabad
include 11 percenttailors, 8percentfruit
and
vegetable sellers, 17 percent small general stores, 6.6percent telephonebooths,4.3 percent auto owners,
and
6.3 percentmilk sellers.Except
for tailoring,none
ofthesejobsrequire thehigh levelsofspecialized
competence
that take alongtimeto acquire,and
thereforeareassociatedwith higher eamings. In severalways, thepoor
aretrading off opportunitiestohave
higherincomes.The
Problem
of Small
ScaleThe
businesses ofthepoor
typicallyoperate ataremarkably
small scale.As
we
saw,the average landholding forthose
who own
landisusually quite tiny,and
renting land isinfrequent. Furthermore,
most
ofthis landisnotirrigatedand
cannotbe used
allyear round.The
scaleof
non-agriculturalbusinessesrunby
the pooralsotendsto be pretty small. In the 13 countries inour sample, themedian
business operatedby
peoplelivingunder
$2 dollarsa
day
either in a rural oran urban location hasno
paidstaff,and
the averagenumber
of paidemployees
rangebetween
0.14 inruralNicaragua
to 0.53 in urbanPanama.
Businessesareoperated
on
averageby
1.38 (inPeru) to 2.59 (inCote
d'lvoire) people—
most
ofthem
beingfamily
members.
Most
ofthesebusinesseshave
veryfew
assets aswell. InHyderabad,
only20
percent
of
thebusinesses operate outofaseparateroom. InPakistan, about40
percentofthebusinesses ofthoselivingunder $1 or
$2
dollaraday have
a vehicle, butonly 4 percenthave
amotorizedvehicle
and
none have any
machinery. In other countries,even
non-motorizedvehicles arerare. In
Hyderabad,
where
we
have
an exhaustive listof business assets, themost
common
assets aretables, scales,and
pushcarts.Many
of
thesebusinesses areprobably operating attoo small a scalefor efficiency.The
women
making
dosasspend
alotof time waiting: having fewerdosa-makers
who
do
lesswaiting
would
bemore
efficient. In fact, itmight
make
sense in efficiency terms forthedosa-makers
towork
in pairs:One
tomake
thedosasand one
towrap
them
and
make
change.Markets
and
the
Economic Environment
of the
Poor
The
economic
choicesofthepoor
are constrainedby
theirmarket
environment.The
amount
theysave, forexample, should vary withtheiraccesstoa safeplacetoputtheirsavings. Otherconstraints result
from
a lackof shared infrastructure.When
the goverrmientbuilds awaterline to
your
neighborhood, for example,you no
longerneed your
own
well.This section focuses
on
markets.The
next takesup
the issueofinfrastructure.The
Market
for Creditand
thePoor
The
datafi-om our 13 countries suggests thatthefractionofruralextremelypoor
households having an outstanding debtvaries
between
countries,from
1 1 percentin rural EastTimor
to93 percent in Pakistan.But
what
isconsistent across the surveys isthat veryfew of
the
poor
households getloansfrom
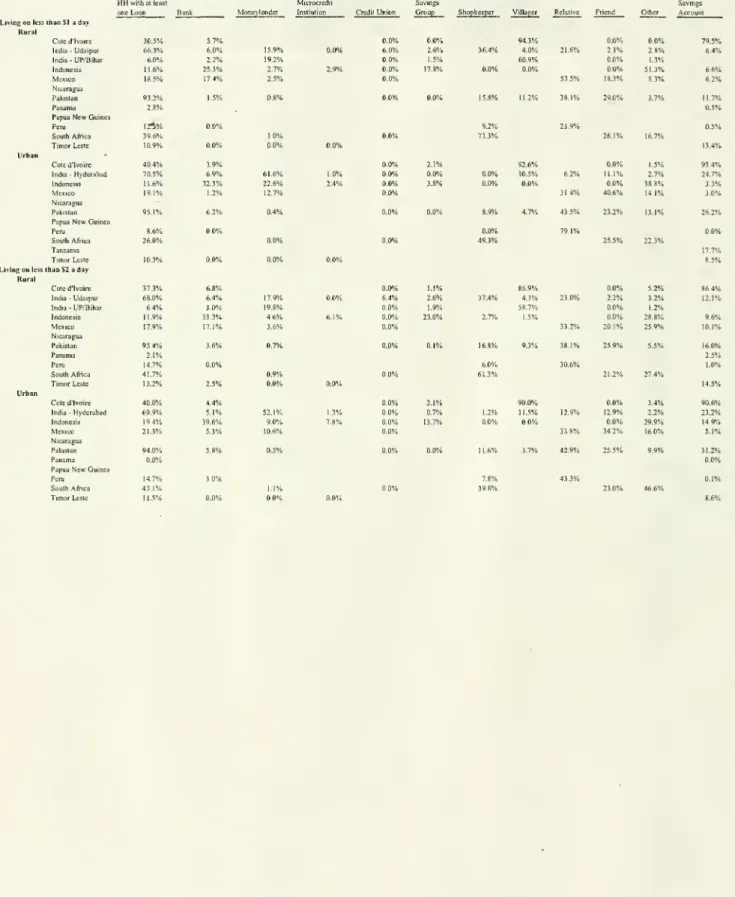
a formal lending source.In the
Udaipur
sample, abouttwo-thirdsofthepoor
had
aloan at thetimeofthe interview.Of
these,23 percent arefrom
arelative, 18percentfrom
amoney
lender,37
percentfrom
a shopkeeper,and
only 6.4percentfrom
aformal source like acommercial bank
or acooperative. Lest
one
suspectthatthelow
shareofbank
creditisdue
tothelackofphysical access tobanks, a similar patternoccurs in urbanHyderabad,
where
householdslivingbelow
$2 a
day
primarilyborrow from moneylenders
(52 percent), friends orneighbors (24percent),and
familymembers
(13 percent),and
only 5 percentofthe loans are withcommercial
banks.The
one countiywhere
a substantial shareoftheloans tothepoor
are formal innature is Indonesia,where
thanks to effortsby
theBank
Rakyat
Indonesia, one-thirdofthe ruralpoor
households
borrow from
a bank. Inall theother countries, relatives,shopkeepers, andothervillagers foiTn,
by
far,theoverwhelming
sourceofborrowed
funds.Credit
from
informal sources tends tobe expensive. In theUdaipur
survey,where
we
have
dataon
interestrates not available inothersurveys, those livingon
less than $1 aday pay
on
average 3.84 percent permonth
for the credittheyreceivefrom
informal sources.Those
who
consume
between
$1 and $2 dollar aday
per capitapay
a little less: 3.13percent permonth. Thisis in partbecausetheyrely less
on
informal sourcesofcreditand
more
on
theformal sources than theextremely poor,
and
the formal sources are cheaper;and
inpartitreflectsthe fact thatinformal interest rates arelowerforthosewith
more
land—
the interest ratefrom
informal sources dropsby
0.40 percent permonth
foreach additionalhectare oflandowned.
The
monthly
interest ratewe
see intheHyderabad sample
iseven
higher: 3.94percent permonth
forthoselivingunder
$2 dollars a day. Thisreflects the fact thatfew
oftheseurbanpoor
householdshave any
landthattheycan use as collateral.These
highinterestratesseem
to occurnot directlybecause of highratesofdefault,but asaresultofthehigh costsofcontract enforcement.While
delay inrepayment
of informalloans isfrequent, defauhis actuallyrare (Banerjee
and
Duflo, 2005). For example,a"Summary
Reporton
Informal CreditMarkets
inIndia" reports thatacross four case studiesofmoney-lenders
inrural India,defaultexplainsonly 23 percent ofthe interest ratecharged(Dasgupta, 1989).
A
wellknown
studyofruralmoney-lenders
in Pakistanby
Aleem
(1990),findthatthe
median
rate ofdefault acrossmoney
lenders isjust2 percent.These
low
defaultratesarehowever
anything butautomatic: Contractenforcement indevelopingcountries isoftendifficult,
and
inparticular,it isnoteasytoget courts topunishrecalcitrantborrowers.
As
aresult, lenders oftenspend
importantresourcesmaking
sure that their loans getrepaid,which
iswhat
drivesup
the interestrates.The
factthat lendingdepends
so
much
on
effective screeningand
monitoringalsomeans
that lendingto thepoor
is especiallydifficult:
The
problem, atleast in part, is thatthepoor
have
very littleby
way
ofcollateral tosecure the loan
and
therefore lendershesitate totrustthem
with a lot ofmoney. Given
thatthe loanamount
will inany
case be small, it isnot always clearthat theprofitsfrom
thetransactionwill
be
largeenough
to coverthe costofmonitoring/screening.As
aresult, alotoflenders arereluctant to lend to thepoor.
Moreover
and
forthesame
reason, informal lenders located closetotheborrowers
may
be the only oneswho
are willingto lendto thepoor
—
sincemonitoring/screening isrelatively
cheap
forthem.The
trouble is thatthese infonnal lendershave
topay
more
for their deposits than themore
formal institutions, sincethey are lesscapitalized
and
less regulatedand do
nothave any government
guarantees. Thishigher cost ofdeposits getspassed
on
to poorer borrowers.The
gap
canbe
considerable—
inthe studyby
Aleem,
the cost ofcapital forthemoney-lenders
was
32.5 percentinayearwhen
banks
were
only
paying
10 percent for their deposits.The
Market
for Savingsand
thePoor
A
main
challengeforthepoor
who
try to saveisto find safetyand
a reasonablereturn.Stashing cash inside
your
pilloworelsewhere athome
is neither safenorparticularlywell-protected
from
inflation. In addition,recentresearchby
Ashraf, Karlan,and
Yin
(2005) inthePhilippines
and
Duflo,Kremer, and Robinson
inKenya
(2006) suggeststhatthe poor,Hke
everyone else,
have
problems
resistingthe temptationof spendingmoney
thattheyhave
athand.
Few
poor
householdshave
savings accounts.Except
inCote
d'lvoire,where 79
percentofthe extremely
poor
households under$1 aday have
a savings account, thefractionisbelow
14 percent inthe other countriesin ourdata. In
Panama
and
Peru, lessthan 1 percentof
suchhouseholds
have
a savings account. Inmost
countries, the share of households withasavingaccount issimilar in rural
and urban
areas,and
similarforthoseunder
$2 aday and
thoseunder
$1 a day.
Here
India appearsto be an exception, since only6percentof
theextremelypoor
households in rural
Udaipur have
asavings account, while25 percent ofthem
do
inthe cityof
Hyderabad.
A
lackofaccess to reliablesavings accountsappearscommon
to thepoor
everywhere,as
documented
in StuartRutherford's (2000) fascinating book,The
Poor
and
theirMonev
.Rutherford describes the
many
strategies thepoor
use to deal withthisproblem:They
form
savings "clubs,"
where
eachpersonmakes
surethattheothersdo
theirsavings. Self-helpGroups (SHGs),
popularinpartsofIndia,and
presentinIndonesiaas well, aresavingclubswhich
alsogive loans to itsmembers
outoftheaccumulated
savings (theyarealsosome
timeslinked to
bank which
offerthem
banks). In Africa, Rotating Savingsand
Credit Associations(ROSCAs)
allowpeopleto lendtheir savingsto each otheron
a rotatingbasis. Otherspay
deposit collectorsto collect theirdeposits
and
putthem
in abank.Yet
othersdeposit theirsavingswith local money-lenders, with creditunions (whichare essentially larger
and
much
more
formally organized Self-HelpGroups)
orinan accountatthe localpost office.And
thereason
why
many
ofthepoor
respondso well to micro-credit, isnot necessarilybecause itoffers
them
credit, butbecauseonce
you
take a loanand
buy
something
withit,you have
a disciplinedway
to save—
namely,by
payingdown
theloan.However
even
participationin semi-formal savings institutions(such as Self-helpGroups,
ROSCAs
and
Microfmance
Institutions), isnot nearly ascommon
among
thepoor
asone might have
expected.Even
inIndia, despite the highvisibility especially ofSHGs,
lessthan 10 percent ofthe
poor
in ourUdaipur and
Hyderabad
surveys are part of anSHG
oraROSCA.
The
majorityofthehouseholdswho
have
any
savings simplyhave
itatthebank.The
Market
for Insuranceand
thePoor
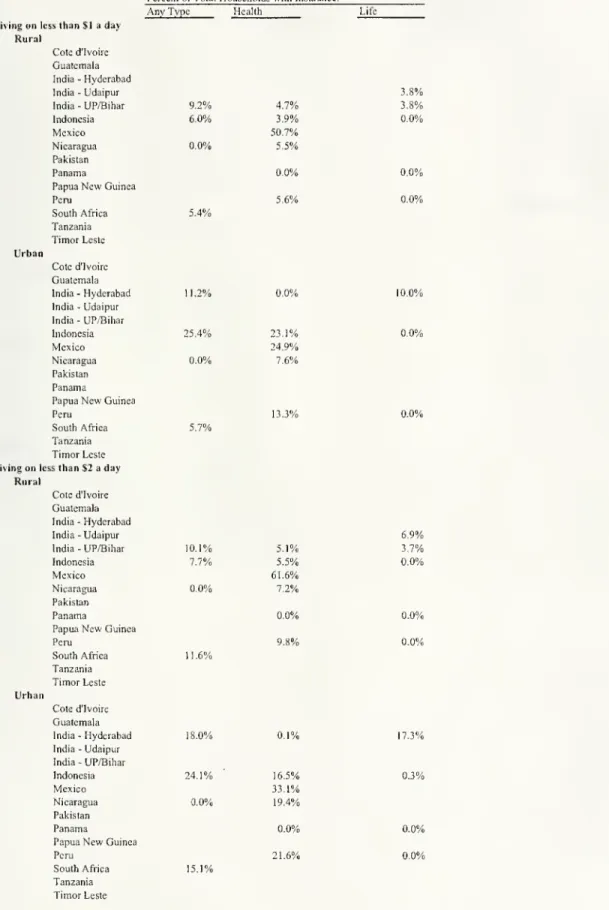
The
poor
have
verylittleaccessto formal insurance. Inmany
surveys, questions aboutinsuranceare not
even
asked. In the six ofthe sevencountrieswhere
thereis dataon
this, lessthan 6 percentoftheextremely
poor
are coveredby
health insurance ofany
kind.The
exceptionis
Mexico
where
abouthalfofthem have
coverage.The
numbers
arenotmuch
higherinurban areas. Lifeinsurance is abit
more
common
inIndia (andis, essentially, aform
of
savings).Four
percentoftheextremelypoor
inUdaipur and
10 percentinHyderabad have
life insurance.
Surprisingly,weather insuranceisalsoessentiallyabsenteverywheretheworld over(Morduch,2005),
althoughitwould seemstraightforwardtoprovideinsurance against obser%'edweatherpatterns.
Inprinciple, informal insurance canalsobe
had
through socialnetworks. For example,Udry
(1990)shows
thatpoor
villagers inNigeria live a lifethatis shapedby
a densenetwork
of
loan exchange:Over
the course ofone year, 75 percentofthe households hadmade
loans,65
percent hadborrowed money,
and 50percenthad been
both borrowersand
lenders.Almost
all
of
these loanstook placebetween
neighborsand
relatives.Both
therepayment
scheduleand
the
amount
repaidwere
affectedby
boththe lender's andthe borrower's currenteconomic
conditions,underlining the role ofthese informal loans inprovidinginsurance.
Rosenzweig
and
Munshi
(2005), arguethat thesame
processhappens
inIndiathroughthejatior sub-castenetworks.
Yet
these infonnal netv^'orkshave
onlya limitedability toprotectthe householdsagainstrisk.
The
consumption
ofpoor
householdsis strongly affectedby
variations intheirincomes, as has
been
shown
by Deaton
(1997) inCote
d'lvoire,Rosenzweig and
Munshi
(2005) in India,
Fafchamps and
Lund
(2003) inthe Philippines,and
Townsend
(1995) inThailand.
Poor
households also bearmost
health-carerisks (bothexpendituresand
foregoneearnings) directly. For example, Gertler
and
Gruber
(2002) findthat inIndonesiaa declineinthe health index ofthe
head
ofthe householdis associated witha declineinnon-medicalexpenditures. In Udaipur, large expenditures
on
health (S70and
higher, atPPP)
arecoveredby
borrowing
ordissa\ing.Only
2percent ofthese expenseswere
paidforby someone
else,and
none
came
from
the self-help groups.Twenty-four
percentofthehouseholds inHyderabad had
toborrow
topay
forhealth expensesin the lastyear.When
thepoor
come
under
economic
stress, theirform
of "insurance"is often eatingless or taking theirchildren out ofschool. For example, Jacoby
and
Skoufias (1997) find thatpoor
children leave school inbad
years.Rose
(1999) finds thatthegap
inmortality' ofgirlsrelative to
boys
ismuch
largerin droughtyears (but onlyforthe landless households,w^ho arenotable to sellland or
borrow
to weatherthecrisis).They
alsoare lesslikely to getmedicaltreatment for
themsehes
ortheirchildren: IntheUdaipur
sample, thosewho
were
sickinthelast
months and
didnotseektreatment(more
than half) cite lackofmoney
more
oftenthanany
otherreason(34 percent
of
thetimes).The
lackof insurancealsoleads thepoor
to under-investinrisky, butprofitable,technologies, such as
new
seeds(Morduch,
1991).The
weaknesses of
informal insurance should notreallybe a surprise. Ultimately,informal insurancerelies
on
the willingness ofthe fortunateto take care ofthose less favored,which
limits theamount
ofinsurance provided.Moreover,
informal socialnetworks
areoftennotwell-diversified.
They
tendto spreadrisk over householdswho
li\'e nearbyand have
similarincomes and
occupations, asGubert and Fafchamps
(2006)show
forthe Philippines.Unfortunately
govermnents
inthese countries are notveryeffective atprovidinginsurance either. For example, in
most
countries, thegovernment
issupposed
to providefreehealth careto thepoor.Yet, health care israrelyIree.
Govemm.ent
health-careproviders oftenillegally chargefor their
own
servicesand
formedicines inreality. Also, aswe
will see,thequality'ofcare in thepublic systemis so
low
thatthepoor
oftenend
up
visitingprivateproviders.
A
number
ofgovernments
provide aform
ofincome
insurance through safety-net"foodfor