HD28
.M414
f\0.3^30
THE
ECONOMICS
OF INFORMATION
TECHNOLOGY:
EXPLAINING
THE
PRODUCTIVITY
PARADOX
Geoffrey
M.
Brooke
April
1992
CISR
WP
No.
238
Sloan
WP
No.
3430
Center
for
Information
Systems
Research
MassachusettsInstitute of Technology Sloan School of
Management
n
MassachusettsAvenue
THE
ECONOMICS
OF INFORMATION
TECHNOLOGY:
EXPLAINING
THE
PRODUCTIVITY
PARADOX
Geoffrey
M.
Brooke
April
1992
CISR
WP
No.
238
Sloan
WP
No.
3430
©1992
G.M.
Brooke
Center
for
Information
Systems Research
Sloan School
ofManagement
M.I.T.
LIBRARIES
JUL
16 1992
THE
ECONOMICS
OF INFORMATION
TECHNOLOGY
Explainingthe Productivity
Paradox
ABSTRACT
The
pastfortyyears have seen dramatic advancesInthetechnologyofinformationprocessing,and
itswidespread adoption bears testimony tothe adventof the 'information society'.However,
theeconomic
implications ofthistransition
remain
tosome
degree obscure, since there is little evidence that thenew
technology has ledto clearimprovements
in productive efficiency. Indeed, during the past twenty years the United States'economy
has sufferedfrom
a decliningrate of productivitygrowth,despitesharply acceleratinginvestmentincomputer-based
systems.Severalattempts have
been
made
toresolve this'productivity paradox',yetnone
hasproved entirely satisfactory. In thiswork,we
propose anew
explanation of the paradox,and
presenteconomic
evidencein it5 support.The
central
argument
isthatinformationtechnologyhas altered theeconomies
ofproductioninfavorof differentiated output,and
that ourmethods
of productivitymeasurement
tend to discoimt the benefits of greater productvariety.
The
vahdity of this reasoning is demonstrated by an empirical study of the United States' privateeconomy,
covering the forty-year periodfrom
1950 to 1989. Despite these results, however,we
conclude that declining productivitygrowth is not merely an accountingfiction, sinceour currenteconomic
system isrelativelyI.
INTRODUCTION
Is
America
losing its position of global pre-eminenceand
entering a period of inexorableeconomic
decline?During
the pasttwo
decades,much
attention hasbeen drawn
to the signs of America's relativeeconomic
weakness
—
a falling share ofworld output, growing tradeand
fiscal imbalances, stagnating real incomes,and
a persistently low rate of productivity growth.The
growing intensity of international competition is exposinginefficiencies in
many
American
corporations,and
is taking a relentless toll of their workers, factoriesand
markets. Distressed by declining living standards
and
by the uncertainty of theireconomic
future,many
Americans
lookback to the post-waryears as atime of unrivalled prosperitythat neithertheynortheir children shall ever see again.With
the steadydownward
drift of the last twentyyears, the general outlookseems
imremittingly bleak. Yet itisbelied, in
some
ways, bythe promise of a strangenew
world which isslowlyemerging
fromtheshadow
of the old.Reflecting
on
America'seconomic
record, severalobservers havebeen
puzzled bythe factthat the recentperiod of lagging productivity growth has alsobeen
a time of rapid innovationand
technical advance. Farfrom
shelteringfrom
the windsofchange,American
industry has eagerly invested innew
technologies,and
especiallyinthose associated with the processing of information. Furthermore,this paradoxical pattern
-
oftechnological innovationand economic
retardation-
hasbeen
observed inmany
nations that have followed theAmerican
example,and
has ledsome
critics toquestionthe abilityof thenew
tectmologytogenerate aneconomic
return.Is this
new
world—
a world of information—
onewhich
confounds our traditional presumption that technological progressand
productivitygrowth go hand
inhand?
If so, arewe condemned
to accept an ever-growingburden
ofinformation, whichencumbers
oureffortsto improveeconomic
performanceand
torespondto agile
new
competitors in the global market-place?Or
mightwe
not be better advisedtothrow
offthe yoke ofinformation technology,and
return tothe triedand
trustedways
thatwere
the foundation of past successes?It isourpurpose here toaddressthese questions, with the
aim
ofexplaining the originsand
nature ofourcurrenteconomic
predicament. In particular,we
shall explain the underlying cause of America's decUning rate of productivitygrowth,and
shall also suggest(1)why
this declinebecame
noticeable after 1973, (2)why
itpersists to the present day,and
(3)why
thisexperience hasbeen
shared bymany
of the world's developed economies.More
generally, our analysismay
provide the basis for a deeper understanding of the productive role of information,and
thus of theeconomic
system that willdefme
the shapeand
substance of thenew
America.II.
EXPLAINING
THE
PRODUCTIVITY
PARADOX
The
quarter-century following theSecond
World
War
ranksasaremarkable periodineconomic
history.Buoyed
byrisingcapitalinvestment, increasingly
open
internationalmarkets,stableexchange ratesand
avarietyof other factors,many
of the industrial nations enjoyed an unprecedentedimprovement
in the general welfare ot their citizens.Although
many
influences contributed to this improvement, its ultimate basiswas
a sustained rise inthe productivity of the resources
employed
within the generaleconomic
system.Each
successive year, these resourceswere
able togenerate higherand
still higher levels of output: in theAmerican
case, relative to theamount
ofeffort required from the average worker, the nationaleconomy
produced
some
}%
more
every year-
providing benefits such as higher real wages, better social services and, in general, amore
equitable distribution of income.After 1973, for reasons which have since
been
much
debated, this era of steadyeconomic
progresscame
to an end. America's average rate of producti\ity growth fell from 3*^ to l^c perannum, and
a similar declinewas
observedin
many
nationsatacomparable
stage ofeconomic
development.However,
while theAmerican
growthrate has
remained
at thisrelativelylow level, in othereconomies
—
especiailvin those ofits majorinternational competitors-
productivity growth has regainedmuch
(though not all) of the lost ground. In consequence, .America's position in global trade has steadilyweakened,
leading to diverse forms ofeconomic
hardshipand
agrowing concern that the
downward
trend—
or productivity slowdown'—
may
signal apermanent
loss of productive efficiency.Leading Explanations ofthe
Slowdown
Prompted
by these considerations, severalprominent
economists have attempted to analyze the causes of .America's post-1973 decline. For example, attention hasbeen
directedat changes inkeyeconomic
inputs (e.g.,risingenergy prices, deteriorating laborquality, reducedcapital investment, etc.) that
may
haveundermined
the productive capabilities of the nationaleconomy.
However,
although several of these factors have clearly contributed toa general falling-offin the rate of productivitygrowth, neitheralone norincombination havetheybeen
able toexplam
a major proportion of the total decline.This inconclusiveevidencehas lent supporttoanalternative argument",which proposesthat it isneitherinferior
nor
more
costly inputs, but a structuralchange in theeconomic
system itself, that isthe rootcause ofAmerica's productivity problem.The
essential reasoningis thatthe high levelsof productivitygrowth experiencedbetween
1948
and
1973 allowed the pattern ofeconomic
activity to shiftaway from
capital-intensive, high-productivity sectors (such as manufacturing) toward labor-intensive, low-productivity sectors (such as those providing informationand
other services). Prior to 1973, the size of the formerwas
suchthatits productivity gainswere
sufficient to
overcome
anyshortfall intheperformance
of the latter:butasthe manufacturingsector shrank, and the services sectorbecame
economically predominant, a dechne in the productivity of the total system was, inthe end, inevitable.
The
theme
of structural change has alsobeen
evident in the writings of thosewho
have studied America's growing reliance on information technology. Since there appears tobe littledirect evidence thattheenormous
technological investment of the past twenty years has served to arrest theeconomy's
downw£u-d slide (thephenomenon
that isnow
known
as the productivity paradox), it is proposed that thenew
technology has contributed to - indeed, hasbeen
a central cause of-
the steady shift toward service-intensiveeconomic
activities. In consequence,
some
have seen cause to doubt theeconomic
value of information technology, claiming that it has allowed the services sector to develop an inefficient, fixed-cost infrastructiu-e that inhibitscompetition
and
the productive re-deployment ofcapitaland
labor resources..As an explanation of the 'productivity slowdown', the thesis relating structuralchange, services
and
information technology does have a certain plausibility: theAmerican
economy
of the 1990s is clearly quite different, as'por example. Denison(1982) andBaily(1986).
TTiistakes avanetyofforms - see.e.g., Baumol(1967);Thurow(1981);Tyler(1981);Jonscher(1983);Baumol,Blackman
&
Wolff
(1985).
'flaily
&
Chakrabani (1988); Baily&
Gordon (1988); Loveman(1988);Roach (1988,1991); Bemdt&
Momson
(1992).regards the importance ofinformation
and
services,from
its predecessor ofthe 1950s. Yet despite the primafacie evidence in its favor, the service-economy
argument
leaves certain questions unanswered.Whv,
forexample, have
more
(and. perhaps, better) services been preferred to higher productivitv growth ?And
why,in particular, have services been preferred if
laggmg
productivity leads to stagnating real incomesand
to a generally lower standard of living?To
these objections, several responses are possible.One
retort might be that the shift to services has in fact raised living standards, not lowered them: it isonly the intangible nature ofmany
service outputs that prevents accuratemeasurement
ofthe associated gain in welfare.On
this basis, the productivityslowdown' is largely a fiction ofcrude accounting,and
we
aremuch
better offthan the nationaleconomic
statistics suggest.A
related propositionmight bethatAmerica,incommon
withotheradvanced economies, hasseen amaturingofconsumer
tastes, manifested by a declining
market
for basiccommodities and
a risingdemand
for sophisticated (yetmore
costly) service products.
We
might perhaps be persuaded ofthis,were
we
not atthesame
tune confronted bytheAmerican
consumer's undiminished appetite for tangible, non-service products.As
is well icnown, during the past decade the international trading position of the United States has noticeably deteriorated,owing
in themain
to the popularity of imported goods: onlv an insignificant proportion of this growing deficit can be attributed to an increasedconsumption
ofservices . Furthermore,services are in fact onlyasmallcomponent
of fmaldemand:
most
service outputs are provided as intermediate inputs to the goods-producing sectoP. In this context, the 'serviceeconomv'
seems,tosome
extent, an illusion:and
the efficient productionof physicalgoodsstillappearsto be the real foundation of
economic
success^.Forthisreason,
we
would
arguethat the national productivityshortfall reflectsanunderlyingeconomic
weakness, not merely inaccuratemeasurement
or changing tastes. Indeed, whatever the basis of calculation (provided itis applied consistently across countries), any nation
whose
rate of productivity growth falls significantly behind the rates achieved by its majoreconomic
rivals, willfmd
its ability tocompete
in global markets progressivelycompromised.
Our
primary need, therefore, is to understandwhy
a real decline in productivity growth hasaccompanied
theemergence
of a society inwhich goods, servicesand
information appear tobe co-ordinate inthe
economic
process.To
this end, however,we
must
first explain the extent to which the decline is, in fact,attributable to a rise in the productionof
unmeasured,
service-related outputs.The
Meaning
and
Measurement
ofProductivityAt
themost
elementary level, our concern with productivitygrowth
stemsfrom
our interest in reducing the sacrifice thatmust
bemade
in the present ifwe
are toenjoy the benefits ofconsumption
in the future.With
this in mind, productivityisoften
defmed
as theratioof 'outputsconsumed'
to resourcesexpended': the outputs comprisingthe variousgoodsand
servicesthatare purchased by consumers,and
the resources (orinputs) being the materials, energyand
human
effortthatare usedintheirproduction. Inpractice, thisproductivityratiotakesmany
particular forms, butforourpresentpurposeswe
shallconcentrateon
an importantvariantknown
astabor productivity, or "output per hour'. This ratio relates themonetary
value of finaldemand
(i.e.,consumer
piuchases, businessand
government
investment,and
net exports) tothenumber
ofhoursspentatwork
(by those^Cf.Quinn (1988. p.39,Table6).
Jonscher(1983. p.17)estimatesthat
85%
of theoutputof the information' sectorisreturnedtothegoodssector. Duchin(1988,p. 79,Table 1)provides similar data forotherindustneswithin the servicessector.Baumol.Blackman
&
Wolff(1989.Chapter6)arguethattheservices-sector'sgrowingshare of the nationalproductreflects achangeemployed
in production),and
is a tundamental indicator of the wealth-generating capacity of a nation's labor force.Turning
now
to the question ofmeasurement,
the calculation of labor productivity clearlydepends on
the accurateestimaUon
of both output'and
hours at work'.Although
the latter variable presents anumber
ofdifficulties of its own.
we
shall not dwell on these since our current focus is the changing nature ofeconomic
outputs, given the trend toward service-intensive production. Concentrating therefore on themeasurement
of output,we
may
observe that the variable is expressed inmonetary
terms,and
thus is subject to the distortions of price inflation. Clearly, to obtain a reliablemeasure
ofeconomic
output and its fluctuations over time, it isessential toeliminate sucheffectssince they are often verylarge relative toanyrise in the true productivitylevel.
Inpractice, the
problem
ofprice inflation is solved by examining,within eacheconomic
sector, the year-to-year change in product pricesand
then discounting, fromone
year to [he ne.xt. any increase in price that does not correspond to a change in product specification'. For e.xample, if thesame
model
of car is priced at $10,000in the first year
and
$10,200 in the second, then the extra $200 is discounted as pure inflationand
the price of the car, expressed in constant dollars, remains at S10.(X)0.However,
if in the second year the specificationof the car is altered to include a $200 radio as standard equipment, then no defiation procedure is applied (the radiobeing regarded as a qualityimprovement) and
real output rises by $200.Over
the years, thismethod
of quahty- adjusted price deflation has beenemployed
with considerable success.Itsuffers
however from
anacknowledged
deficiency, inthat no allowanceismade
forquahtyimprovements
whichare not directly associated with a production cost. For example, instead of installing a radio as standard equipment, a car manufacturer
may
offer achoice ofradios, thusallowing the customer to satisfy a preferencefor a radio of
some
particular type.From
our present perspective, this deficiency is important becausemany
service-related
improvements
are ofprecisely this type: they arise, notfrom
any tangible change in the nature of theproductitself, butfrom
the provision of additional services thatmake
the productmore
convenient,more
accessible, or generally
more
valuable to the individual consumer.At
this stage it is vital to note that the discoimting of indirect-service benefits is not thesame
as themis-measurement
of intangible service outputs.To
elucidate tfiis point,we may
observe that the output ofmany
service industries
and
professions-
law. medicine, finance, entertainment,pubhc
administration, educationetc.-
is largely intangibleand
hence not susceptible ofmeasurement
in anyquantitative sense. Clearly, any rise inthe
consumption
of such services will tend to aggravate themeasurement
difficulty,and
render estimates of productivity growth all themore
suspect. Yet it is also clear thatwhere
a servicecomponent
is included, indirectly, as part of a non-service product, the effecton
outputmeasurement
will be equally unfortimate. although theremay
be little apparent change in the relative consimiption ofgoods
and
services.The
significance ofthis last point lies inthe following. Ifwe
canshow
that, after 1973and
for certain reasons, therewas
a substantial rise in the 'indirect-service' element of production, thenwe
may
conclude thatunmeasured
(i.e., improperly deflated) output has increased as a proportion of the national product, without there being anyunwarranted
shift (from goods to services) in the pattern of finaldemand.
We
may
thenattribute the actual
growth
of the services sector to a greater use ofindirect inputs to the productive process,and
explain the role ofinadequatemeasurement
in the post-1973 decline inAmerican
productivitygrowth.Our
next task therefore is toexamine
the nature of this indirect-service element-
to whichwe
shall applytheterm productdifferentiation
-
and toexplore its connection with information, recallingour earUer concern thatinformation technology has apparently
done
httle to restore America'seconomic
performance to its post-warheights.
^
Product Differentiation
and
VarietyIn
common
usage,productdifferentiation refers to any activity that serves to distinguish a product from othersin the
same
generalmarket.From
the producer's viewpomt. differentiationis desirable because itincreases the attractions of hisown
product relative to the offerings of competitors,and
so allows for a higher priceand
a widerprofit margin.The
discriminatingconsumer
alsogains however,in thatthe differentiated productismore
closely suited to the peculiarities of his situation or taste. In this context, then, it
seems
clear that the differentiation processisone which causesthe product to incorporate service' as a native characteristic: indeed, the productbecomes
more
ser\'iceable. being of greater utihty in relation to its final apphcation.Now
itisevident that certainformsofdifferentiationinvolve atangiblealteration to the product-
acarisclearly distinguished by the inclusion of a radio—
and
in these cases the fact of differentiation presents nountoward
difficulties in relation to output
measurement.
Again, certain other forms imply anintangible product change-
a carmay
be differentiated by its greater reliabiUty. forexample
-
but, as regards the accuracy of price deflation, thisproblem
has always existed (andmethods
of dealing with it have, if anything,improved
durmg
recent years).
However,
there is a further sort of differentiation that, while undoubtedly distinguishing theproduct
from
othersand
enhancing its general appeal, leaves ittruly unchanged.How
is it possible to create distinction without difference? It is best to illustrate this matter by referring to asimple example, taken
from
an advertisement publisheddurmg
September
1990 in a Minneapolis newspaper.The
advertisement, placed by a retailingcompany
operating a chainofdepartment
stores,promotes
the sale of the chain'sown
brand ofmen's shirts.A
particular feature of the advertisement is a small table (reproducedin Figure 1 below) that shows, for shirts keptin stock, the various combinations
(marked
by anV)
ofnecksizeand
sleeve length.The
purpose of the table is to advertise the width of the firm's product range (recently extended to fifty sizes),and
thus its ability to serve a verybroad
spectrum ofcustomers ('In yoiu" sizeand
49 others, too').general conditions of sale remain
quae
unchanged. Indeed, even for thosewho
(owine to their bodilv dimensions) were previouslybeyond
the boundaries of the market, the product has not altered, but merelybecome more
accessible. Yet it is undeniable that the fact of differentiation has created a real distinctionbetween
this retailerand
its competitors.The
questionwe
must
pose is, therefore,how
has thisbeen
achievedwhen
the product itself is no different?The
answer, of course, lies in the concept of product vanety-
the presence, within a general class of product, of multiple yet distinct variations that reflect differences inconsumer
characteristicsand
preferences.A
widervariety ofproduct implies that these differences
may
bemore
closelyaccommodated,
to the greatersatisfaction of thosewhose
individual needs or tastes are therebymore
precisely addressed. Since there is no essentialchangein the productitself, thereis
no
lossofvalue tothosebuyerswho
were
content with the original offering, for (ifnot inclined to adjust their purchasing habits) theymay
direct theircustom
much
asbefore.The
benefit of increased variety to the producer therefore, is that it serves to attractnew
customers without risking the desertion of the old..At this pomt,
we
should perhaps note that product varietyis amuch
broaderand
more
pervasivephenomenon
than our simple
example
may seem
tosuggest.The
general notion ofvarietyappliesnot onlyto sizesofproduct, but also to innumerable other features-
color, style, flavor, texture, shape, packaging, etc.-
as well as to the locationsand
times at which the product is sold. Furthermore, althoughwe
tend to think of variety in the context of current choice, itmay
also extend over time-
that is,where
multiple product variations (e.g., of fashionable clothing) are offered during a single season or year.Returning
now
to the question ofoutputmeasurement and
productivitygrowth, itseems
clear that the degreeof variety is an important, yet entirely indirect, aspect ofproduct value. .Any increase in the prevailing extent ofproduct varietywill therefore imply a general rise in the indirect service' element ofproduction, although a cursory examination of individual products
may
reveal little of the broader trend.As
a result, the process of price deflation will tend to discount theeconomic
contribution of greater varietyand
product choice,and
measures
of national outputwill be systematically understated-
aswill be the rate of productivity growth*. .Atthe
same
tune, asmore
resources are devoted to supplying the indirect services associated with amore
variedand complex
productive system, there will be a rise in thenumber
ofservice workers, without there being anymarked
alteration in the composition (goods versus services) of finaldemand.
Is our
argument
valid? Clearly this depends, directly,on
theanswer
to one central question: has there, during the past two decades,been
any unusual increase in the degree of product variety,and
if so,why?
Productdifferentiation is not a
new
phenomenon, and
outputmeasurement
has always sufferedfrom
its effects: rising levels ofvarietyhavebeen
common
formuch
ofthepresent century.Why
thenshouldthesecircumstances have changed, sosuddenly, after 1973?What
evidence is there that such a change actually occurred?These
questions willbe addressed in the following sections, in brief,we
shall propose that recent advances inour technologyofinformationprocessing,by significantlyreducing the informationcostsassociated with greater differentiation
and
product variety, have facilitated an extraordinary increase in the general diversity of oureconomic
output.We
shall then submit evidence to this effect,drawn from
the post-war experience of the United States. Finally,we
shallreview the hmitations of ouranalysis,and examine
the extent towhich, despite theshortcommgs
of currentmeasurement
procedures, the post- 1973 'productivityslowdown' remainsareal,and
profoundly disturbing,
phenomenon.
Production Costs
and
Information ProcessingIn our discussion thus far,
we
have concentrated on theproblem
ot product differentiationand
the difficultiesit creates in relation to the deflation of
economic
output.However,
we
have given rather less attenuon to thequestion of
how
greater differentiationand
variety affect production costs; to a large extent,we
have sunplyassumed
that indirect costswould
rise as resources are diverted to the provision of built-in' services. Yet forthis to occur across the entire spectrum of
economic
activity, itseems
reasonable to suppose that these costs have, forsome
reason,become
less in relation to the additional utilities that greater variety affords.Our
tasknow
isto explain the origin and nature ofthis change in production costs,and
todemonstrate its effectson
the workings ofoureconomic
system.Firstly, it is well
known
that formany
industrial firms, the cost per unit of production varies according to the scale of output: in general, as the scale increases,and
largervolumes
are produced, so the average cost of producingeach unit tendstofall. Thiscircumstance, oftendescribed bythe phraseeconomies
ofscale, suggests thatcompeting
firms will produce in the largestpossible quantities, inorder tominimizetheir overall unit costs. Indeed, themethod
of 'mass production' thatemerged from
the technical advances of the industrial revolutionwas
based, toa greatextent,on
thisvery principle.The
result, in termsofeconomic
organization, hasbeen
thedevelopment
of discrete industries, in which a few giant firmsdominate
the total process of productionand
distribution.Economies
ofscale are nothowever
the only force that determinesthe leveland
character of productive output.Although
costs might be lowerwhen
quantities are larger, so too is thenumber
ofdifferent products that can be produced, since each takes its share of a finite market. Thus, as the scale ofproduction increases, a point is reachedwhere
the advantage of lower cost is outweighed by thedemand
forsome
measure
of productdifferentiation
and
variety. Firmswill not, therefore, uicrease theiroutput tothe competitivemaximum,
butwillsettle at a smaller scale,
where
thedemand
for a differentiated product balances, through the higher price thatit
commands,
thesomewhat
higher unit costs that the firmmust
incur in its production.This state of balance will not
however
be of any great duration, since costsmay
be reduced still further by combining, within the boundaries of a unified enterprise, the production ofmany
individual fuTns.These
additional savings arise from the fact that differentiated products, although distinct, are also insome
degreerelated:
combined
production therefore allowsmany
of thecommon
expenses to be shared, so reducing the 'overhead' cost associated with each unit of output.These economies
of scope, so called, describe the costadvantages of multi-product operation,
when
compared
to a system in which differentiated production isundertaken by
many
single-product firms. Their consequence, clearly, is to reduce the cost penalty that is incurredwhen
economies
ofscale are sacrificed in the interests ofgreater differentiationand
variety.Now
it mightseem
that the benefits of scopeeconomies
would
encourage a great concentration ofeconomic
activity,
and
the elimination ofmany
smaller single-product firms:and
to aconsiderable e.xtent thishas in fact occurred, aswe
noted earher.However,
the process of concentration is carried only so far. because the advantage ofsharing productive resourcesamong
differentiatedoutputs isoffsetbyanother,vitalfactor:theneed
to process information.Whenever
resources,ofanydescription, aresharedamong
severaldifferent uses, itbecomes
necessaryto collect,store, transmit
and
in a general sense, process, information. Thisneed
arises because resources can be shared onlybydividing them,insome
fashion, into partsand
thenallocatingeach part to a particularuse. Information serves to maintain the associationbetween
partsand
uses-
an association that, being of a temporaryand
variable nature,makes
resource-sharing economically efficient.There
aremany
examples from
everydaylife thatillustratethefundamental connectionbetween
resource-sharingand
information processing. Library shelves aresharedamong
books, which in turn are sharedamong
readers:its catalogue
and
circulation records maintain ihe requisite links.A
telephone network is sharedamong
>ubscribers.and itsbillinginlormation
shows
the temporaryassociationsestablishedbv eachcall. In theextreme.a firm
may
be considered asnothingmore
than anelaborate resource-sharingmechanism,
itsaccounts retlectinghow
equity capital, borrowings and sales revenues havebeen
sharedamong
various productive uses.The
notion that inlormation processing andresource-sharing are inextricablyrelated leads naturally to a further consideration, that information processing is nothing other than the price that is paid for theimprovement
ineconomic
etficiency thatcomes
with thesharmg
of productive resources. It follows therefore that the e.xtent of such sharingwill be limitedby the cost ofthe associated information activity.Where
information processing isslow
and
costly, resources will be sharedamong
comparatively few uses; should these costs fall however,many
more
will find a place.If
we now
return to the question of the multi-product firm,and
its ability to achieveeconomies
of scope bycombining
the production of differentiated outputs, it will be clear that this ability is constrained by the information costs thataccompany
the combination process.Any
decline in the cost of information processing tends,therefore, toloosenthis constraint, leadingthe multi-product firmto an even broader scope of operation.Initially, this greater breadth
may
be reached by absorbing (viamerger
or acquisition) the activities ofsingle-product firms,or those of multi-product firms ofnarrower scope.
However,
ifinformationcostscontinuetofall,the opportunities tor absorption will quickly dimimsh,
and
the firm will e.xtend its scope through internal diversification(i.e., by introducmgnew
productsand
further variationsofestablished products).As
this process continues,and
asthe general turmoil ofcompetitionbecomes
more
pronounced, bothabsorption andextensionwill occur simultaneously, leading to (1) a concentration of productionwithin large multi-product firms^ (2) a rapid rise in the general level of product differentiation
and
variety.Here
then, in thisone
factor-
the cost of information processing-
itseems
we may
have found a key to the long-standing puzzle of declining productivity growth. Ifwe
canshow
(1) that information costs have indeedbeen
sharply reduced, (2) that this occurred during the years after 1973,and
(3) that the reduction has beenaccompanied
by an unusual increase in the e.xtent ofproductvariety, thenwe
shall have evidence that supports our contentionthatthe productivityslowdown'is, in part,attributable toarise in theproductionofindirect(and henceimmeasured)
serviceoutputs. Beforewe
undertake thisdemonstration however, it isnecessarytoexamine
why
and
how
information costsmay
have fallen during the period in question.Information Technology: Its
Development
and Economic
ImplicationsItis widely
known
that the post-waryears havebeen
atimeofdramatic progressinthetechnologyofinformation processing. Yet thedevelopment
of technologies for this general purposebegan
much
earUer ,and
some
remarkable inventionsbear testimonytothe fact: the telegraph (1837), the telephone(1876),wireless telegraphy
(1895), radio(VX)6)
and
television (1923).Although
all ofthese were in widespreaduse before themost
recentera.
and
thereforemay
appear to have little bearingon
theproblems
with whichwe
are directlyconcerned, inrealitythey have
been
an integral part of the general shifttoward
a service-intensiveeconomy.
For this reason,it is instructive tobegin by considering
how
theproblem
ofinformation processingwas
addressed inthese early systems.Firstly, an important characteristic shared by all the technologies
we
havementioned
was
the use ofelectricity tocommunicate
information. Thisrepresented a departurefrom
historical practice, since priortechmques
hadNote that concentration will be limited bythe extent ofscope economies, beyond which small single-product firmswill lend to
dominate economic activity.
relied
on
sight, hearing or on the transportation olsome
physical object (such as paper, amessenger
etc.).Although
electricalmethods overcame
these natural constraints,and
made
possible the rapid transmission ofinformation over great distances, the nature ot the
medium
tended to define theway
in which various types of informationwere
earned. Inthe case ol the telephone, radioand
television,mformation was
carriedinanalogue form,sincethecontinuouswaveforms
associated withsound and
visioncould be translateddirectly(by'analogy') into the electromagnetic waves used for electrical transmission. Telegraphy, however, required thecommunication
of discretesymbols (numbers,letters etc.) ratherthan continuouswaves: successive symbolswere therefore transmitted \n digital form, by varying the electromagneticwave
in ways that generated distinct and recognizable patterns.Although
the telegraph,and
hence digital transmission,was
the first technology of electrical communication, during the late nineteenthand
early twentieth centuries itwas
rapidly overtaken by analogue devices (the telephone,etc.). Nonetheless, itled tothedevelopment
ofsome
fundamentalideasconcerningefficientmethods
ofcommunication
using patterns, represented inmost
systems bysequencesofbinarydigits, orbits.The
notion thatinformation could be systematicallyencoded
in sequencesofsuch digits, while not ofanygreatsigmllcance tothe telegraphitself,didhowever
become
invaluable inthe conte.xtofanother invention,whose
operation relied entirelyupon
the concept ofdigital information.In itsoriginal form, the electronic
computer
-
as itsname
implies-
was
conceivedas amachine
forperforming mathematical computations. Its earliest applicationswere
of a purely numerical nature, uivolvingcomplex
calculationsrequiredformilitaryand
scientificpurposes.However,
thecomputer
soonbecame
ageneral-purpose device, capableofprocessinginformation in almost any form,owing
tothe purely digitalcharacter ofits design.Although
ostensibly functioning as an automatic calculator, in practice thecomputer
was
simply an elaboratecommunications
network, basedon
the digital coding technique used for the transmission of information byelectrical means.
Since its introduction (circa 1950), the technological
development and
universal diffusion of the electroniccomputer
have accelerated, asitwere
without pause.The economic
imphcationsofthisphenomenon,
however, cannot be appreciated until the nature of information in general,and
of digital information in particular, isproperly understood. It is not our purpose here to
meet
this requirement in full, but beforewe
proceed it willbe valuable to return briefly to ourdiscussion of information processing
and
resource sharing, in order to shedmore
Lighton
their underlying relationship.We
suggested earlier that resource sharing is achieved by division-
that is, by dividing the resource into parts(these being sub-divisions in space or time)
and
then associating each part withsome
determinate use. This association 'requiresan actofinformation, or a logicalcoupling(and,subsequently, decoupling)oftwoor
more
discrete entities.
To
achieve this, the entities (a part of a resource,and
its associated use)must
each be represented in logical form, asmust
be the nature of their association (e.g., its duration, cost or limitations).Each
logical form, in turn,must
be distinct (since the partsand
uses are discrete), leading ultimatelytothe idea that thee.xtent ofresource sharing will be limitedby (1) the supply ofdistinct logicalforms,and
(2) the costof theircouphng and
decoupling.The
importanceof the computer's digitalmodus
operandimay now
bemade
clear, since it is the essence of the digitalmethod
that information (such as discrete symbols) be represented by distinct logical forms - i.e., by sequences of binary digits that correspond to unique patterns of variation in the electromagnetic wave.Any
device, therefore, that facilitates the generation, storage, manipulation or transmission of these sequenceswillincrease the supply of logical forms,
and
likewise reduce the cost of coupling and decoupling. This willmake
possiblenot only
more
associationsbetween
more
entities,butalsomore
types ofassociation:resourcesmay
thus bemore
finely dividedamong
various uses,and
the divisionmay
itselftakemore
particular forms.The
processwill eventually lead to
more
extensive and intricate resource-sharing arrangements,and
so to an increasmelv elaborateand
complex
productive system"'.We
havenow
explamed.m
essence,why
and
how
thedevelopment
olthe electroniccomputer
hasbrought about a significant reduction in the cost of information processing, andwe
have linked this to our earlierargument
encompassing
resource-sharing,economies
of scope, product differentiation and variety. .A question remains, however, as towhy
the effects offalling information costs did notbecome
evidentduring the decadespreceding 1973-
atimewhen
productivitygrowthremained
strong,despite thegrowinguse ofcomputer
technology.How
canwe
account for this twenty-year delay.'Our
answer to this question requiressome
preliminary explanation of the history ofcomputer
design and manufacture ". Since thecomputer
was
conceived as a digital device, it reliedon electrical circuits to represent the various digits required for information encoding. In the very earliest machines, these circuits were constructed from electro-mechanical relays, but thesewere
soon replacedbyvacuum
tubes, which-
having nomoving
parts-
greatly increased the speedand
reliability of computation. After 1950 however,vacuum
tubes were themselves replaced by sohd-state transistors (miniature electricalcomponents
made
from silicon) whichwere
much
smallerand
lighter, and which could be manufactured in large batches (and hence atmuch
lowercost) by
means
of photolithography..As time progressed, the transistor's size
and
cost advantages allowedcomputer
design tobecome
increasingly sophisticated. Thistrendwas
retlected in the growing complexityof the underlying circuitry, which required the inter-connection of a risingnumber
of discrete electrical components. Eventually, the high cost ofassemblingcu^cuits containing hundreds of thousands of elements led to the invention (1959) of the integrated circuit
—
acomplete electrical circuit etched in a minute chip" of silicon.
During
the followingdecade,circuits constructed from individual transistorswere
steadily replacedby integrated circuits, asimproved
designand
manufacturing techniques enabled the integration of ever-greaternumbers
ofelements.Despite its very considerable benefits, the integrated circuit
was
subject to an important limitation, in that its functionswere
defmed
entirely by its physical structure. In consequence, eachnew
apphcation required the designand
manufacture ofa differentcircuit,implying low-volume productionmethods and
thusa relativelyhigh cost per circuit. .As the density of integrated circuits-
and hence their range of applications-
gradu2dly increased, so too did the difficulty of manufacturing a growing diversity of specialized circuits. Paradoxically, however, higher circuitdensitiesalsomade
possible the invention of the micro-processor,or'computer ona chip'- an integratedcircuitthat containedall the essentialsofa computer'scentral processingunit. Since the micro-processor could execute mslructions (by
mampulating
sequences of binarydigits), it could be manufactured enmasse
as a standard productand
then beprogrammed
to perform a varietyof specialized fimctions.Although the first micro-processor (the Intel 4<X)4)
was
introduced during 1971, its rangeand
capacitywere
sufficientonlyfor relativelyprimitiveappUcations.
Some
improvements were
evidentinitsimmediate
successor,the 8(X)8 (1972), but it
was
the 8080 model, introduced during 1973. that revealed the micro-processor's true potential. Usinga micro-processor asa central processingunit,the micro-computer—
smaller andlesspowerful than other computers, butmuch
lesscostly-
appeared during 1975and
grew
rapidly in numbers, allowingmuch
larger scales of production
and
somuch
lower unit costs. .At thesame
time, circuit densities continued to increase, providing greater speed, capacityand
functionahty.The
combined
effect of these two trends (largervolumes
and
higher densities)was
a steepand
sustained decline in overall information costs-
a decline that continues to the present day.Pulley6l Braunsiein i1984) provide an exampleofthisprocess.
Our accountisdrawn largely from Braun
&
Macdonald (19781. and Denouzos&
Moses(1979).Reflecting once
more
on
the question oteconomic
growth, itmay seem
almost mcredible that a minute device, smaller than a frngernail. could have initiated the chain of eventswe
havebeen
at pains to describe.However,
the true significance of the micro-processor lay not in its size, nor indeed in its actual function, but in itsdemonstration of the efficiency of the underlying fabrication process. Before the era of large-scale circuit integration,
computer
production required the manufacture and assembly ofmany
individualcomponents
(whether
vacuum
tubes, transistorsor integrated circuits);after 1970.methods
ofmass
production could be usedto produce multi-purpose components, suitable tor
many
applicationsand
formany
types ofcomputer
system. Thiswas
true not onlyforthe processingunitsusedin micro-computers,butformanv
other kinds ofcircuit(such as those used incomputer memories)
that reliedon
large-scale integration tecfiniques to achieve theeconomic
benefits ofmass
production.We
havenow
completed
our analysis of the computer's effecton
the cost of information processing, and have explained, by reviewing the computer's technological evolution,why
this effectbecame
noticeable after 1973, rather than before.By
so doing,we
have developed in full our explanation ofthe recent decline in America'srate of productivity growth, and of the
manner
in which this decline is associated with the growing use of informationtechnology. Furthermore,from
thegeneralityofour reasoningitis buta short steptoconclude that thesame
phenomenon
willbe found, not onlyin the United States, butin all nationsthat have taken advantage of thenew
technology. .At this stage, then, it remains but to beshown
that the record ofhistory supports our interpretation of the case, and that mattersdo
indeed stand aswe
have presented them.To
this purpose,we
shall
now
bring forward evidence that, while not constituting final proof, yet givessubstance to the logic ofour general argument.III.
WEIGHING THE
EVIDENCE:
THE
UNITED
STATES,
1950-
1989Although
we
have dealt with the subject atsome
length, our explanation of the "productivity paradox' is in factremarkablysimple.
We
propose that recent (post-1973) advances incomputer
technologyhave greatly reduced the cost of information processing, so providingeconomies
of scope that have stimulated greater productdifferentiation
and
variety. Sincevarietyand
choice areprovided as indirect services, theircontributiontooutputis discounted by current
methods
of price deflation, leading to a decline in themeasured
rate of productivity growth.This brief
summary
suggests that, ifwe
are to demonstrate the validity of our analysis,we
must
focus our attentionon
the behavior, pre- and post-1973, ofthree keyvariables: (1) the costof information processing, (2) thelevelofproductdifferentiation,and
(3)therate ofproductivitygrowth. Furthermore,we
shouldexpect these variables tobe inversely related, in that falling information costs should be followedby a rising level ofproductdifferentiation
and
by a falling rate of productivity growth.The
diagramshown
in Figure 2 illustrates the essentials ofthis reasoning.COST OF INFORMATION PROCESSING LEVEL OF PRODUCT DIFFERENTIATION RATE OF PRODUCTIVITY 3R0UTH
Figure 2. LogicalVariables
and
RelationsAlthough
Figure 2 clearly represents the logical structure ofour argument, it is not ideally suited to empirical investigation,and
for this reason hasbeen
modified as follows. Firstly, the 'cost of information processing' isreplaced by the adoption of information technology', reflecting the supposition that the use of information technologywill rise tothe extent that it reduces information processing costs: the virtue ofthis exchange being
the
more
tangible nature ofthe variable. Secondly, in the interestsof consistency, eachvariable is expressedasa rate of change, causing the first variable to
become
the rate of information technology adoption',and
the second, the 'rate of product differentiation'. For a similar reason, the 'rate of productivity growth' (the proportional change in output per unit of input,from
one period to the ne.xt) is replaced by the rate of productivity' (the rate of output per unit of input, during a given period).The
result of these modifications isshown
in Figure 3 below. In brief, the figure suggests that anyincrease inthe rate of information-technology adoption will be
accompanied
by an increase ( + ) in the rate of productdifferentiation,
and
a correspondingfall (-) inthe rate ofproductivity. Furthermore, although this isnotshown
in the figure,we
should expect these changes to occur after 1973, rather than before.RATE OF INFORMATION-TECHNOLOGY ADOPTION RATE OF PRODUCT DIFFERENTIATION RATE OF PRODUCTIVITY
Figure 3. Empirical Variables
and
RelationsWe
shallnow
present, insummary
form, themethods
thatwere
usedto evaluate the system of relationsshown
The
Research Methodology
Firstly,the general approach was econometricin nature, involvingthe collection andanalysis of time-series data for eachofthe three variables, across slxsectors ofthe United States'
economy.
The
sectorswere
chosen from those definedby theBureau
ofEconomic
Analysis(BEA)
following the Standard Industrial Classification,and
used by the
Bureau
ofLabor
Statistics(BLS)
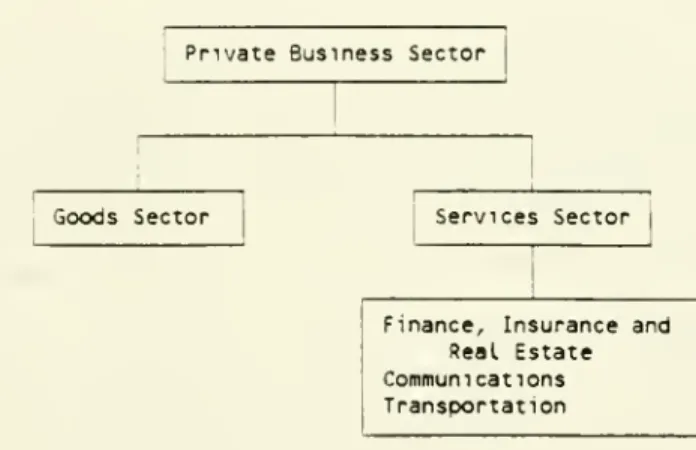
for the purposes of reporting national productivity statistics. In this scheme, the largesteconomic
aggregate is the pnvaie business sector(some
77%
of 1987 Gross National Product, orGNP),
this being in turn sub-divided into agoods-producingsector(21%
ofGNP)
and
aser\'ices-providing sector
(50%
ofGNP).
The
goods and
services sectors are themselves sub-divided into industries, butowing
to inconsistencies in the data sources, the analysis included only three industries (finance, insuranceand
real estate;communications:
transportation) within the services sector. Figure 4 illustrates the relationshipsbetween
the variouseconomic
sectors.Private Business Sector
Goods Sector Services Sector
Finance, Insurance and Real Estate Communications Transportation
Figure 4. Hierarchy of
Economic
SectorsWithin each of the six sectors, the data for each variable consisted of forty annual observations covering the period
from
1950 to 1989. For consistency,and
to eliminate the effects ofpopulation growth, changing habitsetc.. the di'/isor (hours at
work)
in the productivity variablewas
applied to each of the other two variables. Ineffect, therefore, for each sector the data set comprised
measures
of (1) the rate of information-technology adoption, (2) the rate ofproduct differentiation, (3) the rate of output,and
(4) hours at work.We
now
turnto the process of datacollection.The
data relating tothe rateofinformation-technology adoptionwere
takenfrom
theBEA
IndustryInvestmentData
Tape, a standardcomputer
tape that provides abreakdown
of the United States' capital investment by (1) industry of ownershipand
(2) type of capital. In the main, information-technology capital is classified either ascommunication
equipment' or as 'office,computing
and
accounting
machines
(OCAM),
but since the former type is concentrated in thecommunications
industryand
is used to provide aservice (e.g., telephony) toother adopting' industries, theanalysis included only the lattertype
(OCAM).
Regarding the use of the
OCAM
investment data,there are twodifficulties that deserve mention. Firstly, since the data are classified by industn,' of ownership, rather than bv industry of use.many
distortions have been introduced by the growing popularity ofcomputer
Icasmg (which mcreased. as a proportion of totaJcomputer
investment,from
less than 10<~?; in 1982 tomore
thanWr.
in 1989'^).Computer
leasing is acomplex
phenomenon,
andwe
found nomethod
of correctingthese distortions: notehowever
that the effects of leasing activityare significant only duringthe final years of the period,and
are lessmarked
at higher levels ofanalysis.Secondly, the
OCAM
data representmonetary
values, not physical quantities,and
are given in both historical (current) dollars and constant (1982base) dollars. At first glance it mightseem
preferable to use the constant-dollar series,whichremoves
the effectsofprice infiationand
hencereflectsthe 'true' levelofcapitalinvestment. In the case ofOCAM.
however, since 1985theBEA
has used an hedonic price index for deriving the constant-dollarestimates,and
the post-1982advances incomputer
technologyhave causedthese estimatestodiverge very widely from the current-dollarfigures. For example, in 1989.when
total current-dollarOCAM
investmentwas
S45 billion, the constant-dollar" equivalent
was
$125 billion. For this reason, the current-dollar series (with general inflation representing a nominal technical change'component) was
used to represent the rate of information-technology adoption.Our
secondvariable, the rate of product differentiation,was
represented by the annualnumber
ofapphcationsfor
trademark
registration submittedto the United States' Patent andTrademark
Office(PTO).
Although
not all forms of product differentiation are associated with formal trademarking, ameasure
of this nature doesencompass
those thatare ofamore
generaleconomic
significance.Trademarks
haveseveral furtheradvantages, since they are widely used to distinguish all kinds of goodsand
services, reflect actualcommercial and
tradingactivity,
and
have been(sincetheLanham
Actof1946) a standard,stable featureof theeconomic
system.Again
however, certain difficukies
were
evident,and
these meritsome
briefdiscussion.Firstly, there
were
two reasonswhy
trademark
applications, rather than registrations,were
usedtorepresent the differentiation variable: (1) there is a considerable delay-
asmuch
as four years-
between
the filing of atrademark
applicationand
itseventualregistration; (2) thenumber
oftrademarksregisteredinanyyeardepends
very largelyon
thePTO's
budgetaryand
staffing position, which fluctuates according to the level of funding provided by the federal government. Secondly, although data relating to themore
recent years of our study period (1975and
later) couldbe obtained directlyfrom
thef^O,
forthe earlieryears itwas
necessarytoderive supplementarydatafrom The Trademark
Registerofthe UnitedStates. Thirdly,we
should note that the 1946Act requiredmarks
tobe used incommerce'
beforean applicationforregistrauonwould
be considered bythePTO;
from 16th
November,
1989theTrademark
Revision Actof 1988 allowed theFTO
to accept applicationswhere
onlyan'intent to use' isexpressed(resultinginasurge of applicationsand
hence a shghtupward
bias inourdata for 1989).Data
relating to the rateof productivity (the thirdvariable in theschema shown
in Figure 3) were derivedfrom
the standardBLS
estimates, whichare basedon
theBEA's
analysis ofGNP
by 2-digitSIC
industry.Note
that theBLS
provides estimates ofboth outputand
(independently,from
itsown
sources) hours at work. Itshouldalso be noted that, since
government
activitieswere
excludedfrom
the other datasets (i.e.from
those relatingto information-technology adoption
and
product differentiation), the outputand
hours of fee-for-servicegovernment
enterpriseswere
subtractedfrom
the corresponding (outputand
hours) figures for the private business'and
'services-providing' sectors."TTiese liguresarcdenved fromsurveysconducted bythe Computer Dealersandlessors.Association. Inc.
Data
Analysisand
ResultsAftercollection, the datawere analy7ed both graphicallyandstatistically. In the interestsofbrevity, and because the analysis revealed verysimilar patterns in eachof the
economic
sectors, only themost
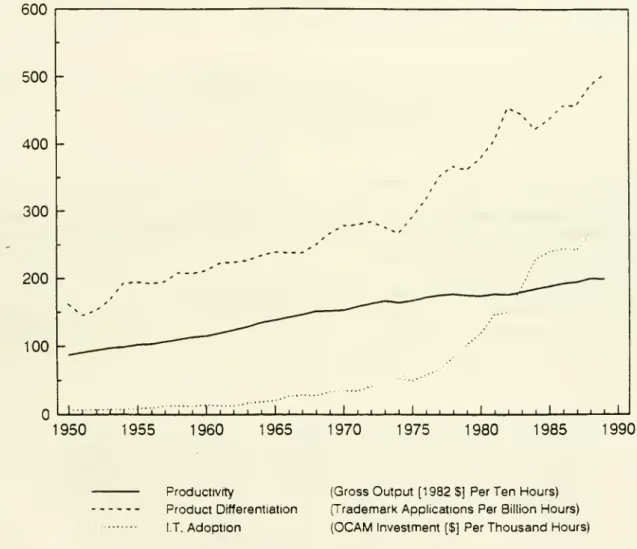
general results (those for theprivate business sector) will be presented here.To
this end. Figure 5 shows, for the private business sector, the forty-year trends (scale-adjusted) in each of the three variables.600
500
-400
300
200
100
I ^••^^^^•'^rrr
7
i i i I t 1 ' ' ' '1950
1955
1960
1965
1970
1975
1980
1985
1990
Productivity (GrossOutput [1982$] PerTen Hours) ProductDifferentiation fTrademarkApplicationsPer BillionHours)
I.T.Adoption
(OCAM
Investment[$] PerThousand
Hours)Figure 5. Information Technology, Product Differentiation
and
Productivity: Private Business Sector, 1950-
1989ReferringtoFigure5, the interactions
between
the three time-seriesreflect, veryclosely, theset of relationships impliedbytheschema
ofFigure3.Taken
broadly, the periodbetween
1950and
1973isone
of rapid productivity growth,accompamed
by relatively slowgrowth
in product differentiationand
information-technology adoption. After 1973 however, the situation is completely reversed, there being clear evidence of slowing productivity growthand
asudden
acceleration in both information-technology adoptionand
product differentiation.The
statistical significance of the trends shov,n in Figure 5was
tested by estimating the parameters of thefoUowine econometric model;
D, (1)
(2)
where
a and (i represent the structural parameters of the model. Iyear
-
1950) and:0, 1, 2 40 (i.e.. r
=
calendarD.
'nt
rate of product differentiation in yearf
rate ofinformation-technology adoption in year I rate of productivity in year t
random
error in year f (:i=
1, 2).In equation (1), the rate ofproduct differentiationD, is represented as a linearfimction of timef
and
the rateof information-technology adoption /, with a
random
errorcomponent
U][ . In equation (2), the rate ofproductivityP, is likewise a linear function oftimet
and
the rate ofproduct differentiationD, .The
time trendf serves to
remove
the effect of anycommon
upward
drift over time,and
thus concentrates the analysison
differential fluctuations
aroimd
a linear trend.The
estimation procedurewas
basedon
the two-stage least-squares regression technique, the two equations inthe
model
being subject to joint estimation.To
counter the effects of autocorrelation, each of thedependent
variables D^and
/',was
specified as asecond-order autoregressive process.The
results areshown
in Figure b.The
resultsshown
in Figureftclearlysupportthe implications derivedfrom thegraphicalanalysis.The
estunates ofparameter a-^ indicate asignificantly positive relationshipbetween
the rateofinformation-technology adoption and the rate of product differentiation: likewise, the estimates of parameter /?•, indicate a significantly negativerelationship
between
the rate ofproductdifferentiationand
the rate of productivity.However,
these are general relationships that hold over the wholestudy period; in order to evaluate the significance ofchangesbetween
the pre- 1973 and post-1973 periods, the analysiswas
refined by specifying an inter-period model:D,
p^ ^
P.t
-P^D^
^ p^ (D,-
0,3) X^ ^«„
(3)
(4)
The
notation in these modified equations is thesame
as that in equations (1)and
(2) above, except that;23
D
23rate of information-technology adoption in year 23 (1973) rate ofproduct differentiation in year 23 (1973)
1 iff
>
23otherwise.
The
dummy
variable X^serves to separate the differential effect ofthe rate ofinformation-technology adoption/,
on
the rate ofproduct differentiation D, into two separate components: a first-periodcomponent,
0:3and
a second-periodcomponent
(a-^ + a^).The
parameter a^ therefore represents thechangeinthe differential effectbetween
the firstand
second periods. Likewise, the parameter P^ represents the inter-period change in the differential effect of the rate of product differentiation D^ on the rate of productivity/', .Note
that in otherrespects, the analytical structure
and
estimation procedurewere
thesame
for both the full-periodand
inter-period models.
The
estimates of the parameters of the inter-periodmodel
areshown
in Figure 7.The
resultsshown
in Figure 7 revealno
significant post-1973 change (a^), in the relationshipbetween
the rateof information-technology adoption
and
the rate of product differentiation: this is entirely consistent svith our theoretical position, which suggests a constant positive associationbetween
these two variables.On
the other hand, after 1973 there isclearly a significant negative change (fi^) inthe relationshipbetween
the rateof productdifferentiation
and
the rate of productivity, implying that the generally negative associationbetween
these variables, although of no significance (/?•,) during the earlyyears(when
the rate ofdifferentiationwas
probably too low to have any noticeable affect on productivity growih), suddenly intensified after 1973, supporting ourargument
that the productivityslowdown
ofthe pasttwo decades isdue toan unusual accelerationm
the degree of product differentiation and variety.rv.
CONCLUSION
Taken
as a whole, the empirical evidence lendssome
plausibility to our interpretation of America's recenteconomic
history,and
to our assertion that the post-1973decline in productivitygrowthmay
be traced to a rise in the productionofindirect (andthusunmeasured)
service outputs.We
should notehowever
thatourempiricaJ analysis does not indicatehow
much
of the total declinemay
be attributedto this change in the composition of the national product:we
have merelydemonstrated
thatsome
influenceseems
tobe present. Clearly, amore
conclusive analysis
would
require the inclusion of other variables (such as energy prices, labor qualityetc.) thathave also taken their toll.
.Although the scope ofour investigation is thus
somewhat
narrow and open
toquestion,we
would
propose that amore
important issueis itsmeaning and economic
implications. In our originaldiscussion ofthe problem,we
suggested that the decelerating growth rate reflects an underlying weakness,
and
is not solely the product of inadequatemeasurement and
statistical oversight. Yet, tothis point,we
have argued that slower productivitygrowth
is indeed the consequence of a failure to account for the intangible benefits of greater varietyand
freedom
of choice.What
thenis the nature ofthis underlying weakness', andhow
is it relatedto the hypothesis that ourmeasurement
procedures ignore the contribution of indirect services ?The
answer tothis question is that indirect servicesmay
be providedwith greater or lesser efficiency,and
that theAmerican economic
system is comparatively ill-suited to thisnew
form
of productive endeavor. It is thiscircumstance that explainswhy, quiteapart
from
anyhistoncalchanges inits productivityrecord(with whichwe
have thus far
been
concerned), the United States'economic
performance has notmatched
that of its international rivals, even during the pre-1973penod
of 'rapid' productivity growth^'*. In this respect, the 'productivity slowdown' of the pasttwo
decades represents, not merely an accounting failure, but a real deterioration in long-run productive efficiency.The
basis of thisominous
claim,and
its implications foreconomic
policy, will be the subject ot future work. Clearly, there can beno
retreatfrom
the 'information society'and
its technologicalmethods
of production: our questmust
betounderstandhow
thesemethods
might havealtered ourcanon
ofeconomic
efficiency.A
revision ofsuch preceptsmay
entail a transition tonew
forms of enterprise, tonew
waysof orgemizingeconomic
activity,and
perhaps tonew
public institutions-
better suited,we
may
hope, to the challenges of thecoming
century.' Baumol. Blackman
&
Wolff(1989,p.88) illustratethemagnitudeofthis shortfalldunngthepenod 1950- 1979.