A Distributed System Architecture for Spatial Data Management
to Support Engineering Modeling
by
Ayman Ismail
B.Sc. Construction Engineering American University in Cairo, 1995
Master of Business Administration American University in Cairo, 1997
Submitted to the Department of Urban Studies and Planning in partial fulfillment of the requirements for the degree of
Master in City Planning at the
MASSACHUSETTS INSTITUTE OF TECHNOLOGY
ARCHNES
MASSACHUSETTS INSTITUTE OF TECHNOLOGY June 1999
JUL 1 9 1999
© Ayman Ismail, 1999. All rights reserved LIBRARIES
The author grants hereby to MIT permission to reproduce and distribute
publicly
paper and electronic copies of this document in whole or A par.A uthor ... .
D n U an Studies and Planning
May 20, 1999 C ertified by ...
/
/~
Joseph FerreiraProfessor of Urban Planning and Operations Research
Department of Urban Studies and Planning
Thesis Supervisor A ccepted by ...
Associate Professor Paul Smoke Chair, MCP Committee Department of Urban Studies and Planning
A Distributed System Architecture for Spatial Data Management
to Support Engineering Modeling
by
Ayman Ismail
Submitted to the Department of Urban Studies and Planning on May 20, 1999 in partial fulfillment of the
requirements for the degree of Master in City Planning
Abstract
This research seeks ways to manage the process of analysis and synthesis of geographic data to support collaboration among researchers, planners, and engineers working on a spatial problem. This question is addressed on two levels. The first level examines the abstraction and representation of the analysis process, using the Unified Modeling Language. The second level examines the distributed environment that enables such collaboration, and proposes a three-tier distributed system architecture. The interdisciplinary Urban Respiration project provides a context and examples illustrating the need for such design. A prototype application is developed to test and understand the applicability of the proposed designs.
Thesis Supervisor: Joseph Ferreira
Acknowledgements
I would like to thank Professor Joseph Ferreira for constantly challenging me with new ideas and
endeavors and for making the Planning Support Systems group such a lively learning environment. My thanks also go to John Evans and Nadine Alameh for their great support, thoughtful discussions, and motivation.
Special thanks go to Mike Shiffer, Qing Shen, Tom Grayson and Phil Thompson for making PSS and CRL a great place, to work, learn and collaborate.
I can never thank enough my family for challenging me to set high goals, and achieve them, for
Table of Contents
1. IN TR O D U C TIO N ... 7 1.1 OVERVIEW ... 7 1.2 PROBLEM D EFINITION ... 7 1.3 SYSTEM U SERS... 9 1.4 O BJECTIVES... 9 1.5 RESEARCH M ETHODOLOGY ... 9 1.6 THESIS O VERVIEW ... 10 2. BA CK G R O U ND ... 112.1 GEOGRAPHIC INFORM ATION SYSTEM S ... 11
2.1.1 W hat GIS Can Do ... 11
2.1.2 D istributed GIS... 12
2.2 ENGINEERING M ODELING... 12
2.2.1 The Urban Respiration project ... 12
2.2.2 An Example of Collaboration Involving G eographic Analysis... 13
2.3 SYSTEM A RCHITECTURE... 16
2.3.1 M ainfram e Architecture... 16
2.3.2 File Sharing Architecture ... 16
2.3.3 Client/Server Architecture ... 16
3. MODELING OF GEOGRAPHIC ANALYSIS PROCESS ... 19
3.1 THE NEED FOR MODELING OF GEOGRAPHIC ANALYSIS PROCESS... ... ... 19
3.2 OVERVIEW OF THE U NIFIED M ODELING LANGUAGE ... ... 20
3.2.1 UM L Elem ents ... 20
3.2.2 UM L D iagram s... 21
3.3 USING ACTIVITY DIAGRAMS TO MODEL GEOGRAPHIC PROCESSES... 22
3.3.1 Activity D iagrams Elem ents... 22
3.3.2 An Example from the Urban Respiration Project ... 23
4. SYSTEM ARCHITECTURES FOR MANAGING GIS PROCESSING ... 26
4.1 SYSTEM FUNCTIONALITY ... 26
4.2 SYSTEM CHARACTERISTICS... 26
4.3 PROPOSED SYSTEM ARCHITECTURE ...-- 27
4.4 DESIGN A LTERNATIVES...- ..---... -... 28
4.4.1 The Client... 28
4.4.2 The G eo-processing Server ... 28
4.4.4 The Com m unication Layer... 29
4.5 IM PLEMENTED SYSTEM A RCHITECTURE... 30
5. PR O TO TY PE IM PLEM EN TA TIO N ... 31
5.1 THE CLIENT A PPLICATION... 31
5.2 U SING THE CLIENT ... 32
5.2.1 Creating the M odel... 32
5.2.2 Configuring the Server... 32
5.2.3 Connecting to the Server... 33
5.2.4 Running the M odel... 35
5.2.5 Other Functions... 35
5.3 PROTOTYPE LIM ITATIONS... 35
5.4 EVALUATION OF THE PROTOTYPE IMPLEMENTATION .... ... ... 36
6. C O N CLU SIO N ... 38
6.1 M ODELING OF GEOGRAPHIC PROCESSES ... 38
6.2 D ISTRIBUTED SYSTEM A RCHITECTURE... 38
6.3 PROTOTYPE IM PLEMENTATION ... 39
6.4 IM PACT ON GIS U SERS ... 40
6.5 CHOICES IN DESIGN AND IM PLEM ENTATION... 40
6.6 GENERAL D ISCUSSION... 41
A PPEN D IX : SA M PLE V ISU A L C++ CO D E ... 42
List of Figures
FIGURE 2.1: EXAMPLE OF COLLABORATION INVOLVING A GEOGRAPHIC ANALYSIS PROCESS FROM THE URBAN
R ESPIRA TIO N PROJECT ... 13
FIGURE 3.1: ELEMENTS OF AN ACTIVITY DIAGRAM ... ... 22
FIGURE 3.2: UML ACTIVITY DIAGRAM FOR THE ROADS MODEL ... 23
FIGURE 3.3: RASTER GRID FOR ROAD M ODEL ... 24
FIGURE 3.4: UML ACTIVITY DIAGRAM FOR THE LANDUSE MODEL ... ... 25
FIGURE 3.5: UML ACTIVITY DIAGRAM FOR THE COMBINED ROADS AND LANDUSE MODEL ... 26
FIGURE 4.1: PROPOSED GENERAL SYSTEM ARCHITECTURE ... ... 27
FIGURE 4.2: IMPLEMENTED SYSTEM ARCHITECTURE ... ... 30
F IG U RE 5.1: C LIENT SCREEN ... 31
FIG URE 5.2: A CTION D IALOG ... 32
FIGURE 5.3: OPENING ARC/INFO SERVER RPC ... 33
FIGURE 5.4: CONFIGURING THE CLIENT RPC CONNECTION SETTINGS ... 34
FIGURE 5.5: CONNECTING TO AND TESTING ARC/INFO SERVER RPC ... 34
1. Introduction
1.1 Overview
Typical planning and engineering modeling problems require the collaboration of different users from different disciplines. They are data intensive and require mixing data sets from different sources and of different types and formats. Many system architectures exist to support modeling, data management, and collaboration for engineering problem solving. Most of these cater to the specific needs of a group of users and problems, but none satisfy the combined needs of engineering modeling and spatial analysis. This research addresses the following question: how
can we manage the process of analysis and synthesis of these data sets to support collaboration among different researchers, planners and engineers working on a spatial analysis problem?
This research begins by analyzing existing computing architectures in terms of their ability to handle the demanding planning and engineering modeling. Geographic Information Systems
(GIS) provide useful tools for performing spatial analysis to support planning and engineering
modeling. These tools are usually not integrated with engineering modeling and analysis tools, which often have different data models. Emerging distributed information systems and collaborative tools offer the opportunity to create systems that support such integration.
This research looks at ways users of Geographic Information Systems and engineering modeling systems interact, and what underlying system architecture might support such interaction. It also examines the need for an abstract modeling language to capture and communicate analysis processes. By developing a prototypical distributed system architecture, the research suggests how users might use the Unified Modeling Language as an abstract graphical language to describe and communicate their modeling exercises. The prototype design links different data sources and servers in a distributed environment.
1.2 Problem Definition
The main question addressed through this research is how to manage the process of analysis and synthesis of geographic data shared among different researchers, planners, and engineers. This question is addressed on two levels. The first level examines the abstraction and representation of geographic analysis processes. The second level examines the distributed environment that enables such collaboration.
Users' interaction with GIS software highlights the issue of abstracting and representing the analysis process. Typical GIS software allows the user to operate on data that has a spatial dimension. This data is usually organized either as vector components (points, lines and polygons) or as raster grids with other attached attributes that describe these geographic entities.' During the analysis process the user performs some spatial functions on these data objects. This
analysis process could include several steps, use several layers of data, generate intermediate
layers or incorporate other (non-spatial) data sets. It often requires several iterations through the process to experiment with various parameters and test possible hypotheses.
A sophisticated spatial analysis process is often faced with difficulties in
e recording or capturing the steps of the analysis process,
* describing the required steps to perform a certain analysis in an abstract format rather than a list of software-specific commands,
e building several nested layers of analysis that make it easier to understand the problem,
* documenting the process in a reproducible fashion,
* managing the different data sets involved in the analysis, and
e automating the process to allow for iteration or repetition.
An abstract model to represent a spatial analysis process could offer ways to alleviate the above difficulties.
Current GIS system architectures highlight the issue of operating in a distributed environment. Traditional Geographic Information Systems are based on a stand-alone model. All the required data is collected on a single powerful machine. The required software (which is usually a collection of packages from a single vendor) resides on the same machine. Data layers gathered from different sources are processed to prepare for a specific analysis. Such processing includes
e converting file formats for the geographic layers and the database files to ensure
compatibility,
* converting between different coordinate system and projections to ensure geographic consistency, and
* customization and filtering of the data records and attributes to suit the specific analysis purpose.
A distributed environment, when available, is usually used for exchanging files and other types
2
of communication2
3 Many of today's developments in distributed GIS are targeted towards the World Wide Web3 The current focus is on letting Internet users view geographic data and perform a limited set of queries on them through a web browser. Little attention is focused on developing system architectures and interfaces that allow for distributed analysis integrating several data sources and servers. In part this is due to the huge interoperability problems that exist in the GIS world. The system architecture and prototype developed in this research attempt to examine the issue of operating in a distributed environment. Using the current GIS and programming tools, what are the major limiting factors to the development of a distributed GIS architecture?
2 Ferreira et al, p. 99.
1.3 System Users
The identification of the potential users of this system architecture and prototype is important in determining the desired system characteristics and design objectives. The Urban Respiration project (discussed in detail in Chapter 2) is a typical case of interdisciplinary collaborative research. Each group has a different set of modeling needs, from Weather modeling, to atmospheric pollution analysis, to spatial analysis. The data used are captured and generated through different scientific devices and tools that are extremely diverse in their data models and file formats. In such a context, integrating data from different sources and using them in different applications is difficult. From a Geographic Information Systems perspective, these data need to be overlayed on standardized layers such as roads and landuse, and used in further analysis. The targeted users for this research are in a variety of disciplines; a technically sophisticated planner, engineer or researcher. Their work is focused on the specific needs of a modeling problem, yet they operate in a collaborative interdisciplinary environment that requires the integration of different sources of information. Their analysis often includes a spatial component. This research focuses on the needs of this user group. How can these users model and communicate their analysis process in a distributed environment? What system architectures will help them work together more effectively?
1.4 Objectives
In light of the problem definition and system users' needs outlined earlier, the objective of this thesis is to design a system architecture and prototype to support the spatial modeling process in
a distributed environment.
This can be further divided into the following goals:
* Modeling of the spatial analysis process using an abstract modeling language. * Understanding the current system architecture used in distributed GIS.
* Examining the different design alternatives for a distributed GIS system architecture. * Implementing a prototype for the designed architecture.
* Evaluating the tools used in the implementation.
1.5 Research Methodology
The Thesis starts with a literature review that examines, first, Geographic Information Systems and engineering modeling. The next part examines a typical problem of collaboration involving geographic analysis, and introduces the Urban Respiration project in detail. The last part examines distributed system architectures. The Client/Server architecture used in the design of the prototype is given special attention.
The next step in the Thesis describes Unified Modeling Language (UML) and its possible application in this context. A subset of UML is selected as a graphical modeling language in the
prototype. UML components are described briefly with a focus on using a subset to model geographic analysis.
In the next step, the characteristics and components of the system architecture are identified. The design alternatives for each component and the corresponding implementation limitations are examined. This leads to a proposed architecture that is then implemented in the prototype. A full description of the prototype and its different components follows. Using some examples from the Urban Respiration Project, the prototype is tested. This leads to a discussion on the limitation in the prototype and the reasons behind these limitations.
The conclusion includes an evaluation of the system architecture and prototype according to the earlier design criteria and user requirements. Some future work is suggested as a follow-up to this Thesis.
1.6 Thesis Overview
The Introduction covers the main objectives and overall context of this Thesis. Chapter 2 presents a background and a literature review. Chapter 3 describes modeling of geographic analysis processes using the Unified Modeling Language. Chapter 4 examines the system architecture and design alternatives. It ends with a description of the selected system architecture for the prototype implementation. Chapter 5 provides a description of the developed prototype
2. Background
This research draws upon three bodies of knowledge, geographic information systems, engineering modeling and system architecture design. This chapter presents a background and overview of the current research trends in each, while concentrating on the issues most relevant to the problem at hand.
2.1 Geographic Information Systems
"A geographic information system (GIS) is a computer based information system that enables
capture, modeling, manipulation retrieval, analysis and presentation of geographically referenced data.4" A GIS holds two types of data; geographic entities (an abstract representation of space)
and attributes describing these geographic entities.
2.1.1 What GIS Can Do
What differentiates a GIS from other types of database systems is its ability to answer questions that have a spatial dimension. Here are a few typical functions of a GIS:
e Overlaying spatial data from different sources in a single map reveals a lot about the
relationships among the different layers. This can be visually enhanced by using symbology, thematic mapping and other cartographic and visualization techniques. * Questions about location such as locating places and proximity, locating objects at
specific places and selecting places that satisfy certain criteria.
* Network analysis makes it possible to get the shortest path (time-wise or distance-wise) between two points or a series of points.
* Terrain analysis makes it possible to build terrain models and answer questions about path, visibility and viewsheds by incorporating a third dimension (elevation).
* Layer based analysis includes overlaying different layers to select locations that satisfy a specific spatial characteristics. For example areas with high density and education level within 10 miles from transit stations.
5 * Spatio-temporal analysis that includes comparing spatial information through time .
A GIS makes these functions practical by providing efficient data structures that can store, index
and retrieve massive amounts of data referenced to a geographic coordinate system.
GIS can be applied to a number of fields and applications. It is often used in areas such as
environmental science, landuse planning, utility management, automated mapping, remote sensing and cartography.
4 Worboys, p. 1.
2.1.2 Distributed GIS
Traditional Geographic Information Systems are based on a stand-alone model, which requires full access to the whole data set required for analysis (either locally or through a network file system). With the proliferation of the Internet as a set of standards and communication protocols, a distributed approach to GIS becomes practical. In a client/server environment, the spatial data and geo-processing server become available through a network connection to several client applications.
Interoperability problems on the applications and data levels represent the main challenges for distributed GIS.
Current developments are more inclined towards Web-based GIS, which allows the user to 6
browse and query spatial data through a web browser interface .Products like Internet Map Server from ESRI allow the user to publish a map on the World Wide Web with very limited viewing functionalities .
2.2 Engineering Modeling
One of the applications of Geographic Information Systems is in the field of engineering and scientific modeling. The Urban Respiration project is an example of the use of GIS to support analysis and modeling in such a context.
2.2.1 The Urban Respiration project
The Urban Respiration project is a multi-disciplinary project funded by the United States National Astronautics and Space Administration (NASA). It addresses a broad set of modeling and measurement issues concerned with urban metabolism and respiration and involves researchers from several institutions. The project, which started in 1997, aims at improved measurement of trace gas emissions and atmospheric chemistry in metropolitan areas, and a
8 better understanding of how landuse influences air pollution patterns
Participants in the project include Aerodyne Research, the Department of Urban Studies & Planning, and the Chemical Engineering Department at MIT, the University of Washington and the University of New Hampshire.
Aerodyne Research's work is focused on mobile monitoring equipment for in situ trace gas measurement. Their mobile van is capable of measuring the concentrations of trace gases in real-time while traveling around the city. The van records the spatial coordinates and real-time stamps for the measurement points using the Global Positioning System (GPS). The Chemical Engineering Department at MIT has developed models of atmospheric chemistry and air pollution in and above metropolitan areas. The University of Washington is focusing on the measurement and modeling of meteorological conditions. And the University of New Hampshire is focusing on the
6 Alameh, pp. 24-26.
7 Internet Map Server.
measurement and modeling of aerosol dynamics. The Department of Urban Studies & Planning at MIT is focusing on the spatial information infrastructure and urban land use models. This includes the development of distributed spatial information systems to facilitate collaboration
9 among the different groups
2.2.2 An Example of Collaboration Involving Geographic Analysis
As part of the Urban Respiration project, an analysis framework was developed that requires processing raw data from field readings, creating several raster layers that represent a spatial model of pollution distribution and finally overlaying these models produced from roads, landuse, meteorological, and other layers. The following example demonstrates the range of analysis and collaboration required in this context.
One goal of the project is to investigate the relationship between air pollution and landuse patterns. This included building a geographic model for the area of Manchester, New Hampshire that included landuse, transportation, demographic, topography, weather, and pollution data. The landuse, transportation, demographic, and topography layers were available from standard data sources at different levels of resolution. The weather and pollution data sets were the result of the experiments of two other collaborators in the project.
The measurement of trace-gas levels was done using a mobile van equipped with a GPS and trace gas measuring equipment. Several rounds of data collection were performed. Each round involved some pre-designed experiments to test some hypotheses, which required measurements along a certain path and time duration. To prepare for these experiments, researchers used GIS data layers including landuse, roads, and emission sources. Each round of measurement produced large files containing time-stamped geo-referenced pollution concentrations. These output files needed several processing steps to identify and remove special measurement and timing errors before others can make use of them.
In parallel with the trace-gas measurement experiments, another team was responsible for measuring the weather conditions in the same area. Their work was used to calibrate their weather models (using standard Penn State/NCAR Mesoscale Modeling System MM5)'0. These
models simulate the weather conditions for the duration of the experiments. The simulation is run in a nested fashion, beginning with a coarse 5 Km grid cell size in a large area (eastern U.S.), and then zooming in to a high resolution 1 Km grid cell size centered on the study area. The result is a large 3-dimensional grid with different weather parameters (e.g. temperature, humidity, and wind speed and direction) at several resolutions (5, 3, 1 Kin). The creation of this model is computationally demanding (3 days of processing on a fast, dedicated server) and results in huge data files.
To build the spatial model, these data sets needed to be integrated with the other landuse and transportation layers. The first step after data collection and processing was to communicate the different types of models used and to discuss issues of data types, file formats and sizes. The second step was to move the files (in this case the files were transferred using Internet's FTP, File Transfer Protocol). The third step was to convert the data files from their application-9 Ferreira et al.
specific formats into a "GIS friendly" format. This required several applications to open, convert, and reformat the files. At the end, the output was ready to be added as a GIS layer to the model.
p 'U_
Experiment design
Weather model or air movement Measurement o trace-gas levels Emission sources
Landuse Layer
Road Layer
Demographics Layers
Figure 2.1: Example of collaboration involving a geographic analysis process from the Urban Respiration project. Overlay Layers
2-dimensional Spatial Model of surface
3-dimensional volumetric models of atmospheric chemistry
This example describes a typical situation that involves collaboration among different researchers, each focusing on a specific type of modeling. Integrating the data resulting from these heterogeneous models into a single homogeneous geographic model proves not to be a trivial task. Each model has a different data model based on its specific processing needs. Outputs are produced at different levels of aggregation. For example, landuse layers could have different levels of aggregation, ranging from coarse layers covering the whole state, to more detailed layers covering the metropolitan area at the parcel level. The choice of scale for mixing data layers is also dependent on the requirements of the spatial and atmospheric models that it feeds into. One of the objectives of this exercise is to develop different models of surface layers at different resolution and levels of aggregation and see which aspects or assumptions are more important in the overall model. For example, what is the impact of using a more detailed landuse layer on the overall model accuracy?
At this stage the final outcome is a GIS model that includes all of the previous layers (and others). This will be further used to perform analysis that attempts to understand the relationship between the trace-gas measurements and the landuse, roads, weather and other parameters.
From a data perspective, this example involves several geographically-referenced data sets from different sources. Each has its own format and data structure that is customized to its initial application and discipline. From a processing perspective, the interaction among the different researchers is naturally in a distributed environment: different parts of the analysis are performed at different locations and using different software. A distributed architecture is naturally suited to such collaborative environment. From a user perspective, the nature of the project requires collaboration on one large problem. Each researcher is handling a small portion of the problem, yet the whole model needs to be integrated at the end. An abstract modeling language, one that is discipline- and technology-independent is a promising approach to facilitating this interdisciplinary, distributed collaboration.
2.3 System Architecture
A system architecture refers to the design of an information system with either its software or
hardware components or both. The architecture of a system always defines its broad outlines, and may define precise mechanisms as well.
An "open" architecture allows the system to be connected easily to devices and programs made
by other manufacturers. Open architectures use off-the-shelf components and conform to
approved standards. A "closed" architecture is one whose design is proprietary, making it difficult to connect the system to other systems
One of the main reasons for interoperability problems in GIS is that most of the systems were designed as closed systems using proprietary data structures and file formats that take advantages of emerging hardware and software technology in new ways. As GIS technologies matured, there have been efforts in the GIS community to address the interoperability issue through the creation of the Open GIS Consortium (OGC); an industry-wide consortium dedicated to creating open
12
software interfaces to allow GIS systems to interact
2.3.1 Mainframe Architecture
With mainframe software architectures all intelligence is within the central host computer. Users interact with the host through a terminal that captures keystrokes, sends them to the host, and receives screen-painting instructions (either text or graphics) in response. Mainframe software architectures are not tied to a hardware platform. User interaction can be done using PCs and
UNIX workstations. A limitation of mainframe software architectures is that they do not easily
support graphical user or access to multiple databases from geographically dispersed sites. Recently, mainframes have reemerged as servers in distributed client/server architectures13
2.3.2 File Sharing Architecture
Original PC networks were based on file sharing architectures, where the server downloads files from the shared location to the desktop environment. The requested user job is then run (including logic and data) in the desktop environment. File sharing architectures work if shared usage is low, update contention is low, and the volume of data to be transferred is low. Typically, this architecture can only satisfy about 12 users simultaneously. In the 1990s, PC local area network computing changed because the capacity of the file sharing was strained as the number
14
of connected users increased and graphical user interfaces became popular
2.3.3 Client/Server Architecture
Client/server architecture emerged as a result of the limitations of file sharing architectures. This approach is most common for a database application, where a database server replaces the file server. Using a relational database management system (RDBMS), user queries could be developed and displayed using local forms, and only the queries would be sent via the network, 11 http://www.webopedia.com.
12 Buehler. 13 Edelstein.
rather than a total file transfer. This reduced network traffic and improved multi-user updating. In client/server architectures, Remote Procedure Calls (RPCs) or structured query language
15
(SQL) statements are typically used to communicate between client and server'.
The term client/server was first used in the 1980s in reference to personal computers connected through a network. The actual client/server model started gaining acceptance in the late 1980s. The client/server software architecture is a versatile, message-based and modular infrastructure that is intended to improve usability, flexibility, interoperability, and scalability as compared to centralized, mainframe, time sharing computing.
A client is defined as a requester of services and a server is defined as the provider of services. A
16 single machine can be both a client and a server depending on the software configuration. Several variations of the Client/Server architecture exist, as follows.
Two-tier Architecture
With two-tier client/server architectures, the user-system interface is usually located in the user's desktop environment and the database management services are usually in a server that is a more powerful machine that services many clients. Processing management is split between the user system interface environment and the database management server environment. The database management server provides stored procedures and triggers. A number of software vendors provide tools to simplify development of applications for the two-tier client/server architecture"
Three-tier Architecture
Three-tier architectures emerged to overcome the limitations of the two-tier architecture. In the three-tier architecture, a middle tier was added between the client and the server environment. There are a variety of ways of implementing this middle tier, such as transaction processing monitors, message servers, or application servers. The middle tier can perform queuing, application execution, and database staging. For example, if the middle tier provides queuing, the client can deliver its request to the middle layer and disengage because the middle tier will access the data and return the answer to the client. In addition, the middle layer adds scheduling and prioritization for work in progress. The three-tier client/server architecture has been shown to improve performance for groups with a large number of users (in the thousands) and improves flexibility when compared to the two-tier architecture.
Distributed/Collaborative Enterprise Architecture
The distributed/collaborative enterprise architecture emerged in 1993. This software architecture is based on Object Request Broker (ORB) technology, but goes further than the Common Object Request Broker Architecture (CORBA) by using shared, reusable business models (not just objects) on an enterprise-wide scale as building blocks to provide a range of applications. The benefit of this architectural approach is that standardized business object models and distributed object computing are combined to give an organization flexibility to improve effectiveness organizationally, operationally, and technologically. An enterprise is defined here as a system
15 Schussel, Edelstein.
16 Schussel, Edelstein.
comprised of multiple business systems or subsystems. Distributed/collaborative enterprise architectures are limited by a lack of commercially available object orientation analysis and
18 design method tools that focus on applications
3. Modeling of Geographic Analysis Process
This chapter examines the need for an abstract, standard, graphical language for modeling of geographic analysis process. The Unified Modeling Language is selected for that purpose. This section presents an overview of UML components and sketches how it could be used in the context of collaborative geographic analysis.
3.1 The Need for Modeling of Geographic Analysis Process
As described earlier, the complexity of a typical geographic analysis exercise makes it difficult to capture all the steps involved in the process. An abstract modeling language could be used to capture this process. The earlier example from the Urban Respiration project provides some desired characteristics for this modeling language, which should:
" describe the problem in a discipline-independent way, so as to allow collaboration and
communication across different disciplines,
e support analysis and synthesis of the problem at different levels of abstraction by
decomposing a problem into smaller parts that can be tackled by different researchers from different disciplines and then integrated seamlessly,
e encapsulate implementation details while focus on conceptual problem, and
* provide an application-independent description for the problem.
The Unified Modeling Language (UML) is a promising vehicle for meeting the above requirements. The Unified Modeling Language is a standard language for modeling large systems, especially ones that are software intensive. It could be used to visualize, specify, construct and document the components of such a system 19. UML represents the state-of-the-art
in the modeling of large systems, especially object-oriented software. It offers a flexible and wide range of modeling capabilities that could be used to describe a problem at different levels of abstraction, from the conceptual level to the implementation level.
A model is a simplification of reality, the design blueprint of a system or process. Models are
usually built to assist in the understanding of the systems or processes we are developing. In this context, UML performs four crucial functions:
* Visualizing the system at the development stage, * Specifying the structure and behavior of the system,
* Providing a guiding template during the implementation or construction of the system, * Documenting the system during the design and final stage 20
19
Booch et al, 1998, p13.
20 Booch et al, 1998, p5
3.2 Overview of the Unified Modeling Language
The emergence of object-oriented technology in the late seventies and early eighties resulted in several competing modeling languages and processes, including the Booch method21, Object-oriented Software Engineering22 and the Object Modeling Technique2 3. Each method offered a
modeling language for system analysis and design using object-oriented technology and each was best fit for a specific domain of problems. Since 1994 the authors of these three methodologies have been collaborating to produce a unified modeling language. In 1997 the Object Management Group (OMG) adopted UML as the standard, and a revised version 1.3 was released in fall 1998 24.
UML is currently considered the standard way to communicate object-oriented system designs.
Because UML is a graphical communication language and not a systems design process or methodology, it can be used with any of the earlier methodologies in whole or in part. In most cases it is possible to represent a system using a small subset of the UML 25
3.2.1 UML Elements
UML vocabulary includes three kinds of elements: 1. Things
2. Relationships
3. Diagrams
Things are abstractions of the different model elements. They are tied together using Relationships. Diagrams are meaningful groups of things and their relationships 26
UML divides things into four different categories: 1. Structural things
2. Behavioral things
3. Grouping things
4. Annotational things
Structural things are the static elements of the system, either physical or conceptual. They
include seven types: classes, interfaces, collaborations, use cases, active classes, components, and nodes. Behavioral things are the dynamic elements of the system which show the system's behavior over time and space. There are two kinds of behavioral elements: interaction and state
machine. Grouping things are packages or folders that are used to organize the model by grouping related elements of the model together. Annotational things are comments that can be attached to elements to add description or comments. There is only one kind, called a note.2
21 Booch, 1994. 22 Jacobson, 1994. 23 Rumbaugh et al, 1991. 24 Booch et al, 1998, xviii.
25 Booch et al, 1998, xviii. 26 Booch et al, 1998, p. 17.
UML divides relationships into four different categories: 1. Dependency
2. Association
3. Generalization
4. Realization
A dependency is a semantic relationship between things where a change in the independent thing
affects the semantic of the dependent thing. An association is a structural relationship that describes a connection among objects. A generalization is a parent/child relationship. The child object (specialized element) shares the structure and behavior of the parent object (generalized element) and is substitutable for it. A realization is a semantic relationship between classifiers where one classifier carries out (realizes) a certain function for another classifier. 28
3.2.2 UML Diagrams
UML divides diagrams into nine different kinds: 1. Class diagram
2. Object diagram
3. Use case diagram
4. Sequence diagram 5. Collaboration diagram 6. Statechart diagram 7. Activity diagram 8. Component diagram 9. Deployment diagram
A Class diagram is a static perspective of the system showing the classes, interfaces, and their
relationships. The Object diagram shows the instances of the Objects and their relationships. It represents the system prototype. A Use case diagram represents the behavior of the system by showing a set of use cases and actors with their relationships. A Sequence diagram and
Collaboration diagram are both types of the Interaction diagram. Interaction diagrams represent
a dynamic perspective of the system by showing the messages exchanged among the different objects. A Sequence diagram is an interaction diagram that orders the messages among the different system objects by time. A Collaboration diagram is an interaction diagram that orders the messages according to the structural organization of the objects. A Statechart diagram represents a dynamic perspective of the system by showing a state machine, which consists of
states, transitions, events and activities. An Activity diagram is a special kind of the statechart diagram. It shows the flow of activities within the system. A Component diagram represents a static perspective of the system. It shows the organization and dependencies among the different components of the system. These components usually represent the system classes, interfaces or collaborations. A Deployment diagram shows a static perspective of the system run-time processing nodes configuration. Through these nine types of diagrams, UML presents a graphical language that can describe all aspects of the system whether static or dynamic29
28 Booch et al, 1998, pp. 23-4. 29 Booch et al, 1998, pp. 24-6.
3.3 Using Activity Diagrams to Model Geographic Processes
Activity diagrams in particular seem useful for describing geographic analysis processes in an abstract fashion. An activity diagram represents a dynamic sequential model of the system. It shows the flow of an object as its state changes due to the application of a certain activity or series of activities. Among the nine different diagrams available in UML, activity diagrams are the most suitable subset for modeling geographic processes. It models a dynamic aspect of the system by tracing the state of an object after the application of some activities. In this context an Activity Diagram will graphically describe the change of state of a map layer (or layers) through the application of a sequence of activities. An Activity represents a spatial function to be performed on the input layer(s) and would results in a change in the state of the layer(s).
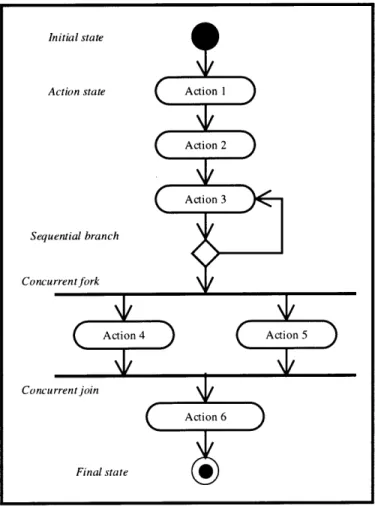
3.3.1 Activity Diagrams Elements
Activity diagrams usually contain the following elements:
1. Action States
2. Activity states
3. Transitions
* Sequential transitions
* Branching Initial state
* Forking and Joining
An Action state represents a process that Action state Action 1
occurs within the system. For example
multiplying each value in a grid layer by an Action 2
integer value resulting in a modified grid layer. An Action state is atomic and can not
be further decomposed. An Activity state is Action 3
similar to an action state but can be further
decomposed. It represents another activity Sequential branch
diagram. Transitions are used to pass
control from one action or activity state to Concurrentfork
the next one. Simple sequential transitions move directly from one state to the next
state. Branching is a kind of transition that
occurs when there is a decision to be made.
The next action or activity depends on the Concurrentjoin
result of this Boolean decision. Forking and Action 6
joining are other special kinds of transitions. They are used when there are several
concurrent paths of actions or activities to Final state
be performed.30 I______________________
Figure 3.1: Elements of an Activity Diagram
3.3.2 An Example from the Urban Respiration Project
Having all the layers from the earlier Urban Respiration example integrated on the same GIS, they can be used to perform geographic analysis that attempts to understand the relationship between air pollution measurements and landuse, roads, weather, and other parameters. This example uses UML activity diagrams to design and model the analysis process.
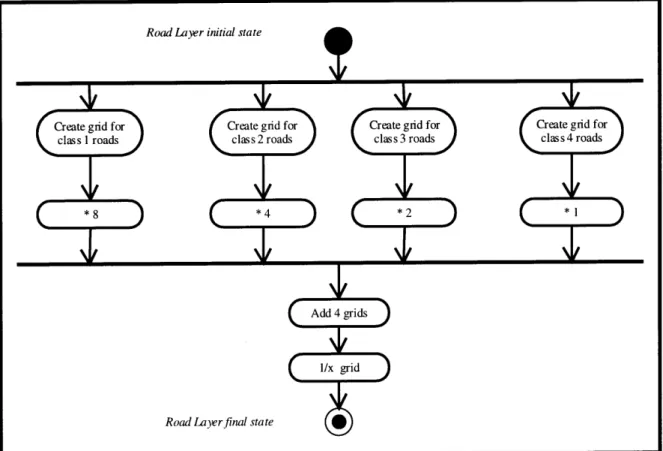
The first part of the process includes building a model representing the relationship between road network and levels of certain trace-gases associated with auto-emissions. The hypothesis is that surface levels of these trace-gases are proportional to road class (highways, major roads, and local roads) and decrease proportionally as the distance to the road increase. Using the road layer, 4 grids are built each representing a road class. Grid cell values represent the distance to the closest road. It shows a value of 0 at the road and increases as you go away from it (which is the opposite of the desired relationship). Each grid represents the effect of a road class. The four grids are then added together using different weights emphasizing, for example, highways over local roads. By applying the operator l/x on all the values in the grid, it reflects the desired pattern, proportionally decreasing values as the distance to the road increases. It shows a hypothetical pattern of the impact of "road density". This pattern needs to be calibrated and tested later. A possible way to calibrate it is by changing the weights used in adding the grids. These weights represent parameters that can be modified in several iterations to test several
hypotheses about this relationship.
Figure 3.2: UML Activity Diagram for the roads Model
Road Layer initial state
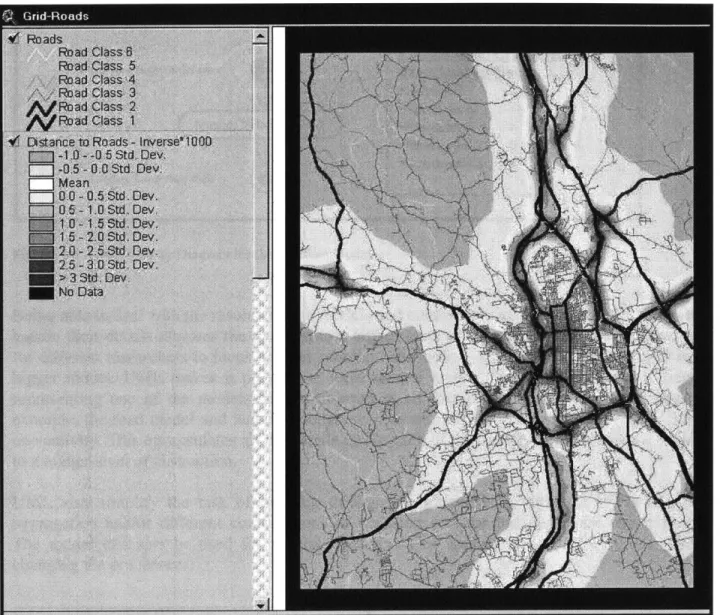
Figure 3.3: Raster grid for road model
Similarly, a model is built to represent a hypothetical relationship between landuse and levels of trace-gas emissions. Each landuse category (e.g. industrial, commercial, residential) is assumed to have a particular average level of emissions represented by a lookup table. A grid is created to represent this relationship. The values in the lookup table are parameters that can be used to verify and calibrate this relationship.
In the Urban Respiration project, other factors are also taken into considerations (weather and demographics) but are not described in this document. The final model represents an aggregation of all these different factors to create one grid showing the pollution concentration of trace gases. This model needs to be verified and calibrated using the real field measurements.
Landuse Activity Diagram
Lookup table: CH4 levels Landuse Layer iitial state from landuse (ppb):
-Industrial 23
-Commercial 10
Multiply by lookup table 1 -Residential 1 4
-Residential 2 6
-Residential 3 8
Landuse Layer final state
Figure 3.4: UML Activity Diagram for the Landuse Model
Being able to deal with the results of both models and combine them together without the need to handle their details elevates the problem to a higher level of abstraction and creates a platform for different researchers to focus on their specific contribution which can then be plugged in the bigger model. UML makes it possible to have several levels of nesting. An activity diagram representing one of the models can be inserted in another diagram as a single activity. For example, the road model and landuse model are inserted in the combined model (figure 3.5) as one activity. This encapsulates all the details inside each of the models and elevates the problem to a higher level of abstraction.
UML also simplify the task of iterating through the model using
aggregation and/or different combinations of emission sources and The model can also be used for several trace gases or applied at changing the procedures.
different levels of spatial dispersion characteristics. several locations without
Figure 3.5: UML Activity Diagram for the combined roads and landuse model
4. System Architectures for Managing GIS Processing
As described earlier, a system architecture refers to the overall design of the system components and their interactions. This chapter provides a description for the desired system functionality and characteristics and the system components. Several alternative system architectures are then examined to select a prototype system architecture. This chapter examines the prototype architecture and implementation in more details.
4.1 System Functionality
The main idea of this project is to design and prototype a system architecture to manage the geographic analysis process in a distributed environment. The system should allow the users to:
" model the analysis process using an abstract modeling language such as the Unified
Modeling Language, which allows the user to graphically represent, document, and communicate the analysis process in a standard language, and re-run it as a macro using different parameters and data sets,
e have access to spatial data repositories stored on different data servers in different
formats,
" have access to different geo-processing services available on different application servers
in a distributed environment, and
" provide a user-friendly client with a Graphical User Interface to manage this process.
4.2 System Characteristics
To achieve the previous design goals, the system architecture and prototype need to provide a modular, open, distributed and user-friendly design.
1. A modular design:
* uses Component-based software development,
e allows for adding or calling components (services) on demand, e integrates products from different vendors and platforms, and
" can be customized to different users' needs.
2. An open design:
0 allows different software component to communicate using standard application
programming interfaces (APIs),
e allows for the easy development of new components that integrate seamlessly, and e is portable across different systems and platforms.
3. A distributed design:
e is aligned with the current distributed organizational needs, e allows collaboration by sharing data & services, and
4. A user-friendly design:
0 has a fast learning curve with lower training costs,
* attracts a large user base, and
e allows quick prototyping of an analysis model.
The implemented prototype satisfies some of these desired characteristics but not all of them. The final discussion will include an evaluation of the prototype and the implementation tools used, and their limitations.
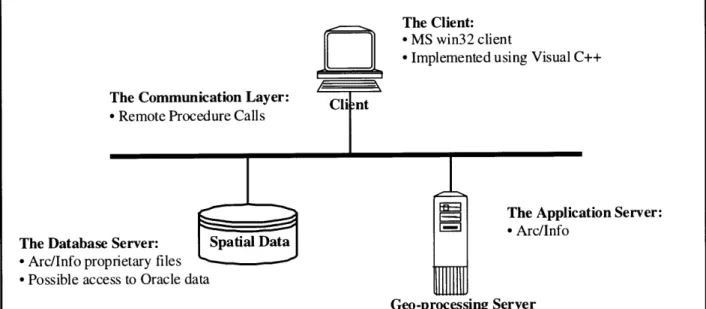
4.3 Proposed System Architecture
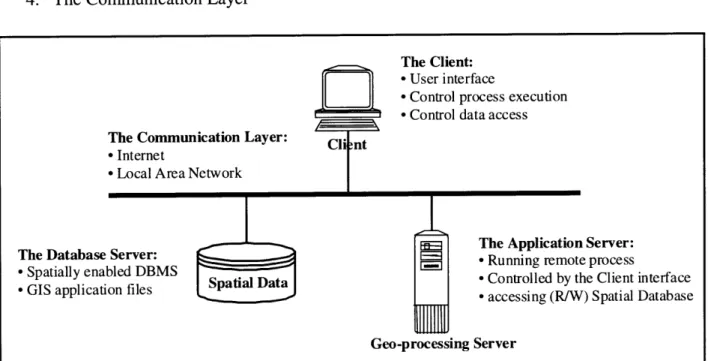
To achieve the previous design goals and characteristics, three-tier client/server architecture with an application server is proposed.
There are four main components in this architecture:
1. The Client
2. The Application Server (Geo-processing Server)
3. The Database Server (Spatial Database Server)
4. The Communication Layer
The Client:
- User interface
-Control process execution * Control data access
The Communication Layer: Clint
-Internet
-Local Area Network
T Dta The Application Server:
The Database Server: E=== - Running remote process
" Spatially enabled DBMS Runig eot pocs
GIS application files Spatial Data - Controlled by the Client interface- accessing (R/W) Spatial Database
Geo-processing Server
Figure 4.1: Proposed general system architecture
The Client represents the main module in the system. It contains the user interface and the modeling module. It allows the user to design a graphical model for the analysis process using
UML and to display the associated map layers. It is also responsible for controlling the execution
of the analysis using the geo-processing server and handling the database access on the different data servers.
The Geo-processing Server represents the application server that executes the geographic
processes on geographically referenced data. The details of the server location and management are transparent to the user. Several servers could be available on the network and provide a range of geo-processing services on demand.
The Spatial Database Server represents a repository of geographically referenced data. The data
could be stored either in a database system or as files. The details of the communication between the client and the data server are transparent to the user.
The Communication layer represents the network communication between the client, application
server and database server. This layer should be transparent to the user.
4.4 Design Alternatives
Several design alternatives exist for each of the four main system components.
4.4.1 The Client
Two main alternatives are available for the implementation of the client prototype. The first, and probably most suitable to the above-mentioned criteria, is using a platform-independent component. An example is Java and ActiveX components.
The Java model is widely portable, flexible and Internet friendly. Java provides seamless access APIs to databases using JDBC. The drawbacks of using Java are the primitive user interface and the implied security model that restricts access to local data on the client. Another limitation is the slow execution due to the presence of the Java Virtual Machine as an extra interpreting layer. This is extremely important when handling massive geographic data. Some of these limitations still exist even if the prototype is developed as a Java application. ActiveX components have less security limitations but are restricted to using a Microsoft browser.3'
The second alternative is to use a platform dependent development environment. This will allow for the full exploitation of the platform specific strengths and access to system resources, while limiting the portability of the client application. It also allows for the development of a more
sophisticated Graphical User Interface.
4.4.2 The Geo-processing Server
A geo-processing server is an application server that is capable of providing geographic services. A geographic service is a computational process applied on geographically referenced data. In a client/server environment, a geo-processing server would receive a request to perform a geographic service. The required data can be either sent as a stream to the server or sent as a query from another database server. An example is the MIT Orthophoto browser. The server is sent a request to provide a specific image layer. The coordinates of the required image are sent as a stream of data to the server. The server accesses an image data repository on a data server, performs the process of preparing the required image and then sends it in the required format3 2 31 www.javasoft.com, www.microsoft.com
4.4.3 The Spatial Database Server
Spatial data can be stored and managed in two different ways. The first way is to store the data in an ordinary file system, usually using proprietary formats (e.g. shape files). This is only practical with a small amount of data or a limited number of users. Currently most spatial data is stored in this way resulting in many data management problems.
The second way is to use a spatially enabled database Server. Some relational database vendors have started to provide extensions that allow for improved storage of spatial data within the database server. Using Oracle Spatial Cartridge for example, spatially referenced data can be stored, indexed and accessed through Oracle database33. Other vendors are planning to support similar configurations.
4.4.4 The Communication Layer
Operating in a distributed environment requires handling several layers of complexity in terms of communication among different platforms using different protocols. The objective of this prototype is to avoid these layers of complexity and provide the user with a simple transparent
access to the data and geo-processing servers.
Using a distributed object model like Microsoft's COM (Component Object Model), Sun Microsystems' JAVA Beans or OMG's CORBA (Component Object Resource Broker) provides a possible solution34. In this model the application is divided into small components that reside on different machines and communicate with each other using a resource broker. This three-tier client/server architecture with an object resource broker is useful when developing a new environment. It is not applicable when integrating several vendor-specific environments since current GIS software is not designed to work with these emerging architectures in a non-proprietary way.
Another possibility is by invoking Remote Procedure Calls. RPCs provide a mechanism for communication among different applications. It is based on the concept of procedural programming where a procedure is called to perform a specific function. It is passed in parameters and returns back modified values. RPC extends this concept from within one application to among different applications. Sun Microsystems' implementation of RPC allows for communication among different platforms and has long been supported on UNIX platforms.
33 www.oracle.com
4.5
Implemented System Architecture
Selecting from the previous alternatives to develop a system architecture for the prototype implementation is a challenging task. Some of the alternatives provide better performance but are not easy to implement. The following architecture was selected for the prototype implementation:
The client is developed in a win32 environment using Visual C++. Although a platform specific implementation limits the use of this prototype, it allows for the full utilization of a powerful set of programming tools and graphical user interface. The next decision was to use Arc/Info as an
application server using RPC as a communication layer. The choice was between using a
well-developed commercial package as an application server or building a limited number of geographical services from scratch. The former alternative provides a powerful library of geographic services, but restricts the data format to Arc/Info's proprietary file format. The later alternative severely limits the services available in the prototype. Running Arc/Info as a server implies using RPC at the communication layer. Arc/Info Inter-Application Communication
(IAC) interface allows Arc/Info to receive calls from other applications and executes them
locally. The main limitation is that the data involved in such a call must reside in a network location accessible to the Arc/Info server. It also must be in a location accessible to the client through a mapped network drive in order to display the processed layers. RPC masks several layers of complexity from the user and treats the remotely controlled program as a local extension of the client. Arc/Info and Arc/View accept RPCs that allow for the exploitation of their functionalities. Other custom libraries could be compiled to accept RPCs with a few
modifications.
The Client:
- MS win32 client
- Implemented using Visual C++
The Communication Layer: Cli mt -Remote Procedure Calls
F=== The Application Server: _ - Arc/Info
The Database Server: Spatial Data
- Arc/Info proprietary files - Possible access to Oracle data
Geo-processing Server
5.
Prototype Implementation
A prototype was implemented on a win32 platform using Visual C++ to illustrate and test some
of the previous concepts and system architecture. This chapter describes the prototype implementation. Next chapter uses some of the examples discussed earlier from the Urban Respiration project to illustrate how the prototype functions, and to highlight some of the implementation issues and tradeoffs.
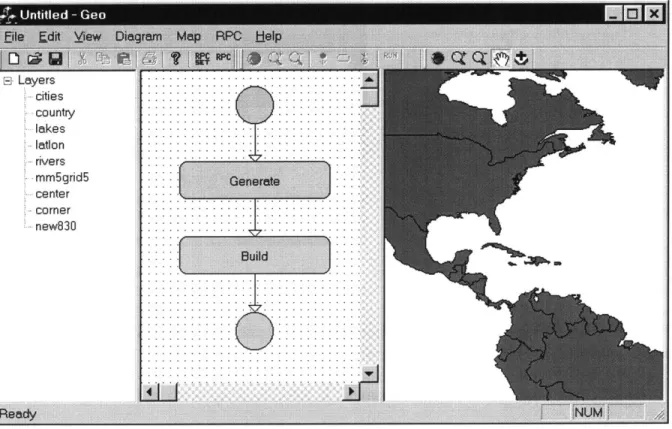
5.1 The Client Application
The client application (named Geo) contains three main components. The first view contains a tree listing of all the map layers in the current workspace.
diagram. The third view contains a map display.
The second view contains a UML
.Untitled
- Geo
5.2 Using the Client
5.2.1 Creating the Model
Using the Diagram view, the user can design the UML model for the analysis. The prototype implementation is limited to a single path linear model starting with an initial node that refers to the initial layer, then adding several actions each implementing an Arc/Info command, and ending with a final state which refers to the output layer of this model. The model is executed sequentially. The output layer of each action is considered as the input layer for the following actions. Since Arc/Info uses a proprietary format, at the end of model run all the layers used (initial, intermediary and final) are converted to a shape file format, which is viewable through the map view.
PROJECT <COVER FILE> <input> <output> {projection-file
Arc/Info Command Paramneters
p ro je ct cover
In Layer Parameters Out Layer
0_.L ayer 1_Layer
Parameters
iationprjl
I l a t o n p jIO
K C a n c e l
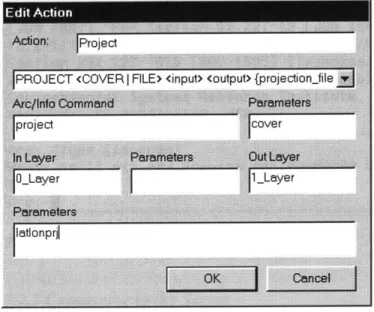
Figure 5.2: Action Dialog
By double clicking on any of the diagram components, the user can change the parameters of this
specific component from the Edit Action dialog. The parameters contain the command, input and output layers, and any other parameters required. The input and output layers are assigned
automatically to follow the sequential order of the model.
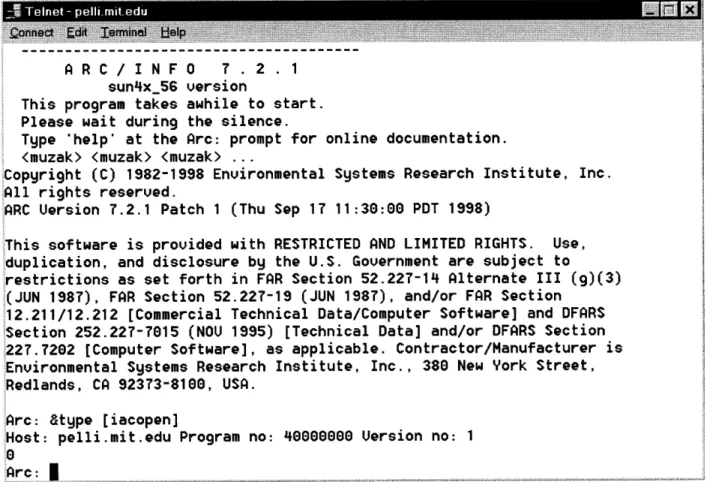
5.2.2 Configuring the Server
Before the model can be run, the Arc/Info server needs to be opened and connected to the client. To open the Arc/Info server, run Arc/Info and then open the AI-IAC (Arc/Info Inter-Application Connectivity). Arc/Info responds by giving the server name, program number and version number. These three parameters are required for the client to correctly connect to this Arc/Info
IAC session (note that the numbers are in hexadecimal). Arc/Info remains available for the local
user as well as the remote user. It maintains a queue of commands entered. If the Arc/Info session is closed, the client connection to the server is lost.