HAL Id: hal-00296835
https://hal.archives-ouvertes.fr/hal-00296835
Submitted on 29 Mar 2005
HAL is a multi-disciplinary open access
archive for the deposit and dissemination of
sci-entific research documents, whether they are
pub-lished or not. The documents may come from
teaching and research institutions in France or
abroad, or from public or private research centers.
L’archive ouverte pluridisciplinaire HAL, est
destinée au dépôt et à la diffusion de documents
scientifiques de niveau recherche, publiés ou non,
émanant des établissements d’enseignement et de
recherche français ou étrangers, des laboratoires
publics ou privés.
Coupling a distributed grid based hydrological model
and MM5 meteorological model for flooding alert
mapping
B. Tomassetti, E. Coppola, M. Verdecchia, G. Visconti
To cite this version:
B. Tomassetti, E. Coppola, M. Verdecchia, G. Visconti. Coupling a distributed grid based hydrological
model and MM5 meteorological model for flooding alert mapping. Advances in Geosciences, European
Geosciences Union, 2005, 2, pp.59-63. �hal-00296835�
© 2005 Author(s). This work is licensed under a Creative Commons License.
Coupling a distributed grid based hydrological model and MM5
meteorological model for flooding alert mapping
B. Tomassetti, E. Coppola, M. Verdecchia, and G. Visconti
Centro di Eccellenza CETEMPS, Universit`a dell’Aquila, Italy
Received: 29 October 2004 – Revised: 8 February 2005 – Accepted: 16 February 2005 – Published: 29 March 2005
Abstract. The increased number of extreme rainfall events
seems to be one of the common feature of climate change signal all over the world (Easterlin et al., 2000; Meehl et al., 2000). In the last few years a large number of floods caused by extreme meteorological events has been observed over the river basins of Mediterranean area and they mainly affected small basins (few hundreds until few thousands of square kilometres of drainage area) . A strategic goal of applied me-teorology is now to try to predict with high spatial resolution the segments of drainage network where floods may occur. A possible way to reach this aim is the coupling of meteo-rological mesoscale model with high resolution hydmeteo-rological model. In this work few case studies of observed floods in the Italian Mediterranean area will be presented. It is shown how a distributed hydrological model, using the precipita-tion fields predicted by MM5 meteorological model, is able to highlight the area where the major floods may occur.
1 Introduction
In the Center of Excellence for the Integration of Remote Sensing Techniques and Numerical Modelling for the Fore-cast of Severe Weather (CETEMPS) of the University of L’Aquila the MM5 PSU/NCAR (mesoscale Model 5 of Pennsylvania State University/National Center for Atmo-spheric Research) has been made operational since 1999. The horizontal resolution of the model (3 Km) is compara-ble to typical resolution of hydrological model and then the predicted rainfall fields are suitable to be used as input for hydrological modelling (Wilby et al., 1997).
Within the activities of the Center, a distributed hydrolog-ical model has also been developed; one of the main char-acteristics of the model is the possibility to rebuilt the rain-fall field on the model grid, acquiring and merging observed and simulated data. The final goal is to be able to predict Correspondence to: M. Verdecchia
flow discharge on a given domain, making simulation that span from few days in the past until few days in the future. For the past time step all the available observational data are used, for example rain gauge measurements, radar and satel-lite estimation, while for the future time step the precipitation field is rebuilt on hourly base using the meteorological model forecast.
Cetemps HYdrological Model (CHYM) is now being cali-brated in order to reproduce the observed flow discharge time series. Here we described a first application tool based on the flow-scheme calculated by the model that is able to produce an alarm map of the simulated domain. We show as, in all the simulated case studies, the tool is able to highlight the segment of the drainage network where floods actually oc-curred.
In the next two sections a short description of MM5 and CHYM models are given and in Sect. 4 the proposed alarm index is described. In the last section the practical application of the alarm hydrological mapping tool is described and it is shown how it allows to well detect the areas where important floods actually occurred.
2 MM5 model
For this study meteorological simulation are carried out us-ing the non hydrostatic version of MM5 Mesoscale Model from NCAR/PSU (Dudhia, 1993 and Grell et al., 1994). The model explicitly solves the primitive equations and includes a multiple two-way nest capability. For all the simulation discussed here MM5 configuration is the same used for oper-ational activities of CETEMPS group: it uses 24 sigma lev-els not equally spaced, MRF parameterization for planetary boundary layer (Troen and Mahrt, 1986) and Kain-Fritsch cumulus convection parameterization associated to an ex-plicit configuration of cloud water and rain (Kain and Fritsch, 1993). For the present study simulations are carried out using three nested domains with respectively 27, 9 and 3 km of res-olution and innermost higher resres-olution domain is centred for
60 B. Tomassetti et al.: Grid based hydrological model and MM5 meteorological model Plinius Conf. 2004 – Mediterranean Sea
Draft paper 1
Coupling a distributed grid based hydrological model and MM5
meteorological model for flooding alert mapping
Barbara Tomassetti, Erika Coppola, Marco Verdecchia, and Guido Visconti (1) Centro di Eccellenza CETEMPS, Università dell’Aquila, Italy
Via Vetoio, Coppito, L’Aquila, Italy – E-mail [email protected]
Submitted to EGU Advances in Geosciences
October 2004,
in final form February 2005 (vers. 2.2)
Correspondence to Marco Verdecchia ([email protected])
ABSTRACT.
The increased number of extreme rainfall events seems to be one of the common feature of climate change signal all over the world (Easterlin et Al., 2000, Meehl et Al., 2000). In the last few years a large number of floods caused by extreme meteorological events has been observed over the river basins of Mediterranean area and they mainly affected small basins (few hundreds until few thousands of square kilometres of drainage area) . A strategic goal of applied meteorology is now to try to predict with high spatial resolution the segments of drainage network where floods may occur. A possible way to reach this aim is the coupling of meteorological mesoscale model with high resolution hydrological model. In this work few case studies of observed floods in the Italian Mediterranean area will be presented. It is shown how a distributed hydrological model, using the precipitation fields predicted by MM5 meteorological model, is able to highlight the area where the major floods may occur.
1. Introduction
In the Center of Excellence for the Integration of Remote Sensing Techniques and Numerical Modelling for the Forecast of Severe Weather (CETEMPS) of the University of L’Aquila the MM5 PSU/NCAR (mesoscale Model 5 of Pennsylvania State University/National Center for Atmospheric Research) has been made operational since 1999. The horizontal resolution of the model (3 Km) is comparable to typical resolution of hydrological model and then the predicted rainfall fields are suitable to be used as input for hydrological modelling (Wilby et Al., 1997).
Within the activities of the Center, a distributed hydrological model has also been developed; one of the main characteristics of the model is the possibility to rebuilt the rainfall field on the model grid, acquiring and merging observed and simulated data. The final goal is to be able to predict flow discharge on a given domain, making simulation that span from few days in the past until few days in the future. For the past time step all the available observational data are used, for example rain gauge
measurements, radar and satellite estimation, while for the future time step the precipitation field is rebuilt on hourly base using the meteorological model forecast.
Cetemps HYdrological Model (CHYM) is now being calibrated in order to reproduce the observed flow discharge time series. Here we described a first application tool based on the flow-scheme calculated by the model that is able to produce an alarm map of the simulated domain. We show as, in all the case studies simulated, the tool is able to highlight the segment of the drainage network where floods actually occurred.
In the next two sections a short description of MM5 and CHYM models are given and in section 4 the proposed alarm index is described. In the last section the practical application of the alarm hydrological mapping tool is described and it is shown how it allows to well detect the areas where important floods actually occurred.
Figure 1: MM5 simulation for September 9-10, 2000: two-day accumulated precipitationFig. 1. MM5 simulation for 9–10 September 2000: two-day accu-(cm) for the Soverato case.
mulated precipitation (cm) for the Soverato case.
all the case studies in the zone where flood events occurred. All the simulation are driven using ECMWF (European Cen-ter for Medium-range Weather Forecast) global analyses and forecast and Boundary Conditions are upgraded every 6 h. Figure 1 shows the 48 h accumulated rain as predicted by the model for one of three case studies discussed in the last sec-tion.
3 CHYM model
The Cetemps HYdrological Model is a grid based distributed Model that can be run in any geographical domain and with any resolution up to the resolution of the implemented Digi-tal Elevation Model (DEM), i.e. about 300 m; for operational purpose the capability to simulate an arbitrary domain cor-responds to the need to run the model for those river basins that are more stressed by the current meteorological events. CHYM model simulates the hydrological processes using an approach similar to other models (Todini et al., 2002; Borah et al., 2002) and the calibration of the model to realistically simulate the flow discharge for the Central Italy is still in progress. A complete description of the model (Coppola et al., 2003; Tomassetti et al., 2003, Coppola et al., 20051) is beyond the scope of this paper and we quickly describe here only a couple of aspects that are important for the application described in this paper.
1 Coppola, E., Tomassetti, B., Verdecchia, M., Visconti G.: CHYM – A grid-based hydrological model: description of algo-rithms for determination of drainage structure and combination of simulated and observed rainfall data, in preparation, 2005.
Plinius Conf. 2004 – Mediterranean Sea
2
2. MM5 Model
For this study meteorological simulation are carried out using the non hydrostatic version of MM5 Mesoscale Model from NCAR/PSU (Dudhia, 1993 and Grell et Al., 1994). The model explicitly solves the primitive equations and includes a multiple two-way nest capability. For all the simulation discussed here MM5 configuration is the same used for operational activities of CETEMPS group: it uses 24 sigma levels not equally spaced, MRF parameterization for planetary boundary layer (Troen and Mahrt, 1986) and Kain-Fritsch cumulus convection parameterization associated to an explicit configuration of cloud water and rain (Kain and Fritsch, 1993). For the present study simulations are carried out using three nested domains wth respectively 27, 9 and 3 Km of resolution and innermost higher resolution domain is centred for all the case studies in the zone where flood events occurred. All the simulation are driven using ECMWF (European Center for Medium-range Weather Forecast) global analyses and forecast and Boundary Conditions are upgraded every 6 hours. Fig.1 shows the 48 hours accumulated rain as predicted by the model for one of three case studies discussed in the last section.
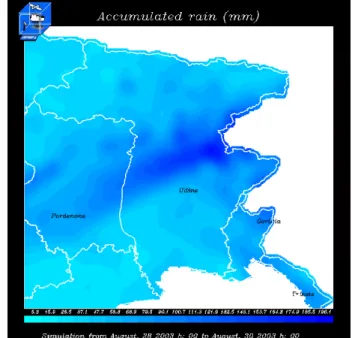
Figure 2 Accumulated rain field as assimilated by CHYM model for the Val Canale event.
3. CHYM Model
The Cetemps HYdrological Model is a grid based distributed Model that can be run in any geographical domain and with any resolution up to the resolution of the implemented Digital Elevation Model (DEM), i.e. about 300 meters; for operational purpose the capability to simulate an arbitrary domain corresponds to the need to run the model for those river basins that are more stressed by
the current meteorological events. CHYM model simulates the hydrological processes using an approach similar to other models (Todini et Al., 2002, Borah et Al., 2002) and the calibration of the model to realistically simulate the flow discharge for the Central Italy is still in progress. A complete description of the model (Coppola et Al., 2003, Tomassetti et Al., 2003) is beyond the scope of this paper and we quickly describe here only a couple of aspects that are important for the application described in this paper. The architectural characteristics of model have been designed to assimilate different data sources for the estimation of rainfall field on the model grid. For the operational activities rainfall is estimated on CHYM grid at hourly time step using observed data for the past and meteorological model simulation for the future. The observed data are taken from a rain gauge network operating in the Central Italy and also rain estimation are obtained using radar measurements and infrared signal from geostationary satellite platform. When different data sources are available at same time step, these are assimilated with different priorities using a Cellular Automata based algorithm quickly described in the following. An example of assimilation of MM5 predicted rainfall is shown in Fig. 2.
Figura 3: CHYM alarm map for the Soverato flood, alarm index is calculated from September 9, 2000 h: 12 until September 11 2000 h: 12.
Starting from the DEM matrix for each cell is defined the flow direction. According to the minimum energy principle the flow direction is assumed that for which the slope is maximum, this corresponds to the assumption that flow occurs with a strong preferential direction. Due to the finite resolution of the DEM few singularities are usually found for those cells for which it is not possible to coherently establish the flow direction. In order to solve these singularities, a Cellular Automata based algorithm is used for smoothing the DEM: the height of those cells where flow direction has been already calculated is taken fixed
Fig. 2. Accumulated rain field as assimilated by CHYM model for
the Val Canale event.
The architectural characteristics of model have been de-signed to assimilate different data sources for the estimation of rainfall field on the model grid. For the operational activ-ities rainfall is estimated on CHYM grid at hourly time step using observed data for the past and meteorological model simulation for the future. The observed data are taken from a rain gauge network operating in the Central Italy and also rain estimation are obtained using radar measurements and infrared signal from geostationary satellite platform. When different data sources are available at same time step, these are assimilated with different priorities using a Cellular Au-tomata based algorithm quickly described in the following. An example of assimilation of MM5 predicted rainfall is shown in Fig. 2.
Starting from the DEM matrix for each cell is defined the flow direction. According to the minimum energy principle the flow direction is assumed that for which the slope is max-imum, this corresponds to the assumption that flow occurs with a strong preferential direction. Due to the finite resolu-tion of the DEM few singularities are usually found for those cells for which it is not possible to coherently establish the flow direction. In order to solve these singularities, a Cellular Automata based algorithm is used for smoothing the DEM: the height of those cells where flow direction has been al-ready calculated is taken fixed and is slightly smoothed for the other cells; the smoothing is established according to the average height of surrounding cells. The algorithm is iterated until the flow direction is established for each grid point. De-spite the final goal is the real time flood forecasting on the simulated domain, a first operational version of the model al-lows to obtain a sort of flood alarm index using only the flow scheme and rainfall estimation. The alarm index is discussed in the next session.
B. Tomassetti et al.: Grid based hydrological model and MM5 meteorological model 61
4 The flood alarm index
An alarm index is estimated for each cell of CHYM hydro-logical model as the ratio of total drained rain in the last 48 hours and total drain surface, this correspond to the average rainfall in the upstream basin of each cell. Both the drained rain and drained surface are calculated iterating the following step:
1. from each cell a “stone” rolls down to the sea following the flow direction map calculated from the DEM 2. each time a stone pass by a cell a counter is incremented
for that cell
These steps are iterated until all the “stones” have reached the sea. At the end of the iteration we have a matrix con-taining the total number of cells drained by each grid point and this matrix can be used for many purposes, for example to distinguish cells where runoff occur overland from cells where runoff occur along channel. In addition the algorithm can be generalized to estimate different quantities: for exam-ple if the area of the starting cell is associated to the “stones” we can estimate the total area drained by each cell, while if the rainfall in the starting cell is associated to the ”stones” we can estimate the total drained rain.
The choice of 48 h as time interval is justified both by em-pirical observations discussed in the next section and by the fact that this corresponds to a typical runoff time for the river basins simulated in this work, namely a sort of typical time interval that a rain drop would take to arrive at the mouth of the river; we also notice how the total drained area is pro-portional, as a first approximation, to the river cross section (see as an example Borah et al., 2002) and then the proposed flood alarm index is a sort of measure of river stress.
What is more important for operational activities and for actual use of the model for flood alert mapping is that the proposed alarm index seems to be suitable to highlight the section of the drainage network that was actually interested by flood events at least for all the case-studies reported in this study and discussed in the next session. An example of alarm mapping for one of the case studies is shown in Fig. 3.
5 Case studies
Three case studies have been selected for different region of Italy:
1. The Soverato flood – 9–10 September 2000 (Figs. 1 and 3). Soverato torrent drains an area of few hundreds of square kilometres and is situated in Southern Italy’s Cal-abria Region. Flooding occurred between the towns of Soverato and Montepaone after a prolonged and intense precipitation event, causing landslides, great disruption and losses of life. Rainfall peaks above 300 mm in 24 h was recorded close to the village of Soverato (Montani et al., 2003).
2
2. MM5 Model
For this study meteorological simulation are carried out using the non hydrostatic version of MM5 Mesoscale Model from NCAR/PSU (Dudhia, 1993 and Grell et Al., 1994). The model explicitly solves the primitive equations and includes a multiple two-way nest capability. For all the simulation discussed here MM5 configuration is the same used for operational activities of CETEMPS group: it uses 24 sigma levels not equally spaced, MRF parameterization for planetary boundary layer (Troen and Mahrt, 1986) and Kain-Fritsch cumulus convection parameterization associated to an explicit configuration of cloud water and rain (Kain and Fritsch, 1993). For the present study simulations are carried out using three nested domains wth respectively 27, 9 and 3 Km of resolution and innermost higher resolution domain is centred for all the case studies in the zone where flood events occurred. All the simulation are driven using ECMWF (European Center for
Medium-range Weather Forecast) global analyses and forecast and
Boundary Conditions are upgraded every 6 hours. Fig.1 shows the 48 hours accumulated rain as predicted by the model for one of three case studies discussed in the last section.
Figure 2 Accumulated rain field as assimilated by CHYM model for the Val Canale event.
3. CHYM Model
The Cetemps HYdrological Model is a grid based distributed Model that can be run in any geographical domain and with any resolution up to the resolution of the implemented Digital Elevation Model (DEM), i.e. about 300 meters; for operational purpose the capability to simulate an arbitrary domain corresponds to the need to run the model for those river basins that are more stressed by
the current meteorological events. CHYM model simulates the hydrological processes using an approach similar to other models (Todini et Al., 2002, Borah et Al., 2002) and the calibration of the model to realistically simulate the flow discharge for the Central Italy is still in progress. A complete description of the model (Coppola et Al., 2003, Tomassetti et Al., 2003) is beyond the scope of this paper and we quickly describe here only a couple of aspects that are important for the application described in this paper. The architectural characteristics of model have been designed to assimilate different data sources for the estimation of rainfall field on the model grid. For the operational activities rainfall is estimated on CHYM grid at hourly time step using observed data for the past and meteorological model simulation for the future. The observed data are taken from a rain gauge network operating in the Central Italy and also rain estimation are obtained using radar measurements and infrared signal from geostationary satellite platform. When different data sources are available at same time step, these are assimilated with different priorities using a Cellular Automata based algorithm quickly described in the following. An example of assimilation of MM5 predicted rainfall is shown in Fig. 2.
Figura 3: CHYM alarm map for the Soverato flood, alarm index is calculated from September 9, 2000 h: 12 until September 11 2000 h: 12.
Starting from the DEM matrix for each cell is defined the flow direction. According to the minimum energy principle the flow direction is assumed that for which the slope is maximum, this corresponds to the assumption that flow occurs with a strong preferential direction. Due to the finite resolution of the DEM few singularities are usually found for those cells for which it is not possible to coherently establish the flow direction. In order to solve these singularities, a Cellular Automata based algorithm is used for smoothing the DEM: the height of those cells where flow direction has been already calculated is taken fixed
Fig. 3. CHYM alarm map for the Soverato flood, alarm index is
calculated from 9 September 2000, h: 12 until 11 September 2000, h: 12.
Plinius Conf. 2004 – Mediterranean Sea
3 and is slightly smoothed for the other cells; the smoothing
is established according to the average height of surrounding cells. The algorithm is iterated until the flow direction is established for each grid point. Despite the final goal is the real time flood forecasting on the simulated domain, a first operational version of the model allows to obtain a sort of flood alarm index using only the flow scheme and rainfall estimation. The alarm index is discussed in the next session
4. The Flood Alarm Index
An alarm index is estimated for each cell of CHYM hydrological model as the ratio of total drained rain in the last 48 hours and total drain surface, this correspond to the average rainfall in the upstream basin of each cell. Both the drained rain and drained surface are calculated iterating the following step:
1) from each cell a "stone" rolls down to the sea following the flow direction map calculated from the DEM
2) each time a stone pass by a cell a counter is incremented for that cell
These steps are iterated until all the "stones" have reached the sea. At the end of the iteration we have a matrix containing the total number of cells drained by each grid point and this matrix can be used for many purpose, for example to distinguish cells where runoff occur overland from cells where runoff occur along channel. In addition the algorithm can be generalized to estimate different quantities: for example if the area of the starting cell is associated to the "stones" we can estimate the total area drained by each cell, while if the rainfall in the starting cell is associated to the "stones" we can estimate the total drained rain.
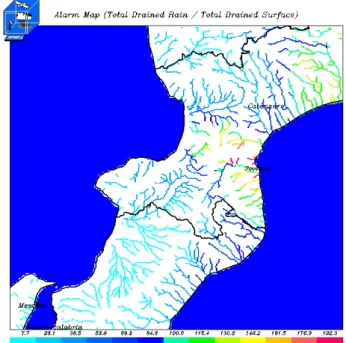
Figura 4: CHYM alarm map for the Val Canale event, alarm index is calculated from August 28, 2003 h: 00 until August 30 , 2003 : 00.
The choice of 48 hours as time interval is justified both by empirical observations discussed in the next section and by the fact that this corresponds to a typical runoff time for the river basins simulated in this work, namely a sort of typical time interval that a rain drop would take to arrive at the mouth of the river; we also notice how the total drained area is proportional, as a first approximation, to the river cross section (see as an example Borah et Al., 2002) and then the proposed flood alarm index is a sort measure of river stress.
What is more important for operational activities and for actual use of the model for flood alert mapping is that the proposed alarm index seems to be suitable to highlight the section of the drainage network that was actually interested by flood events at least for all the case-studies reported in this study and discussed in the next session. An example of alarm mapping for one of the case studies is shown in Fig. 3.
Figure 5: MM5 simulation for January 24-26 2003: two-day
accumulated precipitation (cm).. The river beds Trigno and Sangro are highlighted.
5. Case studies
Three case studies have been selected for different region of Italy:
1. The Soverato flood - September 9 -10, 2000 (Figures 1 and 3). Soverato torrent drains an area of few hundreds of square kilometres and is situated in Southern Italy’s Calabria Region. Flooding occurred between the towns of Soverato and Montepaone after a prolonged and intense precipitation event, causing landslides, great disruption and losses of life. Rainfall peaks above 300 mm in 24 hours was recorded close to the village of Soverato (Montani et Al., 2003).
2. The Val Canale flood - August, 29 2003 (Figures 2 and 4). A flash flood occurred in the Valcanale valley in the Friuli Region in the North East of Italy causing
Fig. 4. CHYM alarm map for the Val Canale event, alarm index is
calculated from 28 August 2003, h: 00 until 30 August 2003, h: 00.
2. The Val Canale flood – 29 August 2003 (Figs. 2 and 4). A flash flood occurred in the Valcanale valley in the Friuli Region in the North East of Italy causing many damages to buildings and loss of three people. More than 400 mm of precipitation in 24 h were recorded in the villages of Grauzaria di Moggio and Pontebba.
62 B. Tomassetti et al.: Grid based hydrological model and MM5 meteorological model Plinius Conf. 2004 – Mediterranean Sea
3 and is slightly smoothed for the other cells; the smoothing
is established according to the average height of surrounding cells. The algorithm is iterated until the flow direction is established for each grid point. Despite the final goal is the real time flood forecasting on the simulated domain, a first operational version of the model allows to obtain a sort of flood alarm index using only the flow scheme and rainfall estimation. The alarm index is discussed in the next session
4. The Flood Alarm Index
An alarm index is estimated for each cell of CHYM hydrological model as the ratio of total drained rain in the last 48 hours and total drain surface, this correspond to the average rainfall in the upstream basin of each cell. Both the drained rain and drained surface are calculated iterating the following step:
1) from each cell a "stone" rolls down to the sea following the flow direction map calculated from the DEM
2) each time a stone pass by a cell a counter is incremented for that cell
These steps are iterated until all the "stones" have reached the sea. At the end of the iteration we have a matrix containing the total number of cells drained by each grid point and this matrix can be used for many purpose, for example to distinguish cells where runoff occur overland from cells where runoff occur along channel. In addition the algorithm can be generalized to estimate different quantities: for example if the area of the starting cell is associated to the "stones" we can estimate the total area drained by each cell, while if the rainfall in the starting cell is associated to the "stones" we can estimate the total drained rain.
Figura 4: CHYM alarm map for the Val Canale event, alarm index is calculated from August 28, 2003 h: 00 until August 30 , 2003 : 00.
The choice of 48 hours as time interval is justified both by empirical observations discussed in the next section and by the fact that this corresponds to a typical runoff time for the river basins simulated in this work, namely a sort of typical time interval that a rain drop would take to arrive at the mouth of the river; we also notice how the total drained area is proportional, as a first approximation, to the river cross section (see as an example Borah et Al., 2002) and then the proposed flood alarm index is a sort measure of river stress.
What is more important for operational activities and for actual use of the model for flood alert mapping is that the proposed alarm index seems to be suitable to highlight the section of the drainage network that was actually interested by flood events at least for all the case-studies reported in this study and discussed in the next session. An example of alarm mapping for one of the case studies is shown in Fig. 3.
Figure 5: MM5 simulation for January 24-26 2003: two-day accumulated precipitation(cm).. The river beds Trigno and Sangro are highlighted.
5. Case studies
Three case studies have been selected for different region of Italy:
1. The Soverato flood - September 9 -10, 2000 (Figures 1 and 3). Soverato torrent drains an area of few hundreds of square kilometres and is situated in Southern Italy’s Calabria Region. Flooding occurred between the towns of Soverato and Montepaone after a prolonged and intense precipitation event, causing landslides, great disruption and losses of life. Rainfall peaks above 300 mm in 24 hours was recorded close to the village of Soverato (Montani et Al., 2003).
2. The Val Canale flood - August, 29 2003 (Figures 2 and 4). A flash flood occurred in the Valcanale valley in the Friuli Region in the North East of Italy causing
Fig. 5. MM5 simulation for 24–26 January 2003: two-day
accu-mulated precipitation (cm). The river beds Trigno and Sangro are highlighted.
Plinius Conf. 2004 – Mediterranean Sea
4 many damages to buildings and loss of three people.
More than 400 mm of precipitation in 24 hours were recorded in the villages of Grauzaria di Moggio and Pontebba.
3. The Sangro river flood 24-25 January 2003 (Figures 5 and 6). In this case a typical winter frontal system produced an intense precipitation that lasted for about 30 hours; many relatively large floods have been observed in the zone close to Maiella Mountains. The Sangro River has a drainage area of about 2000 square kilometres and is located in the Central East part of Italy in Abruzzo Region, the flood occurred in the higher part, about 40 kilometres from the spring causing damages to many buildings and a bridge. For all the case studies a run with MM5 mesoscale meteorological model has been carried out and the model has been forced with ECMWF analyses and forecast, the configuration of the model is similar to the operative version (Paolucci et Al., 1999). The innermost domain of simulation, running with a 3 Km of spatial resolution has been set in the zone where major severe events occur. Fig 1 and 4 shows the accumulated rain field as predicted by the model for case studies 1 and 3.
In fig 5 the field of accumulated precipitation in northern eastern Italy for 48 hours is reported. During the precipitation event a maximum of 300-400 mm of rain has been registered in 10 hours.
Figure 6: CHYM alarm map for the Sangr event, alarm index is calculated from January 23, 2002 h: 18 until January 25, 2002 h: 18.
In the Figures 3, 4 and 6 the alarm map calculated by CHYM model is reported and in all the cases the alarm index seems to well localize the segments of drainage network where more critical events actually occurred. In particular comparing maps 1 and 3 it can be seen how the
zone where flood event occurred is not the same of the maximum in the accumulated precipitation as we expect because of the complex geomorphology of the domain. All the alarm map has been computed using a 48 hours time interval for the reason explained in section 4, but also because this interval seems the more suitable to highlight the more stressed segments of drainage network. It is useful to remind that CHYM model rebuilt the rainfall field on the simulated domain at hourly base using observed and simulated precipitation data, therefore for operational purpose an effective alarm mapping could be obtained using the observed rainfall data in the last 24 hours and the first 24 hours of the forecast leading to the possibility to have flood warning about one day before the event.
In the Fig. 7 the alarm index is plotted along the river bed of Sangro river and the two area with major flood risk can easily be seen.
Figure 7:
The Alarm Index along the bed of Sangro river (0 of x axis
corresponds to the spring) that has been interested by the flood in the region close to the spring.
6. Summary and future developments
A grid based distributed hydrological model has been coupled with a mesoscale model for flood alarm index computation. Simulations have been carried out for three different case studies occurring in different zones of north, central and south Italy.
In all the simulated case studies the segments of the drainage network where the flooding events have actually been observed are correctly located by CHYM flood alert tool.
In all the domains of northern, central and southern Italy a critical threshold of 150-200 mm of alarm index has been found to perform correctly.
Although these are only preliminary results they are encouraging to actually use this approach for operational
Fig. 6. CHYM alarm map for the Sangro event, alarm index is
calculated from 23 January 2002, h: 18 until 25 January 2002, h: 18.
3. The Sangro river flood – 24–25 January 2003 (Figs. 5 and 6). In this case a typical winter frontal system produced an intense precipitation that lasted for about 30 h; many relatively large floods have been observed in the zone close to Maiella Mountains. The Sangro River has a drainage area of about 2000 square kilome-tres and is located in the Central East part of Italy in
Plinius Conf. 2004 – Mediterranean Sea
4
many damages to buildings and loss of three people.
More than 400 mm of precipitation in 24 hours were
recorded in the villages of Grauzaria di Moggio and
Pontebba.
3. The Sangro river flood 24-25 January 2003 (Figures 5
and 6). In this case a typical winter frontal system
produced an intense precipitation that lasted for about
30 hours; many relatively large floods have been
observed in the zone close to Maiella Mountains. The
Sangro River has a drainage area of about 2000 square
kilometres and is located in the Central East part of
Italy in Abruzzo Region, the flood occurred in the
higher part, about 40 kilometres from the spring
causing damages to many buildings and a bridge.
For all the case studies a run with MM5 mesoscale
meteorological model has been carried out and the model
has been forced with ECMWF analyses and forecast, the
configuration of the model is similar to the operative
version (Paolucci et Al., 1999). The innermost domain of
simulation, running with a 3 Km of spatial resolution has
been set in the zone where major severe events occur. Fig 1
and 4 shows the accumulated rain field as predicted by the
model for case studies 1 and 3.
In fig 5 the field of accumulated precipitation in northern
eastern Italy for 48 hours is reported. During the
precipitation event a maximum of 300-400 mm of rain has
been registered in 10 hours.
Figure 6:
CHYM alarm map for the Sangr event, alarm index is calculated from January 23, 2002 h: 18 until January 25, 2002 h: 18.In the Figures 3, 4 and 6 the alarm map calculated by
CHYM model is reported and in all the cases the alarm
index seems to well localize the segments of drainage
network where more critical events actually occurred. In
particular comparing maps 1 and 3 it can be seen how the
zone where flood event occurred is not the same of the
maximum in the accumulated precipitation as we expect
because of the complex geomorphology of the domain. All
the alarm map has been computed using a 48 hours time
interval for the reason explained in section 4, but also
because this interval seems the more suitable to highlight
the more stressed segments of drainage network. It is useful
to remind that CHYM model rebuilt the rainfall field on the
simulated domain at hourly base using observed and
simulated precipitation data, therefore for operational
purpose an effective alarm mapping could be obtained
using the observed rainfall data in the last 24 hours and the
first 24 hours of the forecast leading to the possibility to
have flood warning about one day before the event.
In the Fig. 7 the alarm index is plotted along the river bed
of Sangro river and the two area with major flood risk can
easily be seen.
Figure 7:
The Alarm Index along the bed of Sangro river (0 of x axis corresponds to the spring) that has been interested by the flood in the region close to the spring.6. Summary and future developments
A grid based distributed hydrological model has been
coupled with a mesoscale model for flood alarm index
computation. Simulations have been carried out for three
different case studies occurring in different zones of north,
central and south Italy.
In all the simulated case studies the segments of the
drainage network where the flooding events have actually
been observed are correctly located by CHYM flood alert
tool.
In all the domains of northern, central and southern Italy a
critical threshold of 150-200 mm of alarm index has been
found to perform correctly.
Although these are only preliminary results they are
encouraging to actually use this approach for operational
Fig. 7. The Alarm Index along the bed of Sangro river (0 of x-axis
corresponds to the spring) that has been interested by the flood in the region close to the spring.
Abruzzo Region, the flood occurred in the higher part, about 40 km from the spring causing damages to many buildings and a bridge.
For all the case studies a run with MM5 mesoscale me-teorological model has been carried out and the model has been forced with ECMWF analyses and forecast, the con-figuration of the model is similar to the operative version (Paolucci et Al., 1999). The innermost domain of simula-tion, running with a 3 km of spatial resolution has been set in the zone where major severe events occur. Figures 1 and 4 show the accumulated rain field as predicted by the model for case studies 1 and 3.
In Fig. 5 the field of accumulated precipitation in northern eastern Italy for 48 h is reported. During the precipitation event a maximum of 300–400 mm of rain has been registered in 10 h.
In the Figs. 3, 4 and 6 the alarm map calculated by CHYM model is reported and in all the cases the alarm index seems to well localize the segments of drainage network where more critical events actually occurred. In particular compar-ing maps 1 and 3 it can be seen how the zone where flood event occurred is not the same of the maximum in the accu-mulated precipitation as we expect because of the complex geomorphology of the domain. All the alarm map has been computed using a 48 h time interval for the reason explained in Sect. 4, but also because this interval seems the more suit-able to highlight the more stressed segments of drainage net-work. It is useful to remind that CHYM model rebuilt the rainfall field on the simulated domain at hourly base using
erational purpose an effective alarm mapping could be ob-tained using the observed rainfall data in the last 24 h and the first 24 h of the forecast leading to the possibility to have flood warning about one day before the event.
In the Fig. 7 the alarm index is plotted along the river bed of Sangro river and the two area with major flood risk can easily be seen.
6 Summary and future developments
A grid based distributed hydrological model has been cou-pled with a mesoscale model for flood alarm index compu-tation. Simulations have been carried out for three different case studies occurring in different zones of north, central and south Italy.
In all the simulated case studies the segments of the drainage network where the flooding events have actually been observed are correctly located by CHYM flood alert tool.
In all the domains of northern, central and southern Italy a critical threshold of 150–200 mm of alarm index has been found to perform correctly.
Although these are only preliminary results they are encouraging to actually use this approach for op-erational activity. A first application for flood alert mapping daily updated is now available at URL: http://cetemps.aquila.infn.it/chymop.
Edited by: L. Ferraris
Reviewed by: anonymous referees
References
Borah, D. K., Xia, R., Bera, M.: DWSM – A Dynamic shed Simulation Model, Mathematical Model for Small Water-shed Hydrology, WRP Edition, 2002.
Coppola, E., Verdecchia, M., Tomassetti, B., and Visconti, G.: CHYM: A Grid based Hydrological Model, Proceedings of Inter-national Symposium on Remote Sensing of Environment, Hon-olulu, Hawaii, November 2003.
tershed simulation model, Mathematical Model for Small Water-shed Hydrology, WRP Edition, 2002.
Easterling, D. R., Evans, J. L., Groismann, P. Ya., Karl., T. R., Kunkel, K. E., and Ambenje, P.: Observed Variability and Trends in Extreme Climate Events: a Brief, Review Bullettin of Am. Met. Soc., 81, 3, 417–425, March 2000.
Dudhia J.: A nonhydrostatic version of the Pen State/NCAR mesoscale moldel: validation test and simulation of an Atlantic Cyclon and cold front, Mon. Wea. Rev., 121, 493–513, 1993. Grell G. A., Dudhia, J., and Stauffer, D. R.: A description of the fifth
generation of the Pen State/NCAR mesoscale model (MM5), NCAR Technical Note, NCAR/TN-398+STR, 121pp, 1994. Kain, J. S. and Fritsch, J. M.: A one-dimensional
entrain-ing/detraining plume model and its applicationin convective pa-rameterization, J. Atmos. Sci., 47, 2784–2802, 1990.
Meehl, G. A., Zwiers, F., Evans, J., Knutson, T., Mearns, L., and Whetton, P.: Trends in Extreme Wheater and Climate Events: Issues related to Modeling Extremes in Projection of Future Cli-mate Change, Bullettin of Am. Met. Soc., 81, 3, 427–436, March 2000.
Montani, A., Marsigli, C., Nerozzi, F., Paccagnella, T., Ribaldi, S., and Buizza, R.: The Noverato Flood in Southern Italy: Perfor-mance of Global and Limited Area Ensemble Forecasts, Nonlin. Proc. Geophys., 10, 261–274, 2003,
SRef-ID: 1607-7946/npg/2003-10-261.
Paolucci, T., Bernardini, L., Ferretti, R., and Visconti, G.: MM5 Real-Time Forecast of a Catastrophic Event on May, 5 1998, Il Nuovo Cimento, 12, 727–736, 1999.
Tomassetti, B., Coppola, E., Cimini, D., Verdecchia, M., Marzano, F. S., and Visconti, G.: Assimilating satellite rainfall estimation into hydrological model for flooding alert mapping, Actif Work-shop 1: Combination of data from remote sensing technologies for flood forecasting, 24–25 November 2003, Bologna, 2003. Todini, E. and Ciarrapica, L.: The TOPKAPI Model, Mathematical
Model for Large Watershed Hydrology, WRP Edition, 2002. Troen, I. and Mahrt, L.: A simple model of the atmospheric
bound-ary layer: Sensivity to surface evaporation, Boundbound-ary Layer Me-teorology, 37, 129–148, 1986.
Wilby, R. L. and Wigley, T. M. L.: Downscaling General Circula-tion Model Output: a Review of Methods and LimitaCircula-tion, Prog. Phys. Geo., 21, 530–548, 1997.