HAL Id: hal-00304701
https://hal.archives-ouvertes.fr/hal-00304701
Submitted on 1 Jan 2002HAL is a multi-disciplinary open access archive for the deposit and dissemination of sci-entific research documents, whether they are pub-lished or not. The documents may come from teaching and research institutions in France or abroad, or from public or private research centers.
L’archive ouverte pluridisciplinaire HAL, est destinée au dépôt et à la diffusion de documents scientifiques de niveau recherche, publiés ou non, émanant des établissements d’enseignement et de recherche français ou étrangers, des laboratoires publics ou privés.
soils at Plynlimon, mid-Wales: implications for
modelling inorganic nitrogen and phosphorus in upland
UK environments
C. Neal
To cite this version:
C. Neal. Nutrient concentrations and fluxes for podzolic and gley soils at Plynlimon, mid-Wales: implications for modelling inorganic nitrogen and phosphorus in upland UK environments. Hydrology and Earth System Sciences Discussions, European Geosciences Union, 2002, 6 (3), pp.403-420. �hal-00304701�
Nutrient concentrations and fluxes for podzolic and gley soils at
Plynlimon, mid-Wales: implications for modelling inorganic
nitrogen and phosphorus in upland UK environments
Colin Neal
Centre for Ecology and Hydrology, Crowmarsh Gifford, Wallingford, OX10 8BB, UK Email: [email protected]
Abstract
The effect of felling on stream nitrate, ammonium and soluble reactive phosphate (SRP) concentrations is examined for acidic and acid sensitive Sitka Spruce afforested catchments with podzolic and gley soils in mid-Wales. For the streams draining the felled podzolic areas, the concentrations of nitrate can be up to an order of magnitude higher than pre-fell values and post-fell concentrations can even be lower than the pre-fell values. Felling for the podzolic soils barely leads to any changes in ammonium or SRP concentration. For the gley soils, felling results in an order of magnitude increase in nitrate, ammonium and SRP for a small drainage ditch, but the pulse is much reduced before it reaches the main Nant Tanllwyth channel. Rather, within-catchment and within-stream processes not only imbibe nitrate, ammonium and SRP fluxes generated, but in the case of nitrate, concentrations with- and post-felling are lower than pre-felling concentrations. The flux changes involved are described in terms of (a) input-output relationships and (b) “felling disruption” and “felling recovery responses”. The findings are linked to issues of hydrobiological controls and forestry management.
Keywords: Plynlimon, Hafren, Hore, streams, nitrate, ammonium, SRP, phosphorus, soluble reactive phosphorus, phosphate, orthophosphate,
Sitka spruce, forestry, felling, podzol, gley
Introduction
Plantation forestry has been a major feature of upland agricultural development over the last 30 or more years. The developments started between and after the two World wars in response to the strategic requirements for homegrown timber. Many of the afforested areas are now reaching maturity. Because of this, there are now issues of nutrient releases with felling affecting water resources by reducing the potability and increasing treatment costs by increasing nutrient levels and promoting eutrophication (Hudson et al., 1997a). There are also issues of surface water acidification (Neal et al., 1998a,b).
In this paper, new information is presented on how conifer harvesting affects the two major nutrients of concern, nitrogen and phosphorus. This is of strategic management concern in relation to forestry policy and practice in the UK uplands. The presentation is based on detailed studies of the Plynlimon catchments in mid-Wales. It brings together aspects of various studies on the hydrobiogeochemical
functioning of the Plynlimon catchment (e.g. Neal et al., 1997, 2001, 2002) together with new information on nutrient chemistry to provide a clearer “picture” of nutrient water quality functioning of the catchments. The presentation is made to address important management concerns for the uplands and it has been stimulated by a new initiative for describing nitrogen runoff from catchments across Europe (Wade and Whitehead, 2002) reported on in this Special Issue of HESS. The volume deals with the application of a modelling initiative based on a semi distributed Integrated Nitrogen model for multiple source assessment in Catchments (INCA; Whitehead et al., 1998a,b; Wade et al., 2002). The paper flags that nitrogen dynamics studies in UK upland areas cannot be undertaken in isolation from the behaviour of phosphorus. Indeed, it is argued that in publishing information on nitrogen dynamics in catchments, comments on phosphorus levels and nitrogen to phosphorus ratios (c.f. Jarvie et al., 1998) are needed to provide
information on the presence or absence of nutrient limitation. The paper is presented to
1. Provide background material, which relates to INCA modelling on the Plynlimon catchments (Hill, 2000). 2. Show the extent and duration of nitrogen and
phosphorus releases to streams with deforestation, an important prerequisite for studying the impact of upland rotation forestry on stream water quality, potability and ecological health.
3. Show that there may be issues of phosphate limitation that control, in part, the stream and within-catchment nitrogen dynamics, particularly in relation to deforestation. This has important implications to modelling studies of nitrogen as well as phosphorus. 4. To stimulate the coupling of the nitrogen and
phosphorus routines within an INCA and associated phosphorus modelling frameworks such as those being developed by Wade et al. (2001a,b).
Study area
The data described in this paper relate to wide ranging studies at the Centre for Ecology and Hydrology catchment research sites at Plynlimon in mid-Wales (Neal, 1997a, b). The streams form the headwaters of the upper River Severn and the area splits into two main tributaries, the Afon Hafren and the Afon Hore, and a smaller tributary, the Nant Tanllwyth. The streams drain a hill top plateau region dominated by acid moorland in the upper portion of the catchment (Plumlumon Fawr) and the Hafren Forest. Deep peat deposits are also important in the moorland plateau area. The Hafren Forest comprises mainly Sitka spruce (Picea sitchensis) with some Norway spruce (Picea abies), larch (Larix spp) and lodgepole pine (Pinus contorta) planted in various phases from the mid-1940s through to the late 1960s. A variety of harvesting techniques has been used, but, in most areas, only the tree stem has been removed from site leaving the felling debris (stumps, branches and needles) behind. Across the area, the bedrock comprises fractured Lower Palaeozoic mudstones, shales and grits. Catchment areas for these sites vary from about 50 to 300 ha. The moorland and forest catchments represent a mixture of upland acid soil types dominated by peaty podzols with subsidiary peaty gleys. The hydrology, biology and water quality of these sites, and the Plynlimon research have been described earlier (Neal, 1997a,b) and sample locations plus descriptions of the various types of monitoring sites are provided in Neal and Kirchner (2000). The salient features of the monitoring sites are as follows.
Atmospheric inputs. These were determined by the measurement of rainfall and mist. Rainfall was collected weekly from open gauges at the top and bottom of the Hafren/Hore catchment and monitoring began in March 1983. Mist was collected using a passive lidded “harp type” system at one site near the top of the catchment on a weekly basis starting in October 1990 (Neal et al., 1997; Wilkinson
et al., 1997). Monitoring is ongoing.
The upper and lower Afon Hafren. The Afon Hafren represents the main tributary of the upper river Severn. Originally, only the lower part of the Afon Hafren was monitored and this provides one of the long-term control sites (eighteen years of weekly records). It comprises moorland drainage for the top half of the catchment combined with afforested areas in the lower half of the catchment. Soils in this area are largely podzolic. Some localised felling has taken place over many years to thin and, in some cases, harvest small areas of the crop. The upper Afon Hafren, which represents the moorland part of the catchment, has been monitored since July 1990. For both sites monitoring is continuing.
The upper and lower Afon Hore. Monitoring began in May 1983 on the lower Hore and August 1984 for the upper Hore. The upper Afon Hore comprises an upper half of the Hore catchment as a whole, and it has acidic moorland vegetation. The lower half of the Hore catchment comprised spruce plantation forest and it now comprises harvested and partially and second rotation juvenile forest. The lower Hore represents drainage from the upper Hore plus drainage from the lower half of the Hore, which was afforested about the same time as the upper Afon Hore. Originally, the lower Afon Hafren was to be used as a control for the felling of the Hore. However, there are a greater number of calcite veins in the Hore bedrock. This means that there are differences in the pH and alkalinity of the Afon Hafren and Afon Hore. Since one of the primary aims of the study was to examine the effects of forestry and timber harvesting on stream acidification, the upper Hore was established a separate control. Felling of the lower Hore took place between 1985 and 1989. Monitoring at both these sites is ongoing.
The Nant Tanllwyth. This represents a smaller catchment, 51 ha area, on the lower slopes of the upper Severn and its confluence with the main river is close to that of the junction of the Afon Hafren and Afon Hore. The area has been completely forested and the soils are mainly gleys. About half of the Tanllwyth catchment was felled in February 1996. Monitoring began in September 1991 and is ongoing.
South2Hore. This comprises a small afforested hillslope area (3 to 6 ha) that drains into the Afon Hore between the upper and lower sampling points. The study was established in April 1988. The area drains podzolic soils, and the site was harvested in August to October 1989 and monitoring is continuing.
SE1 and SE3. These are afforested sites. They comprise two small drainage areas (2 to 4 ha) towards the bottom end of the upper River Severn, just downstream of the confluence of the Afon Hafren and the Afon Hore. These sites represent fell (SE1) and control (SE3) locations with podzolic soils. Monitoring began in October-November 1994. The SE1 site was clearfelled in September to October 1995. Monitoring of the felled site is ongoing, but monitoring of the control site was discontinued in April 1999 due to lack of resources.
Tan1 and Tan2. These represent two small drainage areas (< 2 ha) within the Tanllwyth catchment. They represent fell (Tan1) and control (Tan2) locations with gley soils. Monitoring began in April 1994 and the Tan1 site was clear-felled in February 1996. Monitoring of the clear-felled site is ongoing, but monitoring of the control site was discontinued in April 1999 due to lack of resources.
Sampling and analysis
For the chemical analysis, weekly (main monitoring sites) to fortnightly (paired catchments and other sites) collections were taken. The samples were filtered in the field using 0.45 µM membranes and a wide range of chemical analyses was undertaken on return to the laboratory as outlined by Neal
et al. (1997).
In the case of nitrate, ammonium and soluble reactive phosphorus (SRP), prior to analysis, the filtered samples were stored in the dark in chromic acid washed glass bottles at 4oC. Analysis involved standard colourimetric
methodologies as described by Neal et al. (1997) with two additional comments/modifications. Firstly, the nitrate analytical methodology actually determines nitrate plus nitrite within the water. However, nitrite is unstable within the waters of concern, and, for the present purpose, the results are presented as “nitrate” rather than “nitrate plus nitrite”. Secondly, the SRP methodology is based on the method of Murphy and Riley (1962) as modified by Neal et
al. (2000). The Neal et al. (2000) modification overcomes
problems of silicate interference found within the autoanalyser technique originally used at the Wallingford laboratories. Plynlimon data for the period prior to the change in methodology has been corrected for the
interference using relationships established within the Neal
et al. (2000) study.
For the methodologies, calibration was carried out using standard stock solutions prepared from high purity (ANALAR grade) potassium nitrate (KNO3), ammonium sulphate ((NH4)2SO4) and potassium dihydrogen orthophosphate (KH2PO4), respectively. The calibration ranges are 0 to 5 mg-NO3 l–1 (0 to 80 µM-NO
3 l–1), 0 to 0.2
mg-NH4 l–1 (0 to 11 µM-NH
4 l–1) and 0 to 1.5 mg-PO4 l–1 (0
to 15.8 µM l–1). Calibration was undertaken at the start of
each batch of analysis and intermediate and check standards were incorporated every five samples within each batch. Analysis was performed in duplicate and average concentrations were calculated. The samples were re-analysed if they did not replicate within one division of a full scale of 100 units (i.e. ± 0.4 µM-NO3 l–1, ± 0.06
µM-NH4 l–1 and ± 0.08 µM-SRP l–1).
Stream SRP concentrations are often extremely low. Indeed, the average concentrations for many of the streams correspond to a response of less than a half a percent of full-scale deflection and less than the lowest quotable value of 0.2 µM l–1. The “raw data” has been used to calculate
averages and ranges to avoid the problem of having to deal with less than values. This is reasonable as (a) large numbers of samples are taken to provide the average and (b) much higher concentrations are found in most streams draining other parts of the UK (i.e. a percentage error in the estimate associated with rounding terms is not important). However, the reader needs to bear in mind that low SRP values are involved and that for such SRP depleted systems much more accurate methodologies are required for in depth studies of SRP dynamics.
Early in the study, anomalously high ammonium and SRP values were observed in the streams for a two to three month period. These have been discounted from the analysis presented below, as are other occasional outliers: there are no clear reasons why there are these outlier points.
Hydrological information on stream-flow was collected to assess the influence of hydrology on nitrate, ammonium and SRP concentrations and to calculate fluxes. Hydrological data for the Plynlimon hydrological network, maintained by the catchment section of the Institute of Hydrology, Wallingford (Hudson et al., 1997a, b), was used to assess instantaneous stream flow at the time of sampling. Four major flumes within the catchment were used for this purpose. These are located at four of the stream monitoring sites — the upper and lower Afon Hore, the lower Afon Hafren and the Nant Tanllwyth. Flows are expressed on an aerial basis in units of mm/15 mins. For the smaller sites, no flow measurement was directly available. Flows for the nearest gauge were used for these sites to obtain
flow-weighted concentrations and fluxes. In this case, while absolute flows will differ from site to site according to the area of each catchment, it is reasonable to assume that the aerial-weighted flows will be very similar across the sites given the closeness of the sites and the relatively uniform rainfall coverage (Hudson et al., 1997b).
Results
The results are presented below in a progressive way to describe:
z General features related to average and ranges in
concentration across the catchments.
z Specific features related to time series patterns for (a)
moorland and forested catchments and (b) felled catchments.
z Fluxes.
GENERAL FEATURES
The average concentrations, flow-weighted average concentrations and ranges in concentration for nitrate, ammonium and SRP are provided in Table 1. Within this table, the data have been subdivided for the felled catchments into periods prior to, at the time of felling and for the subsequent two years to show the immediate felling response and the period after this that covers the post-felling response. SRP concentrations are often close to or below the detection limit. When this is the case, the separation between pre-felling, felling and post-felling responses have not been undertaken in this introductory section as a much more detailed analysis of the data is required to tease out the small changes occurring. However, comments are made later in the paper in relation to cumulative flux and cumulative flux difference methodologies. The salient features are as follows.
Atmospheric inputs
The concentrations of nitrate, ammonium and SRP in rainfall and mist show a large range: the respective ranges are 0– 207, 0–283 and 0–19 µM l–1 for rainfall. For mist, the
corresponding ranges are 7–3307, 1–3000 and 0–21 µM l–1. The concentrations of nitrate, ammonium and SRP are
particularly high in mist. The average concentrations are 326, 286 and 0.9 µM l–1, respectively, in mist compared
with 23, 27 and 0.33 µM l–1 in rainfall. The highest
concentrations occur at low volume of catch for both rainfall and mist and this probably occurs in response to scavenging of particulate components: higher volumes of catch dilute
the particulate component. This is shown by (a) plotting the data against flow and (b) subdividing the data into low and high volumes of catch and plotting these volumes over time (c.f. Neal et al., 2001). The concentrations and their range are similar for nitrate and ammonium but two orders of magnitude lower for SRP in rainfall. This feature is also observed for mist.
Nitrate
The average concentrations of nitrate in the streams are similar to those in rainfall (15 to 40 µM l–1 compared to
23µM l–1) with the exception of the felled sites where
average concentrations are often higher during the initial felling response (40 to 184 µM l–1). The streams show only
half the range in nitrate concentration relative to rainfall although the two ranges approach each other when felling periods are also included. The average nitrate concentrations for the streams draining moorland and forested catchments are similar to each other, but felling disturbance over doubles nitrate concentrations for the lower Afon Hore, SE1 Tan1f and south2Hore (a factor of 2.0, 4.6, 5.5 and 3.0, respectively, relative to concentrations prior to felling). For these sites, subsequent to the initial felling disturbance, average nitrate concentrations return towards pre-felling levels. However, felling does not always lead to a clear response for nitrate. In one case, the Nant Tanllwyth, there is barely any increase in nitrate concentration associated with felling and concentrations post-felling are about a half those pre-felling and during felling.
Ammonium
The average concentrations of ammonium in the streams draining moorland and forested catchments are typically 25 times lower than in the rainfall (0.7 to 1.5 compared to 27 µM l–1). With felling, concentrations can be higher than
pre-fell and other forested catchment counterparts but the response is variable (average concentrations vary between 1.1 and 7.4 µM l–1). For example, the increase in ammonium
concentrations on felling compared to pre-felling concentrations is 15, 86, 29, 640 and 10% for the lower Afon Hore, the Nant Tanllwyth, SE1f, Tan1f and south2Hore, respectively. Thus, on a relative basis, the lower Afon Hore, SE1f and south2Hore show small gains, the Nant Tanllwyth shows a moderate gain and Tan1f shows a large gain. However, it must be borne in mind that the ammonium concentrations show a very “spiky” character with occasional high values. Only in the Tan1f site, with its clear-felling response, can the increases with clear-felling be judged to a good degree of reliability. Subsequent to the initial felling
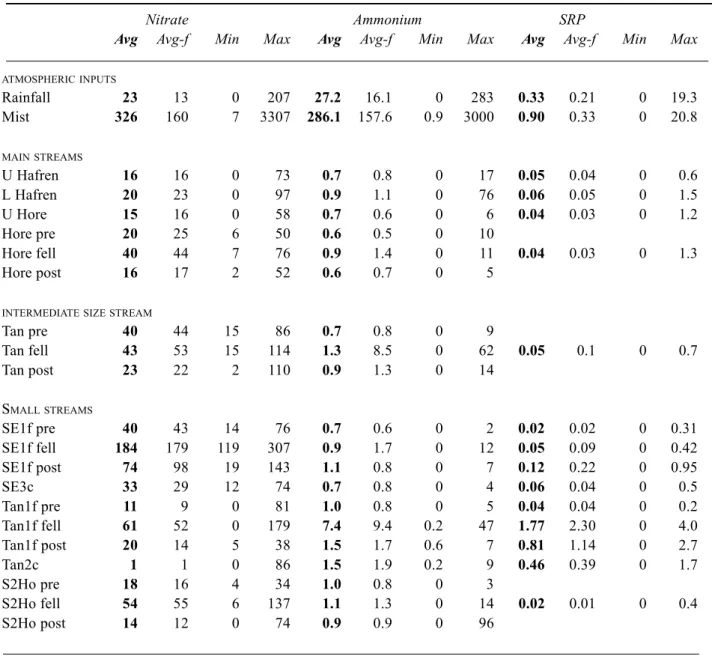
Table 1. Average, minimum and maximum concentrations of nitrate, ammonium and SRP in rainfall, mist and stream
waters in the Plynlimon area. All units are µM l-1 and “-f” denotes a flow weighting.
Nitrate Ammonium SRP
Avg Avg-f Min Max Avg Avg-f Min Max Avg Avg-f Min Max
ATMOSPHERICINPUTS Rainfall 23 13 0 207 27.2 16.1 0 283 0.33 0.21 0 19.3 Mist 326 160 7 3307 286.1 157.6 0.9 3000 0.90 0.33 0 20.8 MAINSTREAMS U Hafren 16 16 0 73 0.7 0.8 0 17 0.05 0.04 0 0.6 L Hafren 20 23 0 97 0.9 1.1 0 76 0.06 0.05 0 1.5 U Hore 15 16 0 58 0.7 0.6 0 6 0.04 0.03 0 1.2 Hore pre 20 25 6 50 0.6 0.5 0 10 Hore fell 40 44 7 76 0.9 1.4 0 11 0.04 0.03 0 1.3 Hore post 16 17 2 52 0.6 0.7 0 5
INTERMEDIATESIZESTREAM
Tan pre 40 44 15 86 0.7 0.8 0 9 Tan fell 43 53 15 114 1.3 8.5 0 62 0.05 0.1 0 0.7 Tan post 23 22 2 110 0.9 1.3 0 14 SMALLSTREAMS SE1f pre 40 43 14 76 0.7 0.6 0 2 0.02 0.02 0 0.31 SE1f fell 184 179 119 307 0.9 1.7 0 12 0.05 0.09 0 0.42 SE1f post 74 98 19 143 1.1 0.8 0 7 0.12 0.22 0 0.95 SE3c 33 29 12 74 0.7 0.8 0 4 0.06 0.04 0 0.5 Tan1f pre 11 9 0 81 1.0 0.8 0 5 0.04 0.04 0 0.2 Tan1f fell 61 52 0 179 7.4 9.4 0.2 47 1.77 2.30 0 4.0 Tan1f post 20 14 5 38 1.5 1.7 0.6 7 0.81 1.14 0 2.7 Tan2c 1 1 0 86 1.5 1.9 0.2 9 0.46 0.39 0 1.7 S2Ho pre 18 16 4 34 1.0 0.8 0 3 S2Ho fell 54 55 6 137 1.1 1.3 0 14 0.02 0.01 0 0.4 S2Ho post 14 12 0 74 0.9 0.9 0 96
disturbance, average ammonium concentrations return towards pre-felling levels. Irrespective of the felling response, all the streams are depleted in ammonium relative to the rainfall (typically by over 90% in terms of average concentration differences). Further, the ranges in ammonium concentration in the streams, with or without felling disturbance are much lower than in rainfall (0 to 96 µM l–1
and 0 to 283 µM l–1, respectively).
SRP
For the streams that are not subjected to forest harvesting
disturbance, average concentrations are around 0.04 µM l–1 (range 0.02 to 0.06 µM l–1) with a higher average for one
of the gley sites, Tan2c (0.46 µM l–1). Thus, with the
exception of this one gley site, the undisturbed catchments show depletion in SRP for the streams relative to the rainfall (typically about 90%). With felling, there is a variable SRP response and only in one or two cases is there any clearly marked change. The main exception is the Tan1f site on gley where SRP concentrations increase substantially with felling (from 0.04 to 1.77 µM l–1) before returning towards
pre-felling levels, subsequent to the initial felling response (0.81 µM l–1). For two of the gley sites, Tan2c and Tan1f, at
the time of and post-felling, average concentrations in the streams are higher than in the rainfall.
Nutrient ratios
Nutrient ratios are presented in Table 2 to show (a) what fraction of the inorganic nitrogen is ammonium (also, by difference from 100%, nitrate) and (b) the nitrogen to phosphorus ratio in order to provide an indication of the extent of nutrient limitation. The salient features are as follows.
The percentage ammonium making up inorganic nitrogen
For precipitation, there is an approximate balance between ammonium and nitrate making up the inorganic nitrogen fractions in rainfall and mist. However, in the main streams nitrate dominates (greater than 95%) as much of the ammonium input is taken up by the catchment. Most of the smaller streams have similar values with ammonium making up less than 10% of the inorganic nitrogen fraction, but higher proportions are observed within the gley drainage areas with or without felling. The highest proportion of ammonium in the streams occurs for one of the small
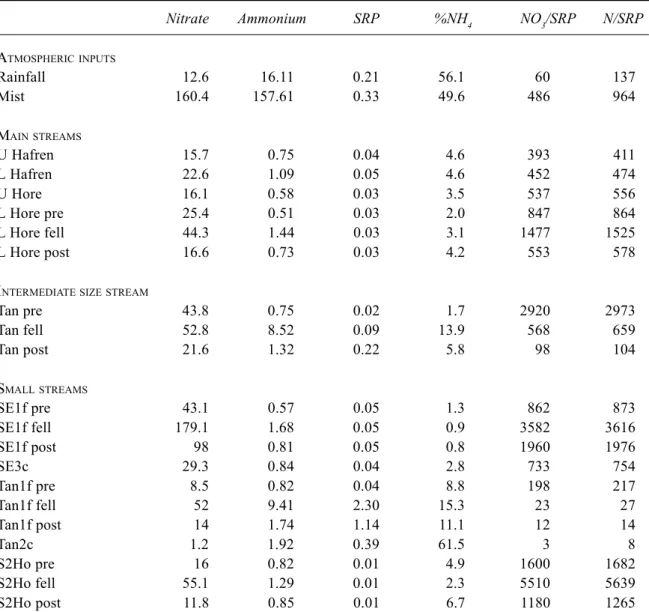
Table 2. Information on the proportion of ammonium in the inorganic nitrogen fraction and the
nitrate/inorganic-nitrogen to SRP ratio in rainfall, mist and stream waters at Plynlimon. All units are ìM l-1 or ratios of these
units. The data all relate to flow weighted averages. %NH4 = 100*NH4/(NH4 + NO3) and N/SRP = (NH4 + NO3)/SRP. Nitrate Ammonium SRP %NH4 NO3/SRP N/SRP ATMOSPHERICINPUTS Rainfall 12.6 16.11 0.21 56.1 60 137 Mist 160.4 157.61 0.33 49.6 486 964 MAINSTREAMS U Hafren 15.7 0.75 0.04 4.6 393 411 L Hafren 22.6 1.09 0.05 4.6 452 474 U Hore 16.1 0.58 0.03 3.5 537 556 L Hore pre 25.4 0.51 0.03 2.0 847 864 L Hore fell 44.3 1.44 0.03 3.1 1477 1525 L Hore post 16.6 0.73 0.03 4.2 553 578
INTERMEDIATESIZESTREAM
Tan pre 43.8 0.75 0.02 1.7 2920 2973 Tan fell 52.8 8.52 0.09 13.9 568 659 Tan post 21.6 1.32 0.22 5.8 98 104 SMALLSTREAMS SE1f pre 43.1 0.57 0.05 1.3 862 873 SE1f fell 179.1 1.68 0.05 0.9 3582 3616 SE1f post 98 0.81 0.05 0.8 1960 1976 SE3c 29.3 0.84 0.04 2.8 733 754 Tan1f pre 8.5 0.82 0.04 8.8 198 217 Tan1f fell 52 9.41 2.30 15.3 23 27 Tan1f post 14 1.74 1.14 11.1 12 14 Tan2c 1.2 1.92 0.39 61.5 3 8 S2Ho pre 16 0.82 0.01 4.9 1600 1682 S2Ho fell 55.1 1.29 0.01 2.3 5510 5639 S2Ho post 11.8 0.85 0.01 6.7 1180 1265
drainage ditches (Tan2c – 61% ammonium) where there is a major removal of nitrate under the reducing conditions pertaining. With felling of the gley areas, there is a modest increase in the ammonium fraction of the inorganic nitrogen (about 15%).
Inorganic nitrogen to SRP ratios
The ratios of both the nitrate to SRP (NO3/SRP) and the total inorganic nitrogen to SRP (TIN/SRP) are very high in most of the streams with values typically greater than 100 and sometimes in excess of 1000 (on a µM l–1: µM l–1 basis).
This corresponds to extreme phosphorus limitation (c.f. Jarvie et al., 1998). The only major exceptions are for the small drainage ditches with gley soils where the ratio is lowered considerably due in one case to nitrate reduction (Tan2c) and in another case to SRP release with felling (Tan1f) where NO3/SRP and TIN/SRP ratios are reduced to as low as 3 and 8, respectively. Such low ratios are not observed within the Nant Tanllwyth draining the gley. THE VARIATIONS IN NITRATE, AMMONIUM AND PHOSPHATE CONCENTRATION OVER TIME
Moorland and forested catchments
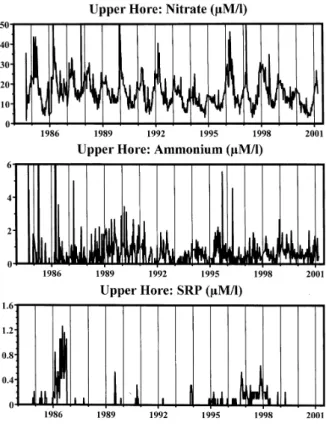
The moorland and forested catchments undisturbed by felling all show a similar pattern of behaviour over time for nitrate, ammonium and SRP. This is illustrated in Fig. 1 for the upper Afon Hore. The salient features are as follows. Nitrate
Nitrate concentrations vary in a sinusoidal manner through the year. The lowest nitrate concentrations occur during the summer months when both temperature and biological uptake within the catchment and the stream are at their highest. Despite the sinusoidal pattern, there is some marked scatter. In part, the scatter is related to hydrological conditions and the nitrate concentrations become almost constant at low to intermediate concentration values at high flows (Neal et al., 2001). However, there are also year-to year variations in nitrate concentrations with higher concentrations occurring during the early 1980s and the late 1990s when concentrations are perhaps 50% higher than at other times.
Ammonium and SRP
Ammonium and SRP concentrations are low in streams draining the moorland and forested areas although there are occasional outlier points of higher concentration (Fig. 1). There are no clear seasonal or flow related patterns of
behaviour for these two determinands.
Forested catchments subjected to harvesting
The main streams
For the two main catchments felled, the lower Afon Hore and the Nant Tanllwyth, Figs. 2 and 3 show, respectively, the responses to felling and in the plots control responses are also plotted. In the case of the lower Afon Hore, the upper Afon Hore provides an obvious control. The upper Afon Hore represents a partially forested system with similar podzolic soils and provides the flow and chemical input from the upper portion of the catchment. For the Nant Tanllwyth, there is no clear control stream at the same catchment scale and for the same gley soils. For the Nant Tanllwyth, the lower Afon Hafren has been used, as the Nant Tanllwyth is a tributary of the Afon Hafren. The Tan2c site was not used as a control since the chemistry is quite distinct from the Nant Tanllwyth - this feature will be discussed later in the paper.
The main features are described below and the reader must bear in mind that for both the lower Afon Hore and the Nant Tanllwyth only about a half of each of the catchments were felled and that a felling response would be expected to be about twice the magnitude of that described here.
Fig. 1. Time series plots of nitrate, ammonium and SRP
Fig. 2. Time series plots of nitrate, ammonium and SRP
concentrations for the upper and lower Afon Hore. The upper Afon Hore is used as a control reference for the felling of the lower Afon Hore. To distinguish the two data sets plotted, the lower Afon Hore has a darker and thicker line. “F” denotes the time of fell. In the case of the lower Afon Hore, the fell occurred over several years and this is marked by the use of an arrow and the use of “F” to mark both the start and the end of fell. Note that only half of the catchment was felled and that the response for total fell would be perhaps twice the response shown in the graph.
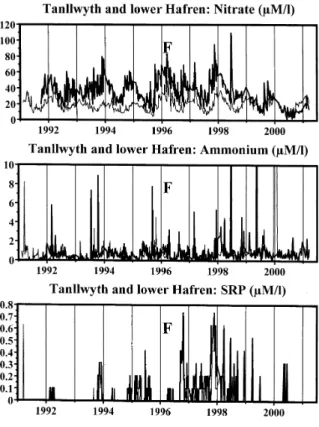
Fig. 3. Time series plots of nitrate, ammonium and SRP
concentrations for the Nant Tanllwyth and the lower Afon Hafren. The lower Afon Hafren is used as a control reference for the felling of the Nant Tanllwyth. To distinguish the two data sets plotted, the Nant Tanllwyth has a darker and thicker line. “F” denotes the time of fell. Note that only half of the catchment was felled and that the response for total fell would be perhaps twice the response shown in the graph.
For the Afon Hore, two main features are observed. 1. The upper and lower parts of the catchment show similar
nitrate time series up to the time of felling. During the felling period (1985 to 1989), the lower Afon Hore shows a marked response for nitrate, with concentrations typically doubling to trebling (from 20 to 55 µM l–1)
while the lower Afon Hore shows no significant change (Fig. 2). After the felling period, nitrate concentrations then decline over the next four years to levels very similar to those for the lower Afon Hore and for the upper and lower Afon Hore pre-fell. During 1996, concentrations increase again, as do all the Plynlimon catchments irrespective of whether or not there is felling activity. At this time, the upper and lower Afon Hore concentrations match each other at about 35 µM l–1.
From 1996, the nitrate concentrations decline over time and there is a crossover point where nitrate concentrations gradually become higher for the upper
Afon Hore compared to the lower Afon Hore. Throughout the period, the yearly oscillations in nitrate for the upper and lower Afon Hore are maintained. The amplitude of the fluctuation changes with felling and the oscillations become less well marked with much greater scatter to the data.
2. The concentrations of ammonium and SRP are similar for the upper and lower Afon Hore throughout the study period. The data shows marked scatter, but it must be borne in mind that the concentrations are low. There is no clear-felling response for ammonium and SRP. For the Nant Tanllwyth it is uncertain if there is a felling response. In the case of nitrate, a very different response is observed to that of the Afon Hore: the nitrate increase for the Afon Hore with felling is not seen for the Nant Tanllwyth. For the Nant Tanllwyth, seasonal oscillations occur as for all the sites but the nitrate concentrations are about twice as high as the lower Afon Hafren control (40 versus 20
µM l–1, on average). Thus, the Afon Hafren does not provide
a suitable control site. In 1996, nitrate concentrations increase for both streams and decline thereafter, in line with the other catchments in the area. It is in 1996 that the felling of the Nant Tanllwyth occurred, but it is not clear if there is an additional increase in nitrate concentration above that experienced for the other streams. However, subsequent to felling, the Nant Tanllwyth shows a greater decline in nitrate concentration than for the lower Afon Hafren and by 2000 the two patterns merge. Further, by 2001, nitrate concentrations in the lower Afon Hafren may even be higher than for the Nant Tanllwyth. Thus, it seems that felling of the Nant Tanllwyth catchment results in a net reduction in stream nitrate concentration. For ammonium and SRP, there may be an increase in their concentrations with felling (as illustrated with the summary of the average data presented earlier in this paper). However, the “spiky” nature of the time series makes visual assessment difficult.
Small streams and drainage ditches
Three small streams have been monitored to examine felling responses. These are South2Hore, SE1f and Tan1f and their
corresponding controls are, respectively, the upper Afon Hore, SE3c and Tan2c. Each of the streams exhibits different features relative to its control and hence the felling responses are described separately below and the data are presented in Figs. 4, 5 and 6, respectively.
For South2Hore, two types of response are observed resembling that for the lower Afon Hore.
1. There is a large response to felling for nitrate concentrations in the stream with a trebling in concentration from about 30 to 90 µM l–1. The increase
occurs in the year of felling with the first autumn storms of the year and the felling response lasts for about three and a half years. After this time, nitrate concentrations return to pre-fell levels and the time series merges with that for the lower Afon Hore. The 1996 increase in stream nitrate is observed and gradually nitrate concentrations in the upper Afon Hore start to exceed those for South2Hore.
2. The concentrations of ammonium and SRP are similar for the fell and control sites throughout the study period
Fig. 4. Time series plots of nitrate, ammonium and SRP
concentrations for South2Hore and the lower Afon Hore. The lower Afon Hore is used as a control reference for the felling of
South2Hore. To distinguish the two data sets plotted, South2Hore has a darker and thicker line. “F” denotes the time of fell. Note that all of the catchment was felled.
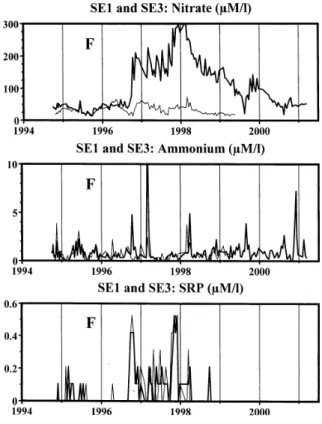
Fig. 5. Time series plots of nitrate, ammonium and SRP
concentrations for SE1f and SE3c. SE3c is used as a control reference for the felling of SE1f. To distinguish the two data sets plotted, SE1f has a darker and thicker line. “F” denotes the time of fell. Note that all of the catchment was felled.
and there is no clear-felling response. The data shows marked scatter and the concentrations are low. For SE3, the behaviour of the streams is the same as that described for South2Hore. Thus, a clear-felling response is observed for nitrate, but no significant change occurs for ammonium and SRP where concentrations remain at low levels. In the case of nitrate, the concentrations increase by a factor of about seven, from about 40 to a maximum of about 300 µM l–1 and this is higher in terms of percentage
and absolute values relative to South2Hore. Further, since the felling was relatively late in the year for SE1f, the felling response was not observed until the autumn of the next year. Subsequent to felling, nitrate concentrations start to decline towards pre-felling levels. There is an insufficiently long data run to show when or if the reductions continue in a way that matches the behaviour described earlier.
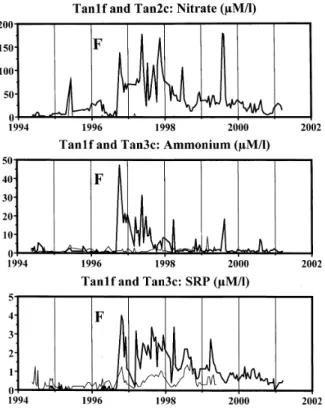
For the Tanllwyth drainage ditches (Tan1f and Tan2c), the response to felling differs from those described earlier and the features for nitrate, ammonium and SRP need to be considered separately.
z Nitrate. There is a clear difference for nitrate between
the control and the fell sites even before felling commences. For the control site (Tan2c), nitrate is almost universally very low and this presumably reflects the reducing conditions within the ditch that allows nitrate reduction. Nitrate concentrations for the felling site are around 25 µM l–1 prior to felling and these are
close to the concentrations encountered in the other control sites. Nevertheless, very low concentrations are observed for part of the period prior to felling. This feature probably reflects some reduction of nitrate. Nonetheless, there are slightly high pre-fell nitrate concentrations for Tan1f around 1996 and this corresponds to the time when nitrate concentrations increased across all the catchments in the area. Clearly, the Tan2c site is not representative of a control for Tan1f. With felling at the start of 1996, nitrate concentrations increase during the autumn storms in the same year. The felling leads to a four or more fold increase in nitrate concentration with an average increase of about 100 µM l–1. Nitrate concentrations are highest for the first
two years after felling. Nitrate concentrations then decline towards the pre-felling levels for the next four years, to present time.
z Ammonium. Ammonium shows a major increase in concentration with felling from background concentrations of less than 5 µM l–1 to up to about 46
µM l–1. This increase occurs in the same year as felling,
during the autumn storms. The felling disturbance is complete within two years of felling at which time concentrations have decreased to background levels (with the occasional spike in concentration).
z SRP. SRP concentrations increase with felling from
background, near detection levels, to around 4 µM l–1.
The highest concentrations occur with the initial felling response at the time of the ammonium response. After this initial response, SRP concentrations decline slowly over the next four years up to the present time. However, even after four years the SRP concentration has not declined to background levels with present values of around 0.5 µM l–1.
FLUXES
Presently, only approximate fluxes can be assessed due to lack of detail on the dry and mist inputs to catchments and the need for detailed statistical approaches to assessing stream-water fluxes. An approximate flux balance is determined in two respects. Firstly, the input-output flux is calculated for the undisturbed catchments using (a) the average flow weighted data for nitrate, ammonium and SRP, (b) average long term information on rainfall and stream
Fig. 6. Time series plots of nitrate, ammonium and SRP
concentrations for Tan1f and Tan2c. Tan2c is used as a control reference for the felling of Tan1f. To distinguish the two data sets plotted, Tan1f has a darker and thicker line. “F” denotes the time of fell. Note that all of the catchment was felled.
flows (Hudson et al., 1997b) and (c) average mist inputs based on the data by Wilkinson et al. (1997). Secondly, the effects of felling are examined in relation to cumulative changes in flux and direct comparison with control sites using a methodology developed in a companion paper (Neal, 2002). These aspects are considered separately below.
Input-output fluxes for moorland and undisturbed forested catchments
Table 3 provides estimates of input-output fluxes for the Plynlimon catchments. To gauge the atmospheric inputs, the rainfall concentrations were scaled according to a percentage of the rainfall flux based on information provided by Wilkinson et al. (1997). Trees scavenge more pollutants from mist than moorland vegetation and hence the proportion of mist input has been scaled by the percentage of forest cover. The percentage mist input is taken as: nitrate, 18% for moorland and 47% for forest; ammonium, 14% for moorland and 42% for forest; SRP, after correction for silica interference as described earlier, 10% for moorland and 44% for forest. The salient features are as follows.
z Nitrate. Atmospheric input fluxes vary between 5.4 and 6.8 kg-N ha–1 yr–1 depending upon the extent of forest
cover (i.e. the rainfall flux of 4.58 kg-N ha–1 yr–1 plus
an extra 18 to 47% to allow for the mist input for moorland and mixed and forested cases). The streams show a variable response with fluxes in the range 0.3 to 11.9 kg-N ha–1 yr–1 and, on average, there is an
approximate input-output balance. An input-output balance is most clearly observed for the main streams: there is either an approximate input-output balance or a small net uptake by the catchment (–36 to +5% flux gain by the stream). The smaller streams show a much more variable response. For the gley drainage ditches where nitrate reduction is most prevalent, there is a much larger uptake of nitrate by the catchment (64 to 96%) although this is not manifest at the stream outlet where there is a marked net flux output (77%). The small streams draining the podzols show a variable but net flux output (17 to 73%).
z Ammonium. Atmospheric input fluxes of ammonium
vary between 6.5 and 8.1 kg-N ha–1 yr–1 depending upon
the extent of forest cover. Ammonium input fluxes are slightly higher than that for nitrate. Stream fluxes are lower in the range 1.4 to 3.0 kg-N ha–1 yr–1 with an
outlier a gley drainage ditch at 5.1 kg-N ha–1 yr–1. This
means that, with one exception, there is a net ammonium retention of the atmospheric input by the catchment of around 59 to 80% (36% in the case of the outlier value).
As with nitrate, the uptake of ammonium in the small drainage ditch in the gley is not reflected to the same degree within the main stream.
z SRP. Atmospheric input fluxes of SRP vary between
0.19 and 0.24 kg-P ha–1 yr–1 depending upon the extent
of forest cover. These fluxes for SRP are clearly much lower than those for nitrogen (about 2%). Stream fluxes vary between 0.1 and 0.6 kg-P ha–1 yr–1 with an outlier
for one of the small gley ditches (the same as the outlier for ammonium) of 0.24 kg-P ha–1 yr–1. For all but the
outlier case, there is a major retention of the atmospheric input of SRP by the catchment of around 88% (range 76 to 97%). There is an approximate balance for the outlier point, but this pattern is not observed at the stream outlet.
The effects of felling on catchment fluxes
In order to compute flux changes with felling, cumulative flux and cumulative flux differences have been used for fell and control sites where suitable. Neal (2002) provides details of the methodology. The salient features for the different catchments are as follows.
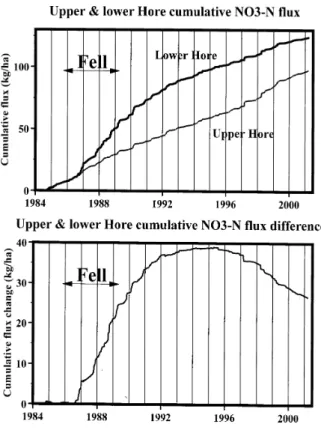
The lower Afon Hore
For the lower Hore, the upper Hore has been used as a control to characterise the “background” flux. For the lower Hore, only nitrate is considered as ammonium, SRP concentrations are low with occasional outlier points, and felling responses are not discernible from the noise. The results of this exercise for nitrate are shown in Fig. 7.
Prior to felling, the fluxes for the lower Afon Hore and the controls follow each other, but, with felling, there is an increase in flux for the felled site relative to the control. This flux difference increases to a plateau value over several years and starts to decline thereafter. The increase corresponds to about 39 kg-N ha–1 and the plateau region
extends between about 1993 and 1997. Thus, the initial felling response lasts for perhaps 4 years post-felling (i.e. 1989 when felling ceased up to 1993 when the plateau region was met. However, the greatest change occurs during the felling period (1985–89) as the gradient in the flux difference with time is also at its greatest. Post 1997, there is a closing of the gap between the felling and control flux as the catchment starts to reincorporate nitrate into the newly developing biomass.
Remembering that for the lower Hore only half of the catchment was felled, then the nitrate felling response for the forested and harvested part of the catchment will be approximately 78 kg-N ha–1.
Table 3. Input-output fluxes of nitrate, ammonium and SRP for moorland and undisturbed catchments at Plynlimon.
Fluxes and flux differences for N and P are presented as kg-N ha-1 yr-1 and kg-P ha-1 yr-1, respectively.
Flow Forest cover Conc Mist input Flux Flux change Flux gain mm yr-1 % µM l-1 % kg ha-1 yr-1 kg ha-1 yr-1 % NITRATE Rainfall 2518 13.0 4.58 U Hafren 2048 0 16.0 18 4.59 -0.82 -15 U Hore 1934 50 16.0 32 4.33 -1.74 -29 L Hafren 1934 50 23.0 33 6.23 0.16 3 L Hore 1934 77 25.0 40 6.77 0.34 5 Tanllwyth 1934 100 44.0 47 11.91 5.18 77 S2Hore 1934 100 16.0 47 4.33 -2.40 -36 SE1f 1934 100 43.0 47 11.64 4.91 73 SE3c 1934 100 29.0 47 7.85 1.12 17 Tan1f 1934 100 9.0 47 2.44 -4.30 -64 Tan2c 1934 100 1.0 47 0.27 -6.47 -96 AMMONIUM Rainfall 2518 16.1 5.68 U Hafren 2048 0 0.8 14 2.29 -4.18 -65 U Hore 1934 50 0.6 28 1.62 -5.64 -78 L Hafren 1934 50 1.1 28 2.98 -4.29 -59 L Hore 1934 77 0.5 36 1.38 -6.31 -82 Tanllwyth 1934 100 0.8 42 2.17 -5.89 -73 S2Hore 1934 100 0.8 42 2.17 -5.89 -73 SE1f 1934 100 0.6 42 1.62 -6.43 -80 SE3c 1934 100 0.8 42 2.17 -5.89 -73 Tan1f 1934 100 0.8 42 2.17 -5.89 -73 Tan2c 1934 100 1.9 42 5.14 -2.91 -36 SRP RAINFALL 2518 0.21 0.17 U Hafren 2048 0 0.04 10 0.03 -0.16 -85 U Hore 1934 50 0.03 27 0.02 -0.19 -91 L Hafren 1934 50 0.05 27 0.03 -0.19 -87 L Hore 1934 77 0.03 36 0.02 -0.21 -91 Tanllwyth 1934 100 0.10 44 0.06 -0.18 -76 S2Hore 1934 100 0.01 44 0.01 -0.24 -97 SE1f 1934 100 0.05 44 0.03 -0.21 -88 SE3c 1934 100 0.04 44 0.02 -0.22 -90 Tan1f 1934 100 0.05 44 0.03 -0.21 -87 Tan2c 1934 100 0.39 44 0.24 -0.01 -2 South2Hore
As with the lower Hore, the south2Hore is compared with the upper Hore as control and only nitrate is considered because of the low ammonium and SRP concentrations and
negligible felling disturbance effects. The results (Fig. 8) show similar features to the lower Afon Hore, but they are of shorter duration owing to the rapidity of felling (a month or two compared to several years of partial fell in the case
Fig. 7. Cumulative nitrate fluxes and flux differences for the upper
and lower Afon Hore.
Fig. 8. Cumulative nitrate fluxes and flux differences for the
South2Hore and the upper Afon Hore.
of the lower Hore). In detail, the results are as follows.
z The upper Afon Hore and South2Hore show similar
fluxes prior to felling, but a marked deviation with felling.
z There is a major flux increase over the first two years of fell up to the start of 1992. Thus, the initial felling response lasts for about three years.
z After this initial response, a plateau region is
encountered and the flux difference amounts to about 27 kg-N ha–1. The plateau region continues for six years.
z After the plateau period, there is a partial recovery response as the fell and control responses start to converge. Up to the present, the reduction in the flux difference corresponds to about 25% in three years. SE1f
SE1f has SE3c as a control. However, the control has not been monitored through the full study period and the later period has had to be in-filled using average values for the previous 12 months up to the time of the termination of the control. As with the cases described earlier, only nitrate is considered since ammonium and SRP concentrations remain low with or without felling. The results of this exercise (Fig.
9) are very similar to those for the lower Afon Hore and South2Hore with similar control and fell fluxes prior to felling and a marked deviation for the first two years post-felling. After this time the fell response starts to approach a plateau of about 200 kg-N ha–1 but because of the shorter
record, any subsequent changes cannot be commented on here.
Nant Tanllwyth and Tan1f
Because of the lack of a representative control for the Nant Tanllwyth and Tan1c, it is difficult to provide a thorough assessment of the flux changes with felling. However, it is worthwhile to attempt an estimate based on the assumption that the average flux for the control will be approximately that for the felled site prior to felling. On this basis, the flux changes over time are shown in Figs. 10 and 11. The reader is cautioned over the detailed use of the information, but the general behaviour is worth noting.
For the Nant Tanllwyth, the following pattern is observed.
z Nitrate. There seems to be a small increase in the nitrate
flux with felling up to a maximum of about 17 kg-N ha–1. The maximum is reached after about two to three
Fig. 9. Cumulative nitrate fluxes and flux differences for SE1f and
SE3c.
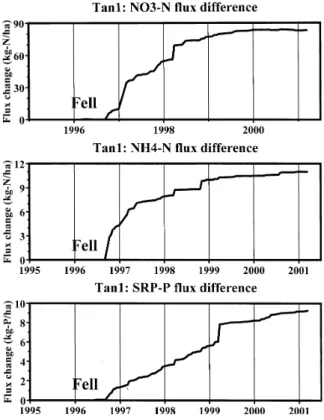
Fig. 10. An assessment of felling flux change for the Tan1.
Fig. 11. An assessment of felling flux change for the Nant Tanllwyth
and a net loss is recorded over the full monitoring period.
z Ammonium. For ammonium, there is also an increase in flux with felling (1996), but this is offset by about two years before it is observed (1998). The flux increase corresponds to about 2.5 kg-N ha–1 and after the major
response, which takes place over a one-year period. There is a continued plateau where the ammonium flux is the same as that pre-felling. There are clear “step changes” and these correspond to periods of high flow and high ammonium spikes in concentration.
z SRP. SRP flux shows a steep increase with felling the
year after clear cutting. There are clear “step changes” and these correspond to periods of high flow and high SRP concentrations. The flux increase corresponds to around 1.7 kg-P ha–1.
For Tan1, there is a marked increase in nitrate, ammonium and SRP fluxes with felling. For nitrate and ammonium, the flux increase began in the autumn of the same year as the felling and the felling response continued for about one to two years after which time the flux change flattened off and fluxes returned to pre-fell levels. The felling flux response for nitrate and ammonium is about 85 and 11 kg-N ha–1, respectively. For SRP, the felling response began in
has increased over two to three years and has now reached an approximate plateau value of around 9 kg-P ha–1: i.e.
after about three or four years, the felling response is over and the flux has returned to a pre-fell value.
Comparison of the flux changes for the Nant Tanllwyth and the associated ditch Tan1c shows:
z The flux changes are much higher for the ditch than the
main stream and clearly there is not only a localised gain within the catchment but also a subsequent loss within parts of the catchment prior to reaching the stream.
z Ammonium and SRP fluxes plateau for both the ditch
and the main stream but the onset of ammonium release is delayed within the main channel.
z. Nitrate flux changes for the ditch increase then plateau
out to a steady state value corresponding to pre-fell
fluxes. However, the main stream shows an increase and then a decline in flux change. Clearly for the main stream there seems to be a recovery response.
Discussion
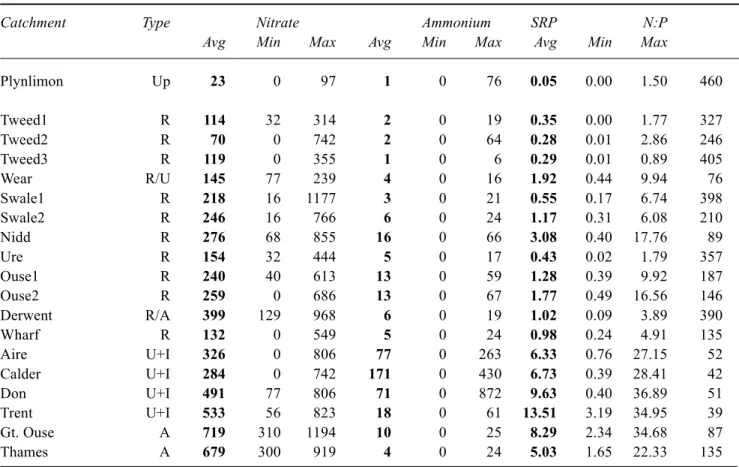
The Plynlimon upland environment is very clean compared to lowland river counterparts. This is illustrated in Table 4 where average concentrations and ranges are shown for the lower Afon Hafren and eastern UK rivers entering the North Sea. The salient features are.
z Nitrate. Nitrate concentrations are low compared to the
eastern UK rivers. The concentrations are about five times lower than the rural lowland rivers and about twenty times lower than for the agriculturally, urban and industrially influenced rivers.
Table 4. A comparison between flow-weighed average, minimum and maximum concentrations of nitrate, ammonium and
SRP for Plynlimon streams (the lower Afon Hafren is used as an example) and eastern UK lowland rivers. The catchment type is described in terms of upland (Up), rural (R), rural with some urban (R/U), urban and industrial (U+I), rural with some agriculture (R/A) and agricultural (A) types. Where more than one site is recorded on a river, the sites are numbered sequentially in downstream order. The data for the eastern UK rivers are taken from Neal and Robson (2000) and all the units are µM l-1. The nitrate to SRP ratio is also provided to illustrate the degree of N:P limitation (N:P is provided on a µM
l-1: µM l-1 basis).
Catchment Type Nitrate Ammonium SRP N:P Avg Min Max Avg Min Max Avg Min Max
Plynlimon Up 23 0 97 1 0 76 0.05 0.00 1.50 460 Tweed1 R 114 32 314 2 0 19 0.35 0.00 1.77 327 Tweed2 R 70 0 742 2 0 64 0.28 0.01 2.86 246 Tweed3 R 119 0 355 1 0 6 0.29 0.01 0.89 405 Wear R/U 145 77 239 4 0 16 1.92 0.44 9.94 76 Swale1 R 218 16 1177 3 0 21 0.55 0.17 6.74 398 Swale2 R 246 16 766 6 0 24 1.17 0.31 6.08 210 Nidd R 276 68 855 16 0 66 3.08 0.40 17.76 89 Ure R 154 32 444 5 0 17 0.43 0.02 1.79 357 Ouse1 R 240 40 613 13 0 59 1.28 0.39 9.92 187 Ouse2 R 259 0 686 13 0 67 1.77 0.49 16.56 146 Derwent R/A 399 129 968 6 0 19 1.02 0.09 3.89 390 Wharf R 132 0 549 5 0 24 0.98 0.24 4.91 135 Aire U+I 326 0 806 77 0 263 6.33 0.76 27.15 52 Calder U+I 284 0 742 171 0 430 6.73 0.39 28.41 42 Don U+I 491 77 806 71 0 872 9.63 0.40 36.89 51 Trent U+I 533 56 823 18 0 61 13.51 3.19 34.95 39 Gt. Ouse A 719 310 1194 10 0 25 8.29 2.34 34.68 87 Thames A 679 300 919 4 0 24 5.03 1.65 22.33 135
z Ammonium. Ammonium concentrations are similar to
those for the cleanest of the rural rivers and typically about fifty times lower than the urban and industrially influenced lowland rivers.
z SRP. SRP concentrations at Plynlimon are much lower
(by a factor of five) than the cleanest of the rural lowland rivers and typically two orders of magnitude lower than the agriculturally, urban and industrially influenced rivers.
Like the cleanest of the rural rivers, the Plynlimon streams represent an extreme for the UK in relation to inorganic phosphorus (SRP) limitation as shown by the low SRP concentrations and high NO3-N:SRP-P ratios (Table 4). The main source of SRP at Plynlimon is probably the atmosphere and most of this source is retained by the catchment. Given the low inputs and lack of major phosphorus sources from the bedrock, the Plynlimon stream concentrations of SRP are low relative to their lowland counterparts with their additional inputs from urban, industrial and agricultural sources (c.f. Jarvie et al., 1998). For nitrate, there is an approximate net input-output balance, but a more variable response is observed at a local scale and probably reduction of nitrate occurs within some of the gley sites. For ammonium and SRP, there is a net uptake by the catchment; ammonium seems to provide the main form of inorganic nitrogen fertilisation for the catchment. The nitrate, ammonium and SRP fluxes in runoff for the main streams are 4.3 to 6.8 kg-N ha–1 yr–1, 1.3 to 3.0 kg-N ha–1 yr–1 and
0.02 to 0.03 kg-P ha–1 yr–1.
In terms of temporal variation of the inorganic nitrogen and phosphorus in the streams, only nitrate shows a clear response of a classic cyclical pattern linked to biological growth and decay during the year. Ammonium and SRP concentrations in the streams are low and there is no clear temporal pattern of change. Nonetheless, there are in some cases clear changes associated with felling.
The effects of felling differ for the podzol and gley systems. For the podzols, there is a marked release of nitrate with felling but there is no discernable change for ammonium and SRP. The nitrate response for the podzols is characterised into three phases.
1. There is an initial felling response. During this time, the changes in nitrate concentration and flux increase markedly. This increase continues during the time of felling and for another two to four years.
2. There is a balanced response where the remnant of the initial “felling response” is balanced by a net uptake into the newly developing biomass, the “recovery response”. This phase lasts for about six years.
3. As the initial felling response terminates, the recovery response becomes more dominant and concentrations and fluxes become lower than pre-fell times.
For the podzols, the extent of change varies from site to site and the period over which felling occurs. The net release of nitrate is in the range 27 to 200 kg-N ha–1 (about 78
kg-N ha–1 for the main stream). In terms of an overall flux
balance, between the felling response and the subsequent recovery, extrapolation of the recovery responses over time yields a value of 10 to 20 years for a net balance.
For the gleys, there is a variable response for nitrate, ammonium and SRP depending upon scale. At the local scale, felling results in marked increases in nitrate, ammonium and SRP that last for two or more years post-felling. This type of response has been observed previously in the UK (Adamson and Hornung, 1990). However, at the larger scale there is a much smaller felling response and the present study cannot provide a detailed assessment of change because of the lack of a suitable control site on which to judge the felling response. Broadly, the difference between the local scale and the much larger catchment outlet level probably reflects the situation where a net release of SRP at the local scale stimulates, at the larger scale, a major biological response in the extremely phosphorus limited conditions that usually prevail. Given the much higher concentrations of inorganic nitrogen compared to inorganic phosphorus in the streams, much greater removal of nitrate than SRP occurs. However, it must be borne in mind that the N:P requirement of organisms is about 15:1 nitrogen atoms to phosphorus atoms (the Redfield ratio). The proportionate losses observed are thus to be expected (cf Gibson, 1997).
Wider comments
The presentation made here fits well with earlier studies of the water quality functioning of UK river systems and the paper adds to the basic information on the nutrient functioning of the UK uplands and specific details for the Plynlimon catchments. However, in one way, the results have one remarkable feature and that concerns the gleys where it seems that release of SRP at the local scale can promote biological activity leading to loss of both inorganic nitrogen and phosphorus at the catchment outlet. The uptake may be directly into the developing biomass and/or via reduction to ammonium and uptake into the biomass and cation exchange complexes within the soil. From the present study, it is not clear where such loss is occurring (i.e. within the catchment near the stream or within the stream itself). Further, the dynamics of nutrient change are unclear in
relation to hydrology as the low permeability of the gley soils may mean that the drainage ditches are not truly representative of flow other than mainly stagnant conditions. However, the hydrological factors would not explain the lack of a major nitrate response for nitrate at the catchment scale for the gleys relative to the podzols where a response is clearly observed.
In relation to this special volume on nitrogen modelling in catchments, the results of this study provide four principal aspects for further consideration linked to assessing environmental impacts of felling and the issue of sustainability.
1. For the uplands, particularly with regards to forestry cycles, it is necessary to consider phosphorus and nitrogen dynamics together given their strong biological interactions and the extreme phosphorus limitation. 2. For the uplands there are also issues of acidification
linked to nitrate generation and this is of critical concern to issues such as sustainable forest management (Neal, 2002).
3. Within the context of modelling the nutrient dynamics of river basins from source to estuaries, the relationship between inorganic nitrogen and phosphorus needs examining as there will be a progressive increase in SRP concentration and a decrease in the N:P ratio that will affect the biological activity within the river. 4. The results provide the intriguing possibility that small
amounts of inorganic phosphorus might even negate the felling nitrate response for catchments. This may even reduce the extent of acidification associated with felling (Neal et al., 1998a,b): indeed, under certain circumstances phosphate fertilisation is used already at the time of forestry planting.
Finally, it must be emphasised that the changes observed in water quality functioning within catchments and stream outlets occur over more than 20 years but that maintenance of long-term records is proving difficult. For many parts of the world, catchment ecosystems are sensitive to anthropogenic and climate change. The UK uplands are a case in point with regards to acid deposition, land use change and climate change. It is important that such areas are protected given that they are areas of outstanding natural beauty, of high amenity value and major areas of water resource of the UK. To observe a full forest cycle or the influence of a changing weather pattern, as encountered within the UK probably means that much longer monitoring is required than has been undertaken to date at Plynlimon or any of the remaining few catchment studies within the UK uplands. However, it remains difficult to maintain such
programmes due to short-term policies in funding based on an incorrect assumption that models are sufficiently developed and sufficiently inexpensive to replace measurement (Neal, 1997b). Modelling work in a complex environment requires long term high quality data to show what actually happens over timespans of decades and longer in order to make reliable predictions of change: this is recognised by both the field scientist and the environmental modeller alike. Maintenance of long term monitoring programmes of the type described in this paper is of strategic importance.
References
Adamson, J.K. and Hornung, M., 1990. The effects of clearfelling a Sitka Spruce (Picea sitchensis) plantation on solute concentrations in drainage water. J. Hydrol., 116, 287–297. Gibson, C.E., 1997. The dynamics of phosphorus in freshwater
and marine environments. In: Phosphorus loss from soil to water (H. Tunney, O.T. Carton, P.C. Brookes and A.E. Johnson (Eds.), CAB International (Wallingford), 119–136.
Hill, T., 2000. Dynamic modelling and analysis of hydrochemistry in upland forested catchments. PhD Thesis, University of Reading. Aquatic Environments Research Centre, The University of Reading, Department of Geography, Whiteknights, P.O. Box 227, Reading, RG6 6AB, UK. 199pp.
Hudson, J.A., Gilman, K. and Calder, I., 1997a. Land use and water quality issues in the uplands with reference to the Plynlimon study. Hydrol. Earth Syst. Sci., 1, 389–397. Hudson, J.A., Crane, S.B. and Blackie, J.R., 1997b. The Plynlimon
water balance 1969-1995: the impact of forest and moorland vegetation on evaporation and streamflow in upland catchments. Hydrol. Earth Syst. Sci., 1, 409–427.
Jarvie, H.P., Whitton, B.A. and Neal, C., 1998. Nitrogen and phosphorus in east coast British rivers: speciation, sources and biological significance. Sci. Total Envir., 210/211, 79–101. Murphy, J. and Riley, J.P., 1962. A modified single solution method
for the determination of phosphate in natural waters. Analytica Chim. Acta., 27, 31–36.
Neal, C. (Ed.), 1997a. Water quality of the Plynlimon Catchment (UK). Hydrol. Earth Syst. Sci., 1, 381–764.
Neal, C., 1997b. A view of water quality from the Plynlimon watershed. Hydrol. Earth Syst. Sci., 1, 743–754.
Neal, C., 2002. Assessing environmental impacts on stream water quality: the use of cumulative flux and cumulative flux difference approaches to deforestation of the Hafren Forest, mid-Wales. Hydrol. Earth Syst. Sci., 6, 421–432.
Neal, C. and Kirchner, J.W., 2000. Sodium and chloride levels in rainfall, mist, streamwater and groundwater at the Plynlimon catchments, mid-Wales: inferences on hydrological and chemical controls. Hydrol. Earth Syst. Sci., 4, 295–310. Neal, C. and Robson, A.J., 2000. A summary of river water quality
data collected within the Land -Ocean Interaction Study: core data for eastern UK rivers entering the North Sea. Sci. Total Envir., 251/252, 585–666.
Neal, C., Wilkinson, J., Neal, M., Harrow, M., Wickham, H., Hill, L. and Morfitt, C., 1997. The hydrochemistry of the River Severn, Plynlimon, mid-Wales. Hydrol. Earth Syst. Sci., 1, 583– 618.
Neal, C., Reynolds, B., Adamson, J.K., Stevens, P.A., Neal, M., Harrow, M. and Hill, S., 1998a. Analysis of the impacts of major anion variations on surface water acidity particularly with regard to conifer harvesting: case studies from Wales and Northern England. Hydrol. Earth Syst. Sci., 2, 303–322.
Neal, C., Reynolds, B., Wilkinson, J., Hill, T., Neal, M., Hill, S. and Harrow, M., 1998b. The impacts of conifer harvesting on runoff water quality: a regional study for Wales. Hydrol. Earth Syst. Sci., 2, 323–344.
Neal, C., Neal, M. and Wickham, H., 2000. Phosphate measurement in natural waters: two examples of analytical problems associated with silica interference using phosphomolybdic acid methodologies. Sci. Tot. Environ., 251/
252, 513–524.
Neal, C., Reynolds, B., Neal, M., Pugh, B., Hill, L. and Wickham, H.D., 2002. Long-term changes in the water quality of rainfall, cloud water and stream water for moorland, forested and clear-felled catchments at Plynlimon, mid-Wales. Hydrol. Earth Syst. Sci., in press.
Wade, A.J. and Whitehead, P.G., 2002. The prediction and management of aquatic nitrogen pollution across Europe: An introduction to the Integrated Nitrogen in European Catchments project. Hydrol. Earth Syst. Sci., 6, 299–313.
Wade, A.J., Whitehead, P.G., Hornberger, G.M. and Snook, D.L., 2001a. On modelling the flow controls on macrophyte and epiphyte dynamics in a lowland UK catchment: River Kennet, southern England. Sci. Tot. Environ., in press.
Wade, A.J., Whitehead, P.G., Hornberger, G.M., Jarvie, H.P. and Flynn, N., 2001b. On modelling the impacts of phosphorus stripping at sewage works on in-stream phosphorus and macrophyte/epiphyte dynamics: a case study for the River Kennet. Sci. Tot. Environ., in press.
Wade, A.J., Durand, P., Beaujouan, V., Wessels, W., Raat, K., WhiTehead, P.G., Butterfield, D., Rankinen, K. and Lepisto, A., 2002. A nitrogen model for European catchments: new model structure and equations. Hydrol. Earth Syst. Sci., 6, 559– 582.
Whitehead, P.G., Wilson, E.J. and Butterfield, D., 1998a. A semi distributed Integrated Nitrogen model for multiple source assessment in Catchments (INCA): Part I - model structure and process equations. Sci. Tot. Environ., 210/211, 547–558. Whitehead, P.G., Wilson, E.J., Butterfield, D. and Seed, K., 1998b.
A semi distributed Integrated Nitrogen model for multiple source assessment in Catchments (INCA): Part II - application to large river basins in south Wales and Eastern England. Sci. Total Envir., 210/211, 559–584.
Wilkinson, J., Reynolds, B., Neal, C., Hill, S., Neal, M. and Harrow, M. 1997. Major, minor and trace element composition of mist and rainwater at Plynlimon, mid-Wales. Hydrol. Earth Syst. Sci. 1, 557–570.