HAL Id: insu-02087590
https://hal-insu.archives-ouvertes.fr/insu-02087590
Submitted on 2 Apr 2019
HAL is a multi-disciplinary open access
archive for the deposit and dissemination of
sci-entific research documents, whether they are
pub-lished or not. The documents may come from
teaching and research institutions in France or
abroad, or from public or private research centers.
L’archive ouverte pluridisciplinaire HAL, est
destinée au dépôt et à la diffusion de documents
scientifiques de niveau recherche, publiés ou non,
émanant des établissements d’enseignement et de
recherche français ou étrangers, des laboratoires
publics ou privés.
Earth-like Exoplanets: VUV-MIR Spectroscopy of
CHON Tholins
Lisseth Gavilan, Nathalie Carrasco, Søren Hoffmann, Nykola Jones, Nigel
Mason
To cite this version:
Lisseth Gavilan, Nathalie Carrasco, Søren Hoffmann, Nykola Jones, Nigel Mason. Organic Aerosols in
Anoxic and Oxic Atmospheres of Earth-like Exoplanets: VUV-MIR Spectroscopy of CHON Tholins.
The Astrophysical journal letters, Bristol : IOP Publishing, 2018, 861 (2), pp.art. 110.
�10.3847/1538-4357/aac8df�. �insu-02087590�
ORGANIC AEROSOLS IN ANOXIC AND OXIC ATMOSPHERES OF EARTH-LIKE EXOPLANETS: VUV-MIR SPECTROSCOPY OF CHON THOLINS
Lisseth Gavilan,1Nathalie Carrasco,1 Søren Vrønning Hoffmann,2 Nykola C. Jones,2 and Nigel J. Mason3
1LATMOS, Universit´e Versailles St Quentin, UPMC Universit´e Paris 06, CNRS, 11 blvd d’Alembert, 78280 Guyancourt, France 2ISA, Department of Physics and Astronomy, Aarhus University, Ny Munkegade 120, DK-8000 Aarhus C, Denmark
3Department of Physical Sciences, The Open University, Milton Keynes MK7 6AA, UK
ABSTRACT
Organic hazes can drastically impact the characterization and detection of exoplanet atmospheres. We explore the effects of the transition from an anoxic to oxic atmosphere on the molecular structure of organic aerosols, by producing aerosols in N2:CO2:CH4-rich plasmas with increasing CO2/CH4 gas ratios. We performed a spectroscopic
study on the resulting aerosol analogs, CHON-rich tholins, from the vacuum-ultraviolet (VUV) to the mid-infrared (MIR), i.e. the 0.13 - 10 µm range. VUV spectroscopy revealed the presence of π - π∗ and n - π∗ transitions in the 200 - 500 nm range in all samples. These are attributed to electronic transitions in amine groups. As the CO2/CH4
ratio increases, new bands emerge that can be attributed to electronic transitions in hydroxyl and carboxyl functional groups. MIR spectroscopy showed that the molecular structure of oxidized aerosols is dominated by the CO2/CH4
ratio. Band deconvolution revealed the oxygenation of the organic matrix via the formation of oxygenated functional groups including amide, hydroxyl, and carbonyl groups. For the most oxidized aerosols absorption is greatest in the 0.13 - 0.3 µm and 6 - 10 µm regions. Some of the oxidized samples were further irradiated with VUV photons, resulting in the formation of π - π∗ bands in the 200 - 250 nm region and a decrease in the band intensities below 200 nm, attributed to amine and nitrile losses. We discuss how oxidized aerosols could provide a detectable [bio]-signature in exoplanet atmospheres.
Keywords: Planets and satellites: atmospheres, fundamental parameters - Methods: laboratory: solid state - Techniques: spectroscopic
Corresponding author: Lisseth Gavilan
1. INTRODUCTION
Photochemical aerosols are present across the atmo-spheres of several bodies in the Solar system. These can be observed as hazes from the stratosphere to the iono-sphere. As such, and depending on their optical proper-ties, morphology and size distribution, they could heav-ily impact the radiative transfer of solar radiation and planetary surface temperature. One of the most notable examples of an atmosphere dominated by photochem-ical aerosols is Titan. Its quasi-reducing atmospheric chemistry is the result of photon and energetic parti-cles (protons, cosmic rays) impact on N2 and CH4, an
efficient gas mixture for the generation of organic photo-chemical aerosols (Wilson & Atreya 2004;Lavvas et al. 2013).
On Earth organic aerosols are presently one of the largest drivers of radiative forcing, affecting the Earth’s thermal balance and providing a mechanism for cli-mate change (Jacobson et al. 2000). In the Archean Earth (∼4 - 2.5 Gyr ago) the presence of photochemical aerosols could have influenced early planetary habitabil-ity via radiative shielding and surface cooling (Pavlov et al. 2001). Unlike Titan’s anoxic atmosphere, CO2
is expected to have been present in the atmosphere of Earth from its early stages following the emergence of life (Kasting 1993;Feulner 2012;von Paris et al. 2008). Atmospheric oxidation therefore probably impacted the formation and optical properties of early organic hazes (Haqq-Misra et al. 2008; Wolf & Toon 2010).
Aerosols are likely to be ubiquitous in the atmospheres of extrasolar planets (Marley et al. 2013) and their com-position can be as widely varying as that of the exo-planetary atmospheres that they are formed in (Lavvas & Koskinen 2017). Methane was detected in the at-mosphere of exoplanet HD 189733b (Swain et al. 2008) with CO, CO2 and H2O (Swain et al. 2009a). Swain et al.(2009b) detected H2O, CH4, and CO2in the
near-infrared spectrum of exoplanet HD 209458b. CO2
pho-todissociation is relevant to the radiative transfer in ex-oplanet atmospheres (Venot et al. 2017). Its presence could also affect the photochemical production of or-ganic hazes in Earth-like exoplanets as shown by mod-els, (Arney et al. 2017), and experiments (Trainer et al. 2006;Fleury et al. 2017;Gavilan et al. 2017).
While the optical properties of organic aerosols are needed to refine models of the Archean Earth and exo-planet atmospheres, their molecular properties are nec-essary to understand the spectral variations as a func-tion of the degree of oxidafunc-tion. The aim of this work is to experimentally simulate the composition of increas-ingly oxidizing atmospheres to understand the impact of CO2 in the optical properties of the generated
or-ganic aerosols covering a wide spectral range, from the vacuum-ultraviolet to the mid-infrared. This study is a continuation of our first study on the UV-visible com-plex refractive indices of oxidized organic aerosols ( Gav-ilan et al. 2017) but here we focus our study on the molecular, electronic and absorption properties of these aerosols.
2. EXPERIMENTS
Tholins were produced using the PAMPRE1
exper-imental facility, a low-pressure (0.95 mbar) radiofre-quency (RF) plasma reactor (Szopa et al. 2006). This apparatus allows the simulation of the complex organic chemistry initiated by energetic particles in planetary ionospheres. The 13.56 MHz RF source, set to 30 W, generates a capacitively coupled plasma fed by a gas mixture at 0.95 mbar. The aerosol analogs pre-sented in this study were prepared in a cold plasma where neutrals have a temperature of ∼340 K. However, the most observed exoplan-ets to date are hot giants (∼800 - 3000 K) and are particularly conducive to atmospheric obser-vations (Madhusudhan et al. 2016). Future labo-ratory simulations under different temperatures and pressures should explore how these param-eters could further impact the formation, com-position and optical properties of aerosols. This paper is a first step in the investigation on the molecular properties of oxidized organic aerosols. Initially a gas mixture was chosen to simulate the re-ducing composition of Titan’s atmosphere, i.e., N2:CH4
with a 95:5 ratio (e.g. Sciamma-O’Brien et al. 2012;
Mahjoub et al. 2012). We then simulated increasingly oxidizing atmospheres by adding CO2to the N2-CH4gas
mixture. The resulting tholins, solids rich in C, H, O, and N (CHON-rich), are produced on substrates placed on the bottom electrode of the capacitor producing the plasma. One set of samples was prepared with a gas mixture keeping the N2 partial pressure at 90%, while a
second set of samples was prepared keeping the N2
par-tial pressure at 95%. For both series, gas mixtures with CO2:CH4 ratios equal to 0, 1, 1.5 and 4 were used.
We can translate the CO2:CH4 ratios into C/O ratios,
used to characterize exoplanet atmospheres in terms of their carbon content (e.g.Venot et al. 2015),
C O = 1 × NCO2+ 1 × NCH4 2 × NCO2 = 0.5 + 0.5 CO2: CH4 (1)
1 PAMPRE: Production d’A´erosols en Microgravit´e par Plas-mas REactifs
Using this conversion we find C/O ratios equal to ∞, 1, 0.83, 0.68. According to Venot et al. (2015), this C/O range includes C-rich (C/O = ∞ and 1) and near-solar (C/O = 0.68) type atmospheres.
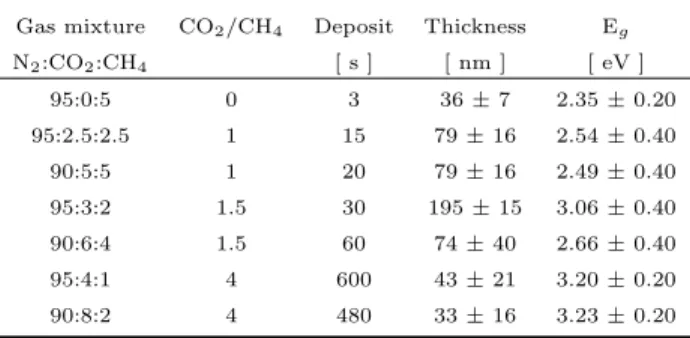
The gas mixtures and deposition times of tholins are shown in Table 1. Although the deposition timescales differ by a factor of 100 between ex-periments, we have strived to obtain a film thick-ness leading to sufficient S/N in transmission over the VUV-MIR range. Additional effects like sputtering and electron impact from longer expo-sures to the plasma could further affect the prop-erties of such films and this will be the object of further studies. During deposition, bare silicon (10 × 10 mm) and MgF2 windows (20 mm diameter) were
placed on the bottom electrode within the PAMPRE chamber. The thickness of the deposited films is esti-mated from ellipsometry on the Si substrates, and the method is described in Gavilan et al. (2017). In this paper we present the result of transmission mea-surements performed on the films deposited on MgF2windows. Synchrotron and benchtop
spec-trophotometers were used to measure the trans-mission spectra of these films in the vacuum-ultraviolet (VUV; 130 - 250 nm), the vacuum- ultraviolet-visible (UV-Vis; 210 - 1000 nm), near-infrared (NIR; 1 3 µm) and midinfrared (MIR; 1.43 -10 µm) spectral ranges. These are described in more detail below.
Although the film thickness can vary from one sub-strate to the other during plasma deposition, we esti-mate that this variation does not exceed 30% of the thickness measured on the films deposited on Si. The estimated thickness of each film is reported in Table 1. According toArney et al. (2017) the production of organic hazes is decreased when CO2:CH4 >
10. In our study, the aerosol production rate is drastically quenched at a CO2:CH4 ratio of 4.
Table 1. Synthesis parameters for tholins prepared at in-creasing CO2/CH4 ratios, thickness, and Tauc gap energies.
Gas mixture CO2/CH4 Deposit Thickness Eg
N2:CO2:CH4 [ s ] [ nm ] [ eV ] 95:0:5 0 3 36 ± 7 2.35 ± 0.20 95:2.5:2.5 1 15 79 ± 16 2.54 ± 0.40 90:5:5 1 20 79 ± 16 2.49 ± 0.40 95:3:2 1.5 30 195 ± 15 3.06 ± 0.40 90:6:4 1.5 60 74 ± 40 2.66 ± 0.40 95:4:1 4 600 43 ± 21 3.20 ± 0.20 90:8:2 4 480 33 ± 16 3.23 ± 0.20
VUV transmission spectra were measured on the AU-UV beam line at the ASTRID22 synchrotron at
Aarhus University, Denmark (Palmer et al. 2015). Thin films deposited on MgF2 windows were placed in the
lollipop sample holder, able to mount up to four sam-ples. UV-Vis transmission spectra were measured with a bench-top UV-Vis spectrometer (Thermo Scien-tific Evolution 300 ). The overlapping spectral range was used to combine the VUV and UV-Vis datasets. One sample, the fully-reduced tholin, had previously been measured in the APEX3 chamber of the DISCO4 beam
line of the SOLEIL5 synchrotron. We confirmed that
VUV spectra are reproducible between beam lines at both facilities.
Near-infrared transmission spectra were mea-sured at the Planetary Emissivity Laboratory (DLR) using a vacuum Fourier transform infrared (FTIR) spec-trometer (Bruker Vertex 80V) with a liquid nitrogen cooled HgCdTe (mercury cadmium telluride, MCT) de-tector at 1 cm−1 spectral resolution. A Bruker A480 parallel beam accessory was mounted in front of the sample holder within the Vertex 80V to reduce artefacts due to beam reflections on the sample. This accessory helps collimate the beam when measuring highly refractive/reflective sam-ples in transmission mode.
Mid-infrared transmission spectra were mea-sured with a vacuum FTIR spectrometer (Bruker Ver-tex 80V) available at ASTRID2. The reduced tholin mid-infrared spectrum was measured on the iN10 in-frared microscope available at SOLEIL. These were recorded at 4 cm−1 spectral resolution and were corrected with a polynomial baseline to subtract the continuum absorption.
3. VUV AND MIR SPECTROSCOPY
Our spectroscopic analysis involves deconvolution of the main electronic bands for the VUV-UV spectra and of the main vibrational modes in the MIR spec-tra. This is done via the Levenberg-Marquardt non-linear least-squares minimization method using the IDL MPFIT routine (Markwardt 2009). We have chosen Gaussian band shapes, suitable for characteriz-ing molecular transitions in solids. In fittcharacteriz-ing each band the peak position and intensity are left as free pa-rameters, while the width is varied up to 10% between
2ASTRID: Aarhus STorage RIng in Demmark 3APEX: Atmospheric Pressure Experiment 4DISCO: Dichroism, Imaging and SpectrosCOpy
5 Source Optimis´ee de Lumi`ere d’ ´Energie Interm´ediaire du LURE
spectra. Band positions and widths may shift depending on the bonding environment for each sample.
3.1. VUV-Visible spectroscopy
Figure 1. Vis-VUV spectra of tholins (normalized to the maximum optical depth in this range), prepared in plasmas of increasing CO2/CH4 ratios. Due to the large thickness
(d ∼195 nm), the VUV spectrum of the 95:3:2 tholin (green curve) is saturated for wavenumbers larger than 6 µm−1.
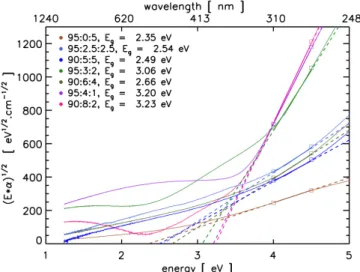
Figure 2. Tauc optical gap determination from the visible to near ultraviolet spectra for tholins prepared in plasmas with increasing CO2/CH4 ratios in N2:CO2:CH4 mixtures.
The VUV-visible spectra of the oxidized tholins have been normalized to the maximum optical depth in the VUV. These are shown in Fig. 1. We notice that in-creasing the CO2/CH4 ratio has a direct effect on the
Table 2. VUV electronic bands assignments
Label Peak pos. Literature Electronic Functional nm / eV position (eV) transition group G1 215 / 5.77 5.70a, 5.77b n N → 3sa Amine G2 166 / 7.47 7.14c, 7.93d n N → 3pa Amine G3 118 / 10.51 10.16e- 12f σ - σ∗, n - σ∗ Methyl G4 300 / 4.13 3.50g- 4.75h π - π∗, n - π∗ Carbonyl G5 185 / 6.7 6.2 - 7.5i nO→ σ∗ Hydroxyl G6 241 / 5.15 5.80j nO→ π∗ CO Carboxyl aHubin-Franskin et al.(2002) bTannenbaum et al.(1953) cTannenbaum et al.(1953) dHarshbarger(1971) eWorkman(2016) fGavilan et al.(2016) gHornback(2005)
hGadallah et al.(2011);Robertson & O’Reilly(1987) iXu et al.(1999)
jBarnes & Simpson(1963);Ari & Gven(2000)
electronic absorption bands of these tholins. This evo-lution is best represented by the appearance of a narrow but intense peak at ∼180 nm and a decrease in the in-tensity of the far-UV (FUV) band. Varying the N2
partial pressure from 90 to 95% has a negligible effect on the VUV spectra of tholins prepared with similar CO2/CH4 ratios.
We used the visible-near UV spectral range (250 - 1000 nm) to determine the optical band gap of these mate-rials, also known as the Tauc gap (Tauc et al. 1966). The gap values were obtained by extrapo-lating a regression from the linear region in a (α × E)1/2
versus E plot, where α is the absorption coefficient and E is in eV. The Tauc extrapolation is found using the linear region between the visible and near ultraviolet range, i.e. 3.8 - 4.5 eV. This region avoids the expo-nential absorption tail appearing in the visible energy range (1.2 - 3.8 eV), characteristic of disorder in amor-phous materials, known as the Urbach tail (Jones 2012;
Urbach 1953). We varied the endpoints of this range to determine the average systematic error in the gap de-termination. The gap values are listed in Table 1. We note that, as the CO2/CH4ratio increases, so does the
gap value, i.e. Egincreases from 2.35 to 3.20 eV. These
gap values are consistent (within the error bar) with those found via the ellipsometry on similar films deposited on Si substrates (Gavilan et al. 2017), validating the coherence of both methods. As seen in Fig. 1, the VUV-visible spectral profile for samples prepared with the same CO2/CH4ratio are
similar, e.g. 95:4:1 and 90:8:2 both with a ratio of 4 and 95:2.5:2.5 and 90:5:5 both with a ratio of 1. Because
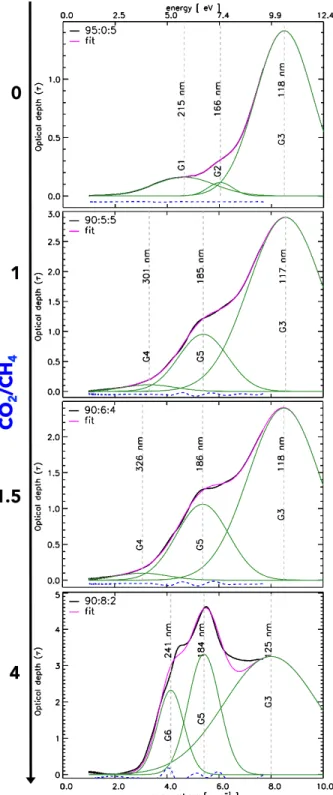
Figure 3. Spectral deconvolution of the Vis-VUV of in-creasingly oxidized organic tholins prepared in plasmas of increasing CO2/CH4 ratios.
the spectra of the 95:3:2 sample is optically saturated in the VUV, we chose the 90 % N2series to deconvolve the
VUV-vis spectra for increasing CO2/CH4 ratios = 0, 1,
1.5, 4. The resulting deconvolution is shown in Fig. 3.
VUV-visible spectra reveal transitions of electrons between the molecular orbitals of organic materials. Identification of possible carriers of the elec-tronic bands in our tholins is done by parison to UV-Vis gas phase spectra of com-mon chromophores present in organic molecules (e.g.Hornback 2005;Workman 2016). These are listed in Table 2. The major electronic transi-tions in organic compounds are σ → σ∗, π → π∗, n → σ∗ and n → π∗, and associated bands. Gener-ally π-electronic transitions are found at 1.6 < λ−1 < 5 µm−1 (200 < λ < 600 nm), while σ-electronic transitions are found at higher energies, λ−1 > 3.8 µm−1 (λ < 260 nm) (Gadallah et al. 2011; Gavi-lan et al. 2016).
For our sample spectra each VUV-Vis spectrum can be deconvolved into three main bands. However, as the oxidation degree increases, band and peak positions are modified. For the tholin with no CO2, two bands, which
we call G1 and G2 are attributed to transitions in amine functional groups. G1 and G2 are assigned to electronic transitions from the lone-pair electrons on nitrogen to ni-trogen atomic-like orbitals (Hubin-Franskin et al. 2002;
Duarte et al. 2013). The largest band, called G3, found in the far-UV, is generally attributed to σ - σ∗ and n -σ∗ type transitions and its peak position is found at 8
< λ−1 < 8.5 µm−1 (118 - 125 nm).
The VUV spectra evolve as the oxidation degree in-creases. The spectra for samples with CO2/CH4 = 1
and 1.5 are remarkably similar. The smaller UV bands have shifted, which signals the molecular evolution of the solid. G4 is then attributed to low energy π - π∗and n - π∗ transitions arising from structural disorder ( Gadal-lah et al. 2011). G5 is a new VUV band centered at λ−1 ∼5.4 µm−1 (185 nm), whose intensity increases
with increasing oxidation degree, and is attributed to electronic transitions in hydroxyl groups due to the pro-motion of an electron from the highest filled molecular orbital to an antibonding orbital (σ∗OH) (Duarte et al. 2013). This band usually appears at 5 < λ−1 < 6.1 µm−1 (165 - 200 nm) (Xu et al. 1999).
Finally, for the most oxidized sample, with CO2/CH4
= 4, the G5 band is most prominent as a consequence of the larger number of oxygenated bonds. G6 is a new band appearing at λ−1 ∼4.2 µm−1 (240 nm) and is assigned to the nO → π∗
CO transitions from the
lone-pair orbital on the carbonyl oxygen to the antibond-ing πCO valence orbital (Barnes & Simpson 1963; Ari & Gven 2000) or to the valence shell excitations of hy-droxyl groups (Duarte et al. 2013). For this sample the position of G3 is shifted to lower energies and its relative intensity decreases, indicating a loss of σ-bonds.
3.2. Mid-infrared spectroscopy
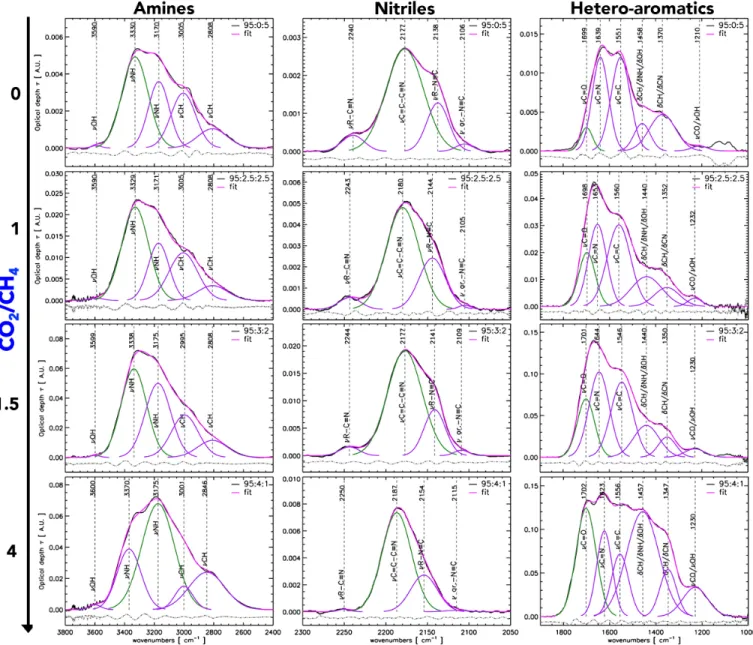
The mid-infrared spectra of our samples were split into three spectral ranges corresponding to the most intense vibrational bands in the mid-infrared: a) amines (3800 - 2400 cm−1), b) nitriles (2300 - 2050 cm−1), and a c) heteroaromatics band (1900 -1000 cm−1) (Mutsukura 1999; Imanaka et al. 2004). We have deconvolved the main mid-infrared spectral bands of all samples prepared with a 95 % N2
con-centration, corresponding to the following N2:CO2:CH4
mixtures: 95:0:5, 95:2.5:2.5, 95:3:2, and 95:4:1, plotted in Fig. 4. Such deconvolution provides further insight into the evolution of the molecular structure of organic aerosols as a function of their oxidation degree. In this first order analysis, we use Gaussian functions to fit the most intense vibrational modes due to broad bonding distributions in the solid net-work that result in statistical bell curves, and ne-glect any perturbations to the line shape due to secondary resonances. Fitting vibrational bands is done by considering the maximum number of Gaussians needed to characterize the vibrational spectra of the CO2/CH4 = 0 tholin, which has
the largest number of peaks. To fit the tholin spectra at different oxidation degrees we have assumed that: 1) the organic network of tholins may be similar to first order, 2) oxidation will produce new bonds that may shift the energies and abundances of functional groups.
For tholins prepared with increasing CO2/CH4ratios,
two main features appear in the amine band. These are attributed to the stretching modes of NH functions in amide groups at ∼3180 cm−1 and to aldehyde CH stretching modes at ∼2800 cm−1. In the nitrile band increasing oxidation translates into a decrease of singly-bonded and aromatic isonitriles at ∼2140 cm−1 and ∼2105 cm−1 respectively and to the decrease of
singly-bonded nitrile modes at ∼2240 cm−1. In contrast at CO2/CH4ratios greater than 1 we note the effect
of increasing oxidation on the heteroaromatic band: the unsaturated C=C and C=N modes de-crease while the intensity of the carbonyl (C=O) band at 1700 cm−1, increases. This is confirmed by the formation of a new band in the region be-tween 1550 and 1300 cm−1, attributed to bend-ing modes in NH2, CH2,3, and C-OH functional
groups.
From the deconvolution of the amines band an in-creasing CO2/CH4 ratio results in the rapid evolution
of the NH stretching mode associated with amides and to the aldehyde CH stretch. Although the primary NH bonds associated with amines are present and common
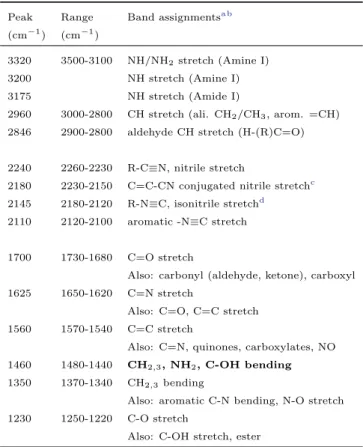
Table 3. Mid-infrared band assignments for tholins pre-pared at increasing CO2/CH4 ratios.
Peak Range Band assignmentsa b (cm−1) (cm−1)
3320 3500-3100 NH/NH2stretch (Amine I)
3200 NH stretch (Amine I)
3175 NH stretch (Amide I)
2960 3000-2800 CH stretch (ali. CH2/CH3, arom. =CH)
2846 2900-2800 aldehyde CH stretch (H-(R)C=O)
2240 2260-2230 R-C≡N, nitrile stretch
2180 2230-2150 C=C-CN conjugated nitrile stretchc 2145 2180-2120 R-N≡C, isonitrile stretchd
2110 2120-2100 aromatic -N≡C stretch
1700 1730-1680 C=O stretch
Also: carbonyl (aldehyde, ketone), carboxyl 1625 1650-1620 C=N stretch
Also: C=O, C=C stretch 1560 1570-1540 C=C stretch
Also: C=N, quinones, carboxylates, NO 1460 1480-1440 CH2,3, NH2, C-OH bending
1350 1370-1340 CH2,3bending
Also: aromatic C-N bending, N-O stretch 1230 1250-1220 C-O stretch
Also: C-OH stretch, ester
ahttp://webbook.nist.gov/chemistry/ b
https://webspectra.chem.ucla.edu/irtable.html
cImanaka et al.(2004) dMutsukura(1999)
for all samples, in samples with a CO2/CH4 = 4 ratio
the NH band associated with amides is relatively more intense. At maximum oxidation there is also a loss of the aliphatic CH stretching band, suggesting a decreased C/N ratio in the most oxidized materials. The decon-volution of the nitrile band shows the progressive loss of isonitrile modes with increasing oxidation. Together with the loss of singly-bonded nitriles, this suggests a gain in disorder in the structure of oxidized tholins. Mass loss through nitriles with respect to the amine and hetero-aromatic bands is a significant effect of oxidation. Due to the large number of overlapping stretching and bending modes deconvolution of the hetero-aromatic band is performed by simplifying the number of partici-pant modes. The region between 1500 - 1300 cm−1is at-tributed to a large peak including the overlapping contri-bution of bending modes from CH, NH and OH groups. As the CO2/CH4 ratio increases the C=O stretching
mode at ∼1700 cm−1increases, while the relative inten-sities of the C=N and aromatic C=C stretching modes decrease. In the plasma oxidation is due to O atoms
Figure 4. Spectral deconvolution of the main mid-infrared spectral bands (amines, nitriles, hetero-aromatics spanning 3800-1000 cm−1) of increasingly oxidized organic tholins. To illustrate the effect of the increasing CO2/CH4 ratio on the molecular
structure, only tholins from the same series (95 % N2) and varying CO2/CH4 ratios = 0, 1, 1.5 and 4, are used.
and OH radicals produced in the dissociation of CO2
and CH4 molecules. As the oxidation degree increases,
the formation of NH and C-N bonds are favored rel-ative to C=N bonds. We also note that, even without CO2in the gas mixture, the C=O mode is present in the
reduced tholin. This could be due to surface oxida-tion by O2 in air whilst transporting the sample
for analysis or to trace oxygen species present in the plasma.
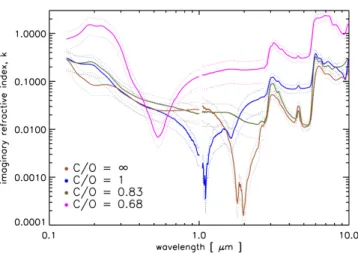
3.3. Absolute imaginary indices
Transmission spectra in the VUV-visible, near-infrared and mid-near-infrared ranges for each sample and
the thicknesses listed in Table 1 are used to estimate the wavelength-dependent imaginary index k(ν), over this spectral region, by means of the rela-tion,
k(ν) = τ (ν)
4πνd, (2) where τ (ν) is the optical depth, ν is the fquency, and d is the sample thickness. The re-sult is shown in Fig. 5. The progressive increase of oxidation in these organic materials directly results in the increase of the absolute absorption over the entire wavelength range (from 0.13 to 9 µm). For the most oxidized tholin, C/O = 0.68, the absolute absorption
Figure 5. Imaginary refractive index k spanning the VUV-Vis, NIR and MIR ranges for tholins prepared at increasing CO2/CH4 or C/O ratios. As oxidation increases the
absorp-tion coefficient increases steeply in the ultraviolet range (130 - 300 nm), linearly in the mid-infrared, while the k inversion region is blueshifted.
increases most prominently in the the VUV, 0.13 - 0.2 µm, and UV, 0.2 - 0.3 µm, in agreement with previous results reported inGavilan et al.(2017).
In the mid-infrared the most absorptive region cor-responds to the hetero-aromatic band, which increases linearly with C/O ratio. We also note a significant drop of k over two orders of magnitude from the VUV to the visible region (0.13 - 1 µm) for the most reduced sam-ple, the Titan type tholin with C/O = ∞. McKay et al.
(2001) showed this drop is essential for reproducing the shape of Titan’s geometric albedo.
The uncertainty in near-infrared absorption is larger due to the lower absorption indices in this region, where k ≤ 0.2. The absorption in the near-infrared increases with oxidation due to the presence of second and third overtones of NH, NH2and OH vibrations. This region is
also characterized by absorption minima. An inversion of k is present at 1.8 - 2 µm for the C/O = ∞ tholin, and the position of this inversion feature blueshifts towards 0.9 - 1.1 µm for the tholin with C/O = 1 and to 0.5 - 0.6 µm for the tholin with C/O = 4. However, this k inver-sion is absent from the tholin corresponding to C/O = 0.83 (90:6:4). Although this sample is more oxidized, as seen by the decrease in nitrile intensity and the oxida-tion of the amine and hetero-aromatic bands, the lack of a minimum imaginary absorption index is surprising. This may be explained by the peculiar plasma conditions produced at a ratio of CO2/CH4= 1.5. At this ratio the
plasma attains a peculiar (dis-)equilibrium where tholin production is enhanced rather than quenched. Further experiments with this particular gas mixture should
un-veil the gas kinetics of this plasma and its effects on aerosol production.
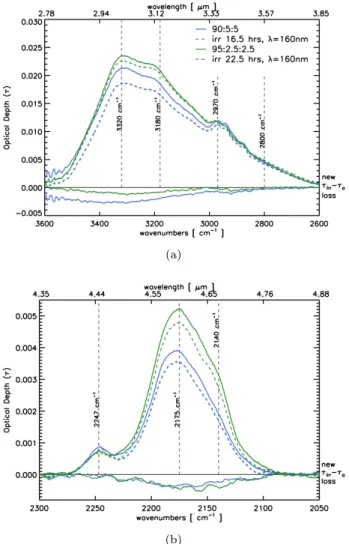
4. VUV IRRADIATION OF THOLINS Two tholins prepared with a ratio of CO2/CH4 = 1
were irradiated with a monochromatic beam of 160 nm photons. The VUV-visible spectra of the samples were measured before, τo, and after irradiation, τirr.
In all cases, a slight decrease in the spectral intensity in the 5.5 - 7 µm−1 (200 - 150 nm) region is attributed to the VUV photolysis of aromatic C=O structures. In contrast, we note the intensity growth of the 3.5 - 4.5 µm−1 (200 - 300 nm) region, attributed to π-bond for-mation of the organic matrix. The photon flux the beam line produces was measured using an AXUV100G pho-todiode. Using the known responsivity of this diode, at λ = 160 nm there are 6.7 × 10¹¹ photons/sec/100 mA. During the irradiation the beam current was recorded every second and the total fluence was calculated based on the average beam current (∼180 mA). The 90:5:5 sample received a dose of ∼5 × 10¹⁷eV cm−2while the
90:6:4 sample received a dose of ∼8 × 10¹⁷eV cm−2.
Figure 6. Vis-VUV spectra of oxidized tholins irradiated with VUV photons. The τirr-τo lines around 0 show the new
and lost band intensities (scaled by a factor of 3).
These results are consistent with previous VUV irradi-ation experiments performed byGadallah et al. (2011) on hydrogenated amorphous carbon (HAC) materials. They used a deuterium lamp, whose emission peaks at 160 nm, and irradiated carbonaceous thin films with doses of at least 1022eV cm−2. UV spectra of the
irradi-ated HAC samples showed an increase of the sp2carbon
fraction, giving rise to π - π∗electronic transitions peak-ing at λ−1 ∼4.6 µm−1 (217 nm). Our irradiation
(a)
(b)
Figure 7. Mid-infrared spectra (normalized) of VUV-irradiated tholins showing the evolution of the a) amine (3600 - 2600 cm−1), and b) nitrile (2300 - 2050 cm−1) bands.
arise at lower UV fluences in organic materials. During irradiation, the transmission of the MgF2window could
also evolve due to VUV photon absorption. However, as MgF2is a non-organic crystal, the growth of new bands
in the 200 - 300 nm range is attributed to the evolution of organic tholin.
The mid-infrared spectra of the VUV irradiated sam-ples were measured before and after irradiation. Fol-lowing irradiation the amine band shows the greatest loss in intensity. This loss is most marked for amines in the 3400 - 3200 cm−1 region, with a maximum loss at ∼3300 cm−1. The lower frequency modes in the amines
region, including the CH and OH bands around 3000 -2600 cm−1, are little affected. Following VUV irradi-ation, the nitrile band shows a general depletion with a maximum loss of conjugated nitriles. Both mass loss (desorption) and photolysis (inducing frag-mentation and/or bond creation) could concur
during the VUV irradiation of tholins. Further experiments are required to unveil which mech-anism is responsible for the photo-degradation effects.
To compare the laboratory UV doses to the radiation from an exoplanet host star, we use the UV spectra of GJ876, an M dwarf observed by the International Ultraviolet Explorer (IUE) (Linsky 2014). In this study, the spectral flux is rescaled to the distance of its habitable zone (0.21 astronomical units, AU). We consider the flux of GJ876 at λ = 160 nm, of ∼8 ergs cm−2 s−1, corresponding to the monochromatic pho-tons used at the synchrotron. The laboratory doses are then equivalent to exposure times of ∼28 hours (for the 90:5:5 tholin) and ∼45 hours (for the 95:2.5:2.5 tholin) at 0.21 AU of GJ876. Considering the slow formation lifetimes of oxi-dized organic aerosol, our laboratory spectra of photo-degraded tholins could be relevant to fu-ture observations of exoplanetary hazes.
5. DISCUSSION
Future space telescopes like ARIEL and LUVOIR will enable the investigation of exoplanets ranging from Jupiter- and Neptune-size down to super-Earth and Earth-size. ARIEL instruments are expected to cover the visible and infrared 0.5 - 7.8 µm range (Tinetti et al. 2016), while LUVOIR will enable multi-wavelength ob-servations covering the ultraviolet to near-infrared from 0.2 - 2.5 µm.
Our spectroscopic VUV-MIR study covering the 0.13 - 10 µm range can thus provide relevant laboratory con-straints for the future observations of exoplanet atmo-spheres. The spectra of oxidized aerosols signals a dis-tinct large absorption in the 0.13 - 0.4 µm range and a flatter but strong absorption band in the 6 - 7.5 µm range relative to reduced aerosols. This high absorp-tion coefficient may increase the detectability of exo-planet atmospheres where hazes form under oxidizing conditions. Together with a weaker nitrile band and a minimum absorption window in the visible range, these constitute potential observables of atmospheric oxidation. Organic aerosols constitute potential exoplanet atmospheric biosignatures, as organic hazes can be derived from biogenic methane (Catling et al. 2017), although abiotic sources are not discarded. While the simultaneous detection of CO2and CH4 in an habitable exoplanet
atmo-sphere has been recently proposed as a potential biosignature (Krissansen-Totton et al. 2018),
en-suing oxidized organic hazes could also constitute observable biosignatures.
6. CONCLUSIONS
We have produced laboratory analogs of oxidized or-ganic aerosols. These were prepared in increasingly ox-idizing plasmas from mixtures of N2:CO2:CH4,
charac-terized by an increasing CO2/CH4 ratio from 0 (fully
reducing) to 4. These correspond to atmospheres with C/O ratios from 0.68, 0.83, 1 and ∞, i.e. represen-tative of carbon-poor, solar-like to carbon-rich atmo-spheres. The samples were characterized via transmis-sion spectroscopy from the vacuum-ultraviolet to the mid-infrared.
• The molecular and electronic structure of these materials is dominated by the CO2/CH4ratio in the N2:CO2:CH4gas
mix-ture. Ultraviolet spectroscopy revealed the pres-ence of π - π∗and n - π∗transitions in the 2 < λ−1 < 5 µm−1 (200 - 500 nm) range in all samples. These are attributed to electronic transitions in amine bonds for tholins prepared in fully reducing conditions. As the CO2/CH4 ratio increases new
bands emerge in this range, attributed to elec-tronic transitions in hydroxyl and carboxyl bonds. For all cases a large absorption band in the far ultraviolet is present and is attributed to σ - σ∗ and n - σ∗ electronic transitions.
• Infrared spectroscopy revealed the formation of oxygenated bonds with increasing CO2/CH4ratio
including stretching modes from NH, OH, C=O, C=N and the formation of a new band in the ∼1400 - 1300 cm−1 region which could be
at-tributed to NH, C-N, OH, C-O bonds, as expected in CHON rich organic matter. The decomposition of the nitriles band revealed the loss of aromatic
nitriles and singly bonded R-N=C=N modes with oxidation.
• The absolute absorption index increases linearly for all samples with increasing degrees of oxida-tion. The absorption is greatest in the VUV-UV range from 0.13 - 3 µm for the most oxidized sam-ples which are also most opaque in the 6 - 10 µm hetero-aromatic band region. Oxidized aerosols show a weaker nitrile band and a blue-shifted ab-sorption minimum compared to reduced aerosols. • VUV irradiation of oxygenated aerosols revealed
the formation of new π - π∗bands in the 4 < λ−1 < 5 µm−1 (200 - 250 nm) region and the loss of electronic bands below 200 nm, corresponding to the formation of NH, C-N, OH bonds and the loss of amines and isonitriles observed in their MIR spectra.
• Our results suggest that oxidative plasma chem-istry can result in solids with complex oxygenated bonds leading to solids that are more opaque in the VUV-MIR range. Because of their high absorption properties, oxidized organic aerosols could improve the detectability of exoplanet atmospheres. This spectral signature is indicative of the presence of oxic atmospheric conditions and could offer a po-tential biosignature for photosynthetic life.
Acknowledgements. We thank the staff at the ASTRID2 syn-chrotron for their help and access to beam time. We thank A. Giuliani for the preliminary VUV measurement of the reduced tholin sample at the DISCO beam line of the SOLEIL synchrotron (project No. 20160171) and E. Dartois for kindly supplying the DISCO-adapted sample holder. We thank A. Maturilli for his help with the near in-frared measurements at the Planetary Emissivity Laboratory (DLR). L.G. recognizes support for this visit from the Europlanet Research Infrastructure funded by the European Union’s Horizon 2020 research and innovation programme under grant agreement No 654208. NJM recognizes support from the COST Action TD1308 Origins. N.C. and L.G. thank the European Research Council for funding via the ERC PrimChem project (grant agreement No. 636829.)
Software:
MPFIT, (Markwardt 2009)REFERENCES
Ari, T., & Gven, M. H. 2000, Journal of Electron Spectroscopy and Related Phenomena, 106, 29 Arney, G. N., Meadows, V. S., Domagal-Goldman, S. D.,
et al. 2017, ApJ, 836, 49
Barnes, E. E., & Simpson, W. T. 1963, JChPh, 39, 670 Catling, D. C., Krissansen-Totton, J., Kiang, N. Y., et al.
2017, ArXiv e-prints, arXiv:1705.06381
Duarte, A. A., Gomes, P. J., Ribeiro, J. H. F., et al. 2013, The European Physical Journal E, 36, 98
Feulner, G. 2012, Reviews of Geophysics, 50, RG2006 Fleury, B., Carrasco, N., Millan, M., Vettier, L., & Szopa,
C. 2017, Earth and Planetary Science Letters, 479, 34
Gadallah, K. A. K., Mutschke, H., & J¨ager, C. 2011, A&A, 528, A56
Gavilan, L., Alata, I., Le, K. C., et al. 2016, A&A, 586, A106
Gavilan, L., Broch, L., Carrasco, N., Fleury, B., & Vettier, L. 2017, ApJL, 848, L5
Haqq-Misra, J. D., Domagal-Goldman, S. D., Kasting, P. J., & Kasting, J. F. 2008, Astrobiology, 8, 1127 Harshbarger, W. R. 1971, JChPh, 54, 2504
Hornback, J. 2005, Organic Chemistry (Cengage Learning) Hubin-Franskin, M.-J., Delwiche, J., Giuliani, A., et al.
Imanaka, H., Khare, B. N., Elsila, J. E., et al. 2004, Icarus, 168, 344
Jacobson, M. C., Hansson, H. C., Noone, K. J., & Charlson, R. J. 2000, Reviews of Geophysics, 38, 267 Jones, A. P. 2012, A&A, 540, A2
Kasting, J. F. 1993, Science, 259, 920
Krissansen-Totton, J., Olson, S., & Catling, D. C. 2018, Science Advances, 4, eaao5747
Lavvas, P., & Koskinen, T. 2017, ArXiv e-prints, arXiv:1708.09257
Lavvas, P., Yelle, R. V., Koskinen, T., et al. 2013, Proceedings of the National Academy of Sciences, 110, 2729
Linsky, J. 2014, Challenges, 5, 351
Madhusudhan, N., Ag´undez, M., Moses, J. I., & Hu, Y. 2016, SSRv, 205, 285
Mahjoub, A., Carrasco, N., Dahoo, P.-R., et al. 2012, Icarus, 221, 670
Markwardt, C. B. 2009, Proc. Astronomical Data Analysis Software and Systems XVIII, 411, 251
Marley, M. S., Ackerman, A. S., Cuzzi, J. N., & Kitzmann, D. 2013, Clouds and Hazes in Exoplanet Atmospheres (Mackwell, S. J. and Simon-Miller, A. A. and Harder, J. W. and Bullock, M. A.), 367–391
McKay, C. P., Coustenis, A., Samuelson, R. E., et al. 2001, Planet. Space Sci., 49, 79
Mutsukura, N. 1999, Thin Solid Films, 349, 115 Palmer, M. H., Ridley, T., Hoffmann, S. V., et al. 2015,
JChPh, 142, 134302
Pavlov, A. A., Brown, L. L., & Kasting, J. F. 2001, J. Geophys. Res., 106, 23267
Robertson, J., & O’Reilly, E. P. 1987, PhRvB, 35, 2946 Sciamma-O’Brien, E., Dahoo, P.-R., Hadamcik, E., et al.
2012, Icarus, 218, 356
Swain, M. R., Vasisht, G., & Tinetti, G. 2008, Nature, 452, 329
Swain, M. R., Vasisht, G., Tinetti, G., et al. 2009a, ApJL, 690, L114
Swain, M. R., Tinetti, G., Vasisht, G., et al. 2009b, ApJ, 704, 1616
Szopa, C., Cernogora, G., Boufendi, L., Correia, J. J., & Coll, P. 2006, Planetary and Space Science, 54, 394 Tannenbaum, E., Coffin, E. M., & Harrison, A. J. 1953,
JChPh, 21, 311
Tauc, J., Grigorovici, R., & Vancu, A. 1966, Physica Status Solidi B-basic Solid State Physics, 15, 627
Tinetti, G., Drossart, P., Eccleston, P., et al. 2016, in Proc. SPIE, Vol. 9904, Space Telescopes and
Instrumentation 2016: Optical, Infrared, and Millimeter Wave, 99041X
Trainer, M. G., Pavlov, A. A., Dewitt, H. L., et al. 2006, Proceedings of the National Academy of Science, 103, 18035
Urbach, F. 1953, Physical Review, 92, 1324 Venot, O., H´ebrard, E., Ag´undez, M., Decin, L., &
Bounaceur, R. 2015, A&A, 577, A33
Venot, O., B´enilan, Y., Fray, N., et al. 2017, ArXiv e-prints, arXiv:1709.08415
von Paris, P., Rauer, H., Lee Grenfell, J., et al. 2008, Planetary and Space Science, 56, 1244
Wilson, E. H., & Atreya, S. K. 2004, Journal of Geophysical Research (Planets), 109, E06002 Wolf, E. T., & Toon, O. B. 2010, Science, 328, 1266 Workman, J. 2016, Concise Handbook Of Analytical
Spectroscopy, The: Theory, Applications, And Reference Materials (In 5 Volumes) (World Scientific Publishing Company)
![[PDF] Cours ALM avancé : Gestion du risque structurel | Formation informatique](data:image/gif;base64,R0lGODlhAQABAIAAAP///wAAACH5BAEAAAAALAAAAAABAAEAAAICRAEAOw==)