HAL Id: hal-00304625
https://hal.archives-ouvertes.fr/hal-00304625
Submitted on 1 Jan 2001HAL is a multi-disciplinary open access archive for the deposit and dissemination of sci-entific research documents, whether they are pub-lished or not. The documents may come from teaching and research institutions in France or abroad, or from public or private research centers.
L’archive ouverte pluridisciplinaire HAL, est destinée au dépôt et à la diffusion de documents scientifiques de niveau recherche, publiés ou non, émanant des établissements d’enseignement et de recherche français ou étrangers, des laboratoires publics ou privés.
Land use influences on acidification and recovery of
freshwaters in Galloway, south-west Scotland
R. C. Helliwell, R. C. Ferrier, L. Johnston, J. Goodwin, R. Doughty
To cite this version:
R. C. Helliwell, R. C. Ferrier, L. Johnston, J. Goodwin, R. Doughty. Land use influences on acidi-fication and recovery of freshwaters in Galloway, south-west Scotland. Hydrology and Earth System Sciences Discussions, European Geosciences Union, 2001, 5 (3), pp.451-458. �hal-00304625�
Land use influences on acidification and recovery of freshwaters
in Galloway, south-west Scotland
R.C. Helliwell
1,R.C. Ferrier
1, L. Johnston
1, J. Goodwin
2and R. Doughty
21 Macaulay Institute, Craigiebuckler, Aberdeen, AB15 8QH, UK
2 SEPA WEST, 5 Redwood Crescent, Peel Park, East Kilbride, G74 5PP, UK
Email for corresponding author: r.helliwell@macaulay.ac.uk
Abstract
The long term response of surface waters to changes in sulphur deposition and afforestation is investigated for three upland river systems in the Galloway region of south-west Scotland. From 1984-1999, these rivers exhibited a statistically significant decline in non-marine sulphate concentrations in response to reduced acid deposition. This reduction in non-marine sulphate was, however, insufficient to induce a pH recovery over the period. A statistically significant increase in river pH was observed between 1956-1970 (0.05 yr-1) when subsidised agricultural
lime payments were at a maximum. In 1976, this subsidy ceased and surface waters have progressively acidified. In addition, climatic change is found to influence long-term trends in pH. Mean annual pH was greatest during a dry period between 1969-1973 when total annual discharge was low. Thereafter, pH declined gradually in response to higher rainfall and increased total annual discharge. Overall, surface waters draining the afforested catchments of the Rivers Cree and Bladnoch are more acid than those draining the moorland catchment of the Luce. These results indicate that in afforested catchments, current reductions in sulphur emissions have not led to an observed improvement in the acid status of surface waters. Forestry, therefore, represents a confounding factor with regard to chemical recovery from acidification in this region.
Keywords: acidification, afforestation, deposition, rivers, lochs, non-marine sulphate, pH
Introduction
Historically, acid deposition has resulted in ecological damage and poor surface water quality in some of the most natural and least disturbed sites in the UK (Battarbee and Charles, 1994). Emissions of acidifying compounds to the atmosphere increased steadily from the beginning of the industrial revolution and peaked in the late 1970s (RGAR, 1997). Recently, with the adoption of stringent protocols
that aim to curtail emissions of oxidised sulphur (SOx),
oxidised nitrogen (NOx) and reduced nitrogen (NHy), levels
of acid deposition have generally declined (Jenkins et al., 1998). Monitoring the response of surface water chemistry to costly emission reduction programmes is important, as such strategies are partly based on the assumption that improvements in water quality will result (Soulsby et al., 1995). Recent evidence on the reversibility of surface water acidification in acid sensitive areas in Europe is ambiguous: some areas have shown improvement in water quality (Evans
and Jenkins, 2000; Tipping et al., 1998; Harriman et al., 1995) whilst other areas show little or no change (Alewell
et al., 2001). The degree of reversibility is related to regional
differences in deposition inputs, catchment physico-chemical characteristics and land use change. In particular, land use change has been recognised as a major confounding factor in terms of restoring surface waters to good ecological/ chemical status. A considerable amount of work has been carried out to identify the effects of conifer plantations on surface water acidification over the last two decades. Much of this work in the UK has been undertaken in Galloway, a region where large-scale afforestation, high levels of deposition and predominantly acid sensitive soils and geology contribute to a highly acid sensitive environment (Wright et al., 1994; Rees and Ribbens, 1995; Lees, 1995; Puhr et al., 2000). Increased acidity of soils and surface waters in forested catchments has been associated with enhanced levels of dry and occult deposition captured by
R.C. Helliwell, R.C. Ferrier, L. Johnston, J. Goodwin and R. Doughty
forest stands, alterations in soil hydrology and direct physical disturbance of the soil structure during ploughing prior to planting (Miller, 1985). It is well documented that young trees have a high demand on the soil base cation pool and this process can also enhance surface water acidification (Reynolds et al., 1994; Miller, 1985). Long term modelling studies of afforestation impacts on soil and stream acidification confirm this view (Jenkins et al., 1990a). Forest dynamics, therefore, play an important role in the acidification/recovery of surface waters.
In the present study, long-term hydrochemical analyses from the upper reaches of three rivers, the Cree, Bladnoch and Luce, are discussed. The response of surface waters to changes in sulphur (S) deposition and land use is investigated.
Study area and methods
GENERAL REGIONAL DESCRIPTION
The Galloway region of south-western Scotland is an acid sensitive environment. The highly siliceous granitic bedrock covered by thin, patchy, organic rich and generally acidic soils, offers only limited ability to neutralise acid inputs from the atmosphere (Wright et al., 1994). This region receives an annual average rainfall exceeding 2000 mm. Bedrock
geology is characterised by Paleozoic (mainly Silurian) sedimentary rocks (shale, slate, greywacke, sandstone and conglomerate) into which granitic plutons are intruded (Daysh, 1974). These geological formations have a low capacity to buffer external acid inputs and, as a consequence, the soils are naturally acid (Edmunds and Kinniburgh, 1986). Although small areas of rough and improved grassland occur to the south and west of the region, a considerable part of this region is covered with coniferous forest. Large-scale commercial afforestation increased dramatically during
the mid 20th century with the total area of conifer woodland
under Forestry Commission ownership increasing from
c.6581 ha in 1940–1950 to c.93 842 ha in 1971-80 (Forestry
Commission, 1999). The total area of forest (including woodland owned by or leased to the Forestry Commission and forest under private ownership) is 170 848 ha, this represents 27% of the land area in this region. Afforestation has been almost exclusively with non-native conifers such as Sitka spruce (Picea sitchensis) and lodgepole pine (Pinus
contorta).
DESCRIPTION OF THE RIVER CREE, BLADNOCH AND LUCE SUB-CATCHMENTS
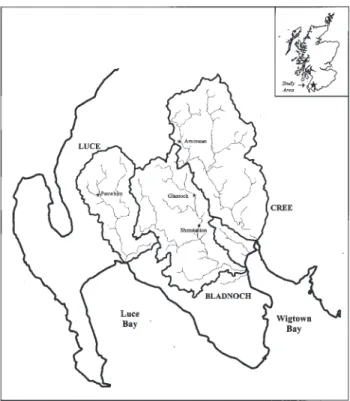
Soil and land use information for the sub-catchments included in this study were extracted from the digital soil map of Scotland (1:250,000) and the Land Cover of Scotland 1988. Collectively, the Rivers Luce, Cree and Bladnoch
drain an area of 1102 km2 from the Galloway uplands to the
Solway Firth (Fig. 1). The drainage areas of the head-water
rivers included in this analysis are 62 km2 (Cree at
Arnimean), 54 km2 (Bladnoch at Glassoch) and 32 km2
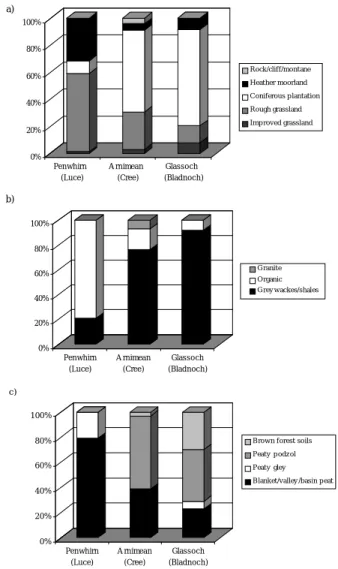
(Luce at Penwhirn). The Cree and Bladnoch sub-catchments are dominated by coniferous plantations (80% and 71%, respectively), the remaining area is comprised of rough grassland and heather moorland (Fig. 2a). These sub-catchments were afforested during the 1950s, 60s and 70s. Since the 1980s, more forest has been planted although there is now significant felling as much of the first plantings reach maturity (Forestry Commission, 1999). The soils in the Cree and Bladnoch sub-catchments are mineral in nature and derived from greywackes and shales (Ettrick association) (Fig. 2b), although, 7% of the Cree sub-catchment is composed of soils derived from granite (Dalbeattie association). Reference is also made to longer-term historical datasets from Shennanton, a sampling site down river from Glassoch (River Bladnoch). A large part of the Shennanton sub-catchment comprises coniferous forest (60%) and rough grassland (23%). Peat, brown forest soil and peaty podzols derived from greywackes and shales are the major soils types in the Bladnoch catchment. In contrast, the Penwhirn
sub-Fig. 1. Map showing the River Cree, Bladnoch, and Luce catchment boundaries and sample sites
catchment is dominated by blanket peat (80%), with a small area of peaty gleyed soil derived from greywackes and shales (Ettrick association) surrounding the lower river channel (Fig. 2b and c). A large area of the catchment comprises rough grassland and heather moorland (89%), only 9% of the Penwhirn sub-catchment is afforested (Fig. 2a).
Long-term monitoring data for analysis of temporal trends were obtained from the Scottish Environment Protection Agency (SEPA West region). A sampling programme was established in 1955 on the River Cree at Arnimean and the River Bladnoch at Shennanton. These sites were sampled at six-weekly intervals. This sampling programme was reviewed in 1963 to provide increased coverage of the main river tributaries on the River Cree and the sampling frequency was increased to monthly intervals. In 1980, samples were collected on a monthly to quarterly basis. It was during this year that sampling of the River Bladnoch
began at Glassoch. Records of chloride (Cl), nitrate (NO3),
gran alkalinity and pH began in 1956, whilst total aluminium
(Al) and sulphate (SO4) were not included in routine analysis
until 1984. Base cation data are very irregular in terms of the length of the records and completeness. Analysis was conducted using standard procedures adopted by SEPA (HMSO, 1980). Flow on the River Cree was recorded at Newton Stewart (NS 412 653).
A comparison of mean annual (1984–1999) surface water pH (derived from mean H concentration, Table 1) shows that samples collected from the River Cree (pH 5.4) and the River Bladnoch (pH 5.7) are more acid than the River Luce (pH 6.0). Alkalinity measurements replicate this pattern with the lowest mean data recorded at the River Cree
(88 µeq l-1), and the highest at the least acid site, the River
Luce (259 µeq l-1).
The non-marine component of SO4 (SO4*) was determined
by:
SO4* = SO4 – (R*Cl)
where R is the ratio of that ion to Cl in seawater (0.104 for
SO4 where concentrations are in µeq l-1). The highest mean
annual concentrations of SO4* and NO3 for 1984-1999 were
recorded for the River Bladnoch (76 µeq l-1 and 12 µeq l-1
,
respectively). Non-marine SO4 concentrations measured at
the River Luce were slightly lower than the concentrations in the Cree and Bladnoch, with a mean concentration of
54 µeq l-1 for 1984-1999. Surface water Cl concentrations
are high, and range from 336 µeq l-1 at the River Cree to
384 µeq l-1 at the River Bladnoch, reflecting the close
proximity of these river systems to the coast.
Statistical analysis
A multiple regression model was fitted to the data (El-Shaarawi et al., 1983): i t t t i i i i y =α+β1365+β2 sin(2π 365)+β3cos(2π365)+ε Table 1. Mean annual chemistry from Rivers Cree,
Bladnoch, and Luce (1984-1999). All values in µeq l-1 except
pH. pH SO4 SO4* NO3 Cl Alkalinity Cree at 5.4 104 69 8 336 88 Arnimean Bladnoch at 5.7 115 76 12 384 132 Glassoch Luce at 6.0 94 54 3 340 259 Penwhirn
Fig. 2. Proportion of: (a) vegetation classes, (b) geology, and (c) soil types in the River Cree, Bladnoch and Luce sub-catchments.
a) 0% 20% 40% 60% 80% 100% Pen wh irn (Lu ce) A rn imea n (Cree ) Glas s o ch (Blad n o c h ) R ock/cliff/mont ane H eat her moorland C oniferous p lant at ion R ough grass land Imp roved grass land
b) 0% 20% 40% 60% 80% 100% Pen wh irn (Lu ce) A rn imea n (Cree ) Glas s o ch (Blad n o c h ) G ranit e O rganic G rey w ackes/s hales
c) 0% 20% 40% 60% 80% 100% Pen wh irn (Lu ce) A rn imea n (Cree ) Glas s o ch (Blad n o c h )
B row n forest soils P eat y p odz ol P eat y gley B lanket /valley /bas in p eat
R.C. Helliwell, R.C. Ferrier, L. Johnston, J. Goodwin and R. Doughty
where y is the response variable and t is the date expressed as the number of days from the start of the study. This model involves an annual cycle and a linear trend. A test was carried
out to determine whether the trend b1 is significantly
different from zero.
This parametric method was chosen because fitting a smooth seasonal component is more realistic than treating seasons as blocks. In addition, unequal spacing between observations does not present a problem as the day of observation is incorporated directly into the model. A similar approach was used by El-Shaarawi et al. (1983). A simple linear regression model was used to test the relationship between selected chemical determinands included in this study.
Results: Trend analysis
DEPOSITION CHEMISTRY
A long-term perspective of wet deposition was obtained from a collector at Eskdalemuir, south-west Scotland (NT 234 028). The data presented in Ferrier et al. (2001) show a
non-uniform decrease in SO4* with relatively high
concentrations recorded in the late 1970s, followed by a
sharp decline from 52 µeq l-1 to 29 µeq l-1 between 1980–
1987. Mean annual decline in SO4* for the entire deposition
record at Eskdalemuir (1973-1995) is 2.1 µeq l-1yr-1. The
total decline in SO4* in 1984–1995 was 18%. Concentrations
of calcium (Ca), magnesium (Mg), NO3 and ammonium
(NH4) in wet deposition at Eskdalemuir have remained
approximately constant from the early 1980s to 1998.
COMPARISON OF HYDROCHEMICAL TRENDS FROM THE RIVERS CREE, BLADNOCH AND LUCE
Results from the regression analysis for linear trend and annual cycle representing 1984-1999 are shown in Table 2.
River Cree at Arnimean
Significant trends were observed in the River Cree for SO4,
SO4*, Cl, and Al (Table 2). At this site there has been a
pronounced and highly significant decline in SO4* of an
estimated 20 µeq l-1 over the reported 15 years
(–1.34 µeq l-1 yr-1). This is in accordance with observed
decreases in total deposition of S. As expected, a decline in
total Al was observed with the decline in SO4*.. In this
instance the decline in surface water SO4*is associated with
a decline in base cations and Al appears to have decreased rather than H. In this regard changes in deposition were sufficient to result in a general improvement in water
chemistry but not for pH improvement. This may be due in part to continued afforestation in this area (Fig. 3) and possibly an increase in organic acids associated with rising Dissolve Organic Carbon (DOC). There are, however, no observational data available, but similar trends have been identified in the Galloway region (Harriman et al., 2001).
River Bladnoch at Glassoch
Surface water trends observed in the River Bladnoch are
similar to those in the River Cree, where SO4
(–3.08 µeq l-1yr-1) and SO
4*(–2.32 µeq l
-1yr-1) have
decreased significantly throughout the record. Of the three head water tributaries, the River Bladnoch exhibits the
strongest declining trend in SO4*, an estimated overall
decrease of 35 µeq l-1 since 1984. In addition, the statistically
significant increase in alkalinity (18.62 µeq l-1yr-1) has been
accompanied by a significant decrease in Al of 119 µM l-1
over 15 years (–7.94 µM l-1 yr-1). This result should be
interpreted with caution, particularly as the alkalinity dataset is limited to 12 data points distributed throughout the reporting period. In contrast to trends identified in the Rivers
Cree and Luce (which have lower concentrations of NO3),
a seasonal NO3 cycle can be identified in the River Bladnoch
data where samples collected during the winter months have
higher concentrations of NO3 compared to summer.
Nonetheless, the long-term NO3 trend is not statistically
significant (–0.32 µeq l-1 yr-1). Rather unexpectedly, a small
and statistically insignificant decline in pH was observed
between 1984–1999 (–0.01 yr-1), this trend was also evident
Table 2. Annual trends in water chemistry based on linear
analysis incorporating a seasonal cycle (1984-1999). All
trend estimates in µeql-1yr-1 except pH (pH yr-1). Total Al
(µM yr-1). *, ** and *** denotes trends significant at 0.05,
0.01, 0.001 levels, respectively.
River Cree River River Luce
at Bladnoch at
Arnimean at Glassoch Penwhirn Burn
pH -0.00 -0.01 0.01 Na 0.31 -1.30 2.67 K 0.17 [No data] -0.16 SO4 -4.11*** -3.08** -0.98 SO4* -1.34*** -2.32** -0.02 NO3 -0.19 -0.32 0.18 Cl -4.51** -6.10 -3.12 Total Al -0.09*** -7.94*** -11.63** Alkalinity No data 18.62** 18.86*
during the same period in the River Cree. Insufficient hydrochemical data from these sites make further interpretation difficult, however, this trend should not be dismissed.
River Luce at Penwhirn
Trend analysis from the River Luce reveals very different results to those observed in the Rivers Cree and Bladnoch. Regression analysis shows a slight improvement in surface
water pH but this is not statistically significant (0.007 yr-1).
The clear decline in total S deposition (Ferrier et al., 2001) has resulted in a small decrease in stream concentrations of
SO4*, but this decline is not significant at the 5% level (Table
2). Compared with the afforested sub-catchments of the Rivers Cree and Bladnoch, the magnitude of the response to reduced deposition inputs is considerably smaller. Total Al has clearly declined over the 15 year period
(–11.63 µM l-1yr-1) and, as a consequence, a significant
increase in the alkalinity trend is observed (18.86 µeq
l-1yr-1). An inverse and highly significant relationship is
observed between total Al and alkalinity (r2=0.69**,
y = –0.5625x + 311.29) throughout 1984–1999.
LONGER TERM TRENDS IN SURFACE WATER PH
Historical records of surface water pH are limited to two sites in this study: records began in 1956 for the River Cree at Arnimean and in 1964 for the River Bladnoch at Shennanton. These data reveal very different trends in surface water acidity compared with the shorter record (1984-1999) described previously (Fig. 4). Calcium, Al, and
SO4 were not included in routine analysis until the mid 1980s
and in this regard, the long-term analysis is restricted to surface water pH.
Through detailed analysis of surface water chemistry from
Fig. 3. Area of broadleaves and conifers in the Galloway region by planting year class (Source: Forestry Commission, 1999)
Fig. 4. UK agricultural lime use and river pH from the Cree at Arnimean and Bladnoch at Shennanton (Source of subsidy information: BACMI (1983))
R.C. Helliwell, R.C. Ferrier, L. Johnston, J. Goodwin and R. Doughty
the Cree, it is apparent that pH increased significantly from
1956–1970 (0.05 yr-1). A similar increase in pH was evident
at Bladnoch (1964–1970), although the increase was not
statistically significant (0.07 yr-1). From the mid 1970s,
evidence points to a decline in surface water pH for both the Cree and Bladnoch (Fig. 4). The total decline in pH measured at the Cree and Bladnoch from 1976-2000 was 0.76 and 0.64, respectively. Statistical analysis of the entire dataset from the Cree (1956–2000) and Bladnoch (1964– 2000) show the long term trend in pH is declining
(–0.02 yr-1 and –0.03 yr-1, respectively).
There is a strong relationship between pH and annual climatic variability. The relationship between river flow at Newton Stewart (downstream gauging station on the River Cree) and pH is presented in Fig. 5. Low annual total discharge records during 1969–1973 coincide with a period when pH > 6. Since 1973 total annual discharge has increased resulting in a gradual decline in surface water pH.
Discussion
This analysis focuses on data supplied by SEPA whose databases provide the best record of long term change. These hydrochemical records are more extensive and the temporal resolution of these data is generally higher than most databases currently available in the UK. Although this data is useful for assessing long term trends in surface water chemistry, there are limitations that need to be taken into account when interpreting the results. These datasets include parameters that generally focus on potential pollutants which
are related to discharge consents for industrial, agricultural and urban discharges. Consequently, there is a paucity of data relating to some of the main ionic species found naturally in river waters, especially the major weathering related cations. In addition to the limited range of parameters monitored, long-term analysis of trends is hindered by large gaps in the datasets at some sites, and limited information regarding analytical and quality procedures. Nonetheless, without these long term data, important historical changes in surface water acidity would not have been detected in the River Bladnoch at Shennanton and the River Cree at Arnimean.
In addition, small upland catchments were selected for monitoring primarily because the soils and waters draining these upland areas are generally more responsive to changes in atmospheric deposition and afforestation. In this regard, the higher drainage densities and steeper topography of this upland study area reduce the amount of time before runoff enters the stream network and consequently the time for potential soil buffering processes within the catchment.
This study demonstrates that surface water draining afforested catchments of the Cree and the Bladnoch are inherently more acid than those draining the moorland catchment of the Luce. Overall, the results corroborate findings from other studies conducted in this region (Puhr
et al., 2000; Rees and Ribbons; 1995; Wright et al., 1994).
The statistically significant decrease in surface water
concentrations of SO4* and total Al in the upper reaches of
the Rivers Cree and Bladnoch during 1984–1999 was insufficient to induce a recovery in pH at these afforested
Fig. 5. Relationship between total annual flow and pH between 1966-2000
catchments. This indicates that extensive forestry in these catchments plays an important role in exacerbating deposition of acid pollutants such as S, through increased dry deposition (Fowler et al., 1989) and occult deposition (Dollard et al., 1983). These results suggest that in the heavily afforested sub-catchments, current reductions in S emissions do not lead to an observed improvement in the acid status of these rivers. Compared to the Cree and Bladnoch catchments, total S inputs at the Luce catchment, a predominantly moorland catchment, are small and as a consequence, the impact of S emission reductions on surface water quality are less apparent (Table 2). Nitrate concentrations in the River Luce are consistently lower than in the Rivers Cree and Bladnoch, a response to lower deposition inputs and the potential retention of N by the extensive area of peat in this catchment (Helliwell et al., 2001). As forests mature and uptake rates decline, greater N leaching to surface waters has been observed (Reynolds
et al., 1994). In this study, however, the forest age in the
Cree and Bladnoch sub-catchments is known to range from 30–50 years old and yet there is no evidence of increasing
NO3 concentrations in the surface waters.
In terms of assessing land use influences on surface water chemistry, the Luce catchment can be regarded as a control. Much of the catchment drains peat-covered hills and moorland overlying slow weathering Ordovician sediments and, as a consequence, the water draining these organic soils
are naturally enriched in Hand organically complexed Al.
Historical data from the mid 1950s to 1970 show an improvement in surface water pH in the River Cree at Arnimean. These findings contradict other studies that show an increase in surface water acidification in response to peak S emissions in the 1970s and large-scale commercial afforestation in the region (Wright et al., 1994; Puhr et al., 2000). Improvements in surface water pH during this time may be linked to the introduction of a UK subsidy on agricultural lime in the late 1930s. Although lime was not applied directly to forest soils, large areas of grassland/ moorland soils were limed during the 1940s to early 1960s. The application rate of lime used in agricultural production increased by as much as 14 times pre-war levels (BACMI, 1983). Whilst the area of forestry has expanded in this region during the 1970s and 1990s (Fig. 3) it is likely that a considerable part of this limed area is now afforested. Figure 4 shows an improvement in pH for the Cree and the Bladnoch when subsidised agricultural lime payments were at a maximum. In 1976, the subsidy on agricultural lime ceased (except were it is payable under other schemes such as the Farm or Horticulture Development schemes) and surface waters have progressively acidified. It is possible that this decline in pH may, in part, be a consequence of the
reduction in lime application; however, the degree of recovery may be hindered by intensive forestry practices.
Lime additions to expansive areas of upland Britain were
common practice in the first half of the 20th century. In this
regard, trend analysis on data from other upland areas in Britain, that are restricted to more recent data sets, should be interpreted with caution. In addition, these results raise important questions regarding the rate of acidification or recovery in systems that received no lime additions in the past. Even though the catchments described may have been limed in the past, recent analyses of hydrochemical data indicate that the rivers in Galloway remain acid.
It is also noteworthy that mean annual pH measurements were greatest during 1969-1973 when the total annual discharge was low. It is well documented that groundwater dominated low flows are characterised by high pH and alkalinity. Following 1973, pH gradually declined in response to higher rainfall and increased annual total discharge. Under these conditions, as flow increases, a mixing of soil drainage waters occurs which results in a reduction in pH and alkalinity (Jenkins et al., 1990b).
Conclusions
The first, and perhaps most significant, finding of this study
is that surface water concentrations of SO4* have declined
from 1984-1999 throughout the Galloway region. The SO4*
trend was highly significant in the Rivers Cree (–1.34 µeq
l-1 yr-1) and Bladnoch (–2.32 µeq l-1 yr-1) but not statistically
significant in the River Luce (–0.016 µeq l-1 yr-1). This
decline in surface water SO4* is consistent with reductions
in S deposition.
Afforestation was found to have a deleterious impact on surface water chemistry. Compared to the River Luce (moorland catchment), that has a mean annual (1984–1999) surface water pH of 6.03, the afforested catchments of the Rivers Cree and Bladnoch are more acid (pH 5.39 and 5.72, respectively).
Historical trends (1950–1970s) in surface water pH appear to be influenced by the large-scale application of lime to areas of rough grassland. Lime additions at this time were sufficient to offset surface water acidification as shown by the recovery in pH during this period (Fig. 4). Without lime addition in this region it is likely that the extensive afforestation and increasing levels of acid deposition at this time would have led to more acidic surface water conditions. This finding has important implications in terms of land preparation prior to future afforestation initiatives.
There is currently an increased awareness of the importance of long term datasets in assessing the response of surface water chemistry to environmental change. These
R.C. Helliwell, R.C. Ferrier, L. Johnston, J. Goodwin and R. Doughty
analyses contribute to the understanding and detection of the impacts of changes in deposition and land use practices on freshwater ecosystems.
Acknowledgements
This project was financially supported by the Commission of the European Communities RECOVER:2010 project (EVK1-CT-1999-00018) and the Scottish Executive Environment and Rural Affairs Department (SEERAD). The authors are grateful to J. Potts from BioSS for advice on trend statistics. Thanks is also due to W. Halcrow (Director of Operations), G. Burns (Environmental Assessment Manager), B. Eriksen (Senior Hydrologist) and D.J. Pirie (Chemistry Services Manager) from the Scottish Environment Protection Agency.
The views expressed herein are those of the authors and do not necessarily reflect those of the Scottish Environment Protection Agency.
References
Alewell, C., Armbruster, M., Bittersohl, J., Evans, C.D., Meeseburg, H., Moritz, K. and Prechtel, A., 2001. Are there signs of acidification reversal in freshwaters of the low mountain ranges in Germany? Hydrol. Earth Syst. Sci., 5, 367–378. BACMI, 1983. Lime in Agriculture. The Agricultural Lime
Producers Council. Second Revised Edition, 12 pp.
Battarbee, R.W. and Charles, D.F., 1994. Lake acidification and the role of paleolimnology. In: Acidification of freshwater
ecosystems: implications for the future, E.W. Steinberg and R.F.
Wright (Eds.), 51–65. Wiley, Chichester, UK.
Daysh, G.H.J., 1974. Geology. In: Galloway Forest Park. Forestry
Commission Guide, H.L. Edlin (Ed.), 24–27. Her Majesty’s
Stationery Office, Edinburgh.
Dollard G.J., Unsworth, M.H. and Harve, M.J., 1983. Pollutant transfer in upland regions by occult precipitation. Nature, 302, 241–243.
Edmunds, W.M. and Kinniburgh, D.G., 1986. The susceptibility of UK groundwaters to acidic deposition. J. Geol. Soc., 143, 707–720.
El-Shaarawi, A.H., Esterby, S.R. and Kuntz, K.W., 1983. A statistical evaluation of trends in water quality of the Niagara River. J. Great Lakes Res., 9, 234–240.
Evans, C.D. and Jenkins, A., 2000. Surface water acidification in the South Pennines. II. Temporal trends. Environ. Pollut., 109, 21–34.
Ferrier, R.C., Helliwell, R.C., Cosby, B.J., Jenkins, A. and Wright, R.F., 2001. Recovery from acidification of lochs in Galloway, south-west Scotland, UK: 1979-1998. Hydrol. Earth Syst. Sci., 5, 421–431.
Forestry Commission, 1999. Inventory report. National Inventory of Woodland and Trees. Scotland-Dumfries and Galloway region. Part 1 - Woodlands of two hectares and over. Woodlands Survey, Forest Research, 5–12.
Fowler, D., Cape, J.N., Leith, I.D., Choularton, T.W., Gay, M.J. and Jones, A., 1989. The influence of altitude on rainfall composition at Great Dun Fell. Atmos. Environ., 22, 1355–1362.
Harriman, R., Morrison, B.R.S., Birks, H.J.B., Christie, A.E.G., Collen, P. and Watt A.W. 1995. Long term chemical and biological trends in Scottish streams and lochs. Water Air Soil
Pollut., 85, 701–706.
Harriman, R., Watt, A.W., Christie, A.E.G., Collen, P., Moore, D.W., McCartney, A.G., Taylor, E.M. and Watson, J., 2001. Interpretation of trends in acidic deposition and surface waters chemistry in Scotland during the past three decades. Hydrol.
Earth Syst. Sci., 5, 407–420.
Helliwell, R.C., Ferrier, R.C. and Kernan, M.R., 2001. Interaction of nitrogen deposition and land use on soil and water quality in Scotland: issues of spatial variability and scale. Sci. Total
Environ., 265, 51–63.
HMSO, 1980. Methods for the determination of Waters and
Associated Materials. London.
Jenkins, A., Cosby, B.J., Ferrier, R.C., Walker, T.A.B. and Miller, J.D., 1990a. Modelling stream acidification in afforested catchments: an assessment of the relative effects of acid deposition and afforestation. J. Hydrol., 120, 163–181. Jenkins, A., Harriman, R. and Tuck, S.J., 1990b. Integrated
hydrochemical responses on the catchment scale. In: The Surface
Water Acidification Programme, B.J. Mason (Ed.), 47–55.
Cambridge University Press.
Jenkins, A., Helliwell, R.C., Swingewood, P.J., Sefton, C., Renshaw, M. and Ferrier, R.C., 1998. Will reduced sulphur emissions under the Second Sulphur Protocol lead to recovery of acid sensitive sites in UK? Environ. Pollut., 99, 309–318. Lees, F.M., 1995. Have emission reductions led to improvements
in water quality at Loch Dee in Galloway. Water Air Soil Pollut., 85, 695–700.
Miller, H.G., 1985. The possible role of forests in streamwater acidification. Soil Use Manage., 1, 28–29.
Puhr, C.B., Donoghue, D.N.M., Stephen, A.B., Tervet, D.J. and Sinclair, C., 2000. Regional patterns of stream water acidity and catchment afforestation in Galloway, SW Scotland. Water
Air Soil Pollut., 120, 47–70.
Rees, R.M. and Ribbens, J.C.H., 1995. Relationships between afforestation, water chemistry and fish stocks in an upland catchment in south-west Scotland. Water Soil Air Pollut., 85, 303–308.
Reynolds, B., Ormerod, S.J. and Gee, A.S., 1994. Spatial patterns in stream nitrate concentrations in upland Wales in relation to catchment forest cover and forest age. Environ. Pollut., 84, 27– 33.
RGAR (Review Group on Acid Rain), 1997. Acid deposition in
the United Kingdom 1992-1994. Fourth Report of the Review
Group of Acid Rain. Report produced for the Department of the Environment, Transport and the Regions, AEA Technology Plc, 6 pp.
Soulsby, C., Turnbull, D., Langan, S.J., Owen, R. and Hirst, D., 1995. Long-term trends in stream water and biology in north-east Scotland: Evidence for recovery. Water Air Soil Pollut., 85, 689–694.
Tipping, E., Carrick, T.R., Hurley, M.A., James, J.B., Lawlor, A.J., Lofts, S., Rigg, E., Sutcliffe, D.W. and Woof, C., 1998. Reversal of acidification in upland waters of the lake district. Environ.
Pollut., 103, 143–151.
Wright, R.F., Cosby, B.J., Ferrier, R.C., Jenkins, A., Bulger, A.J. and Harriman, R., 1994. Changes in acidification of lochs in Galloway, southwestern Scotland, 1979-1988: The MAGIC model used to evaluate the role of afforestation, calculate critical loads, and predict fish status. J. Hydrol., 161, 257–285.