EFFECT OF CRACKS ON ELASTIC PROPERTIES OF LOW POROSITY
ROCKS
by
TERRENCE PATRICK TODD
B.S. UNIVERSITY OF TORONTO (1969)
SUBMITTED IN PARTIAL
FULFILLMENT OF THE REQUIREMENTS FOR THE
DEGREE OF DOCTOR OF PHILOSOPHY
at the
MASSACHUSETTS INSTITUTE OF TECHNOLOGY JUNE, 1973
Signature of Author...,...
Department of Earth ?A4 Planetfry~$iences, May 1, 1973 Certified by...
/ ,/Thesis Supervisor Accepted by ...
Chairman, Departmental Committee on Graduate Students
WIT"
Effect of Cracks on Elastic Properties of Low Porosity
Rocks by
Terrence Patrick Todd
Submitted to the Department of Earth and Planetary Sciences on May 1, 1973, in partial
fulfillment of the requirements for the degree of Doctor of Philosophy
Microcracks in terrestrial and lunar rocks significantly alter elastic, thermal, and mechanical properties. The
degree to which microcracks alter physical properties of low porosity rocks depends on the state of stress in the rock (hydrostatic pressure, non-uniform stress, pore pressure), the magnitude of various crack parameters
(directional distribution, volume, aspect ratio, connectib-ility, etc.), the per cent saturation, and the physical properties -of-pore fluids.
Various techniques have been employed to study, both
qualitatively and quantitatively, the effect of cracks on the elastic properties of low porosity rocks. Elastic wave
velocities and static compressibility, measured as functions of direction, indicate the presence of anisotropy, determine
symmetry patterns of non-uniform crack or mineral distributions, and separate mineral from crack anisotropy. Elastic properties measured under hydrostatic confining pressure illustrate
crack closure effects. Crack counting from thin section, or photomicrographs of thin sections, give crack parameters and
directional information about cracks. Staining cracks with dyes facilitates the observation of cracks in thin
section. Some crack parameters (e.g. the distribution
function of crack aspect ratios) are calculated directly from theoretical expressions which present the particular parameter in terms of elastic property values. Other crack parameters
(e.g. crack porosity) are measured directly. Acoustic emission techniques give direct information about crack closure, crack formation, phase transitions, twinning, and other stress release mechanisms in rocks.
Different values of crack parameters are produced by different cracking mechanisms. Cracks produced by natural igneous processes or by thermal cycling are low aspect ratio cracks present along grain boundaries and within individual grains. Cracks produced by shock processes are higher aspect ratio cracks. In particular, lunar rocks have cracks
characteristic of those produced by shock processes. Thesis Supervisor: Gene Simmons
3 TABLE OF CONTENTS page Abstract 2 Table of Contents 3 Chapter 1: Introduction 4
Chapter 2: Acoustic Double Refraction in Low
Porosity Rocks 9
Chapter 3: Toward a Quantitative Relationship Between Elastic Properties and Cracks in
Low Porosity Rocks 48
Chapter 4: Unique Characterization of Lunar
Samples by Physical Properties 87
Chapter 5: Effect of Dry Cracks, Saturated Cracks, and Pore Pressure on the Elastic Properties
of Low Porosity Rocks 146
Chapter 6: Acoustic Emission 237
Acknowledgements 325
INTRODUCTION
Microcracks occur along grain boundaries and within individual grains in most low porosity rocks. The total crack porosity is generally only a few tenths of one percent of the total rock volume. But the effect of cracks on
altering elastic, thermal, and mechanical properties of
rocks is large, both in laboratory samples and in the field. To interpret the physical properties of the terrestrial and
lunar crusts, we must understand, both qualitatively and quantitatively, the effects of cracks on physical properties of low porosity rocks.
We have used several techniques to measure crack
parameters (crack volume, length, aspect ratio, orientation, etc.) and to study crack effects on physical properties.
For instance (1) elastic properties as functions of direction determine the symmetry of non-uniform crack distributions in rocks, (2) elastic properties under hydrostatic confining pressure illustrate crack closure effects, (3) crack
counting from thin sections or photomicrographs of thin sections give crack parameters and directional information about cracks, (4) staining cracks with dyes facilitates the observation of cracks in thin section, (5) theoretical expressions give some crack parameters in terms of elastic property values, (6) some crack parameters are measured directly, and (7) acoustic emission techniques determine
we implement these methods to obtain information about the effect of cracks on elastic properties of low porosity rocks.
Ahisotropy in physical properties of rocks can arise from preferred mineral oeientation, mineral layering,
non-hydrostatic stress, and anisotropy in crack distribution. The measurement of shear waves of known polarization in
different directions in rocks is one method for studying
anisotropy in rocks. In chapter 2, Acoustic Double Refraction in Low Porosity Rocks, we discuss the propagation of shear waves in low porosity rocks.
In chapter 3, Toward a Quantitative Relationship Between Elastic Properties and Cracks in Low Porosity Rocks, we
apply a technique for staining cracks and a statistical method for counting cracks to obtain the directional
distribution of total crack length in rocks. We correlate both directional variations in total crack length and
variations in the magnitude of total crack length with variations in elastic properties.
When rocks are brought from high P-T conditions at depth to surface conditions, stresses produced by the differences in linear thermal expansion and linear compressibility
between pairs of mineral grains are sufficient to crack
most rocks. Rocks containing minerals with large expansions relative to other minerals or anisotropy in expansion
stress, shock events, large thermal fluctuations, or thermal gradients crack rocks. In chapter 4, Unique Characterization of Lunar Samples by Physical Properties, we discuss various techniques for cracking rocks, and indicate what types of cracks (in terms of crack parameters) are formed by each cracking process. We apply the results specifically to cracks in lunar rocks.
A complete knowledge of crack parameters is not sufficient to determine elastic properties of cracked rocks; we must
also know the degree of saturation and the physical properties of the saturant. For instance, we must know
if cracks are filled with air or water, if the saturant is under pore pressure, if the saturant contains chemicals which will affect physical properties, if saturation in
laboratory experiments is comparable to saturation in situ, etc. In chapter 5, Effect of Dry Cracks, Saturated Cracks, and Pore Pressure on the Elastic Properties of Low Porosity Rocks, we discuss the effects of pore fluid saturants on altering physical properties of low porosity rocks.
Perhaps the most direct methods for studying crack formation, for obtaining crack magnitudes, for obtaining crack locations, or in general, for quantitizing crack information, are acoustic emission techniques. We have used acoustic emission techniques to study stress release
(crack formation, crack closure, pore collapse, and possibly phase transitions and twinning) occurring under hydrostatic
We report and interpret these data in chapter 6, Acoustic Emission.
In summary, this thesis presents several methods for studying the effects of cracks on the elastic properties of rocks. Each chapter applies one or more techniques to
a specific problem. Discussions of elastic, thermal, and mechanical effects other than those due to cracks are
integrated with the discussion of crack effects in each
chapter. To make each chapter complete in itself, descriptions of equipment and techniques, tables, figures and references are included within the individual chapter. And the major
conclusions from each chapter are summarized in an abstract at the begining of the chapter.
Chapter 2
Acoustic Double Refraction in Low Porosity Rocks
Anisotropy in physical properties of rocks can arise from preferred mineral orientation, mineral layering, non-hydrostatic stress, and anisotropic crack distribution. For instance, preferential orientation of olivine grains in dunites; alternating layers in laboratory-sized samples of such mineral pairs as olivine-feldspar, wollastonite-diopside, and garnet-pyroxene; alternating layers of basalt flows and lunar
breccias; anisotropy in crack distribution of most granites; and anisotropy in crack distribution induced by uniaxial stress - all cause acoustic double refraction. We discuss, both experimentally and theoretically, shear wave propagation in these rock types, and indicate how the laboratory data may be applied to the interpretation of the anisotropy observed in the Earth's crust and upper mantle. We discuss the
INTRODUCTION
Values of physical properties of rocks at effective pressures below a few kilobars are determined primarily by mineral content and the presence or absence of microcracks. Preferred orientation of microcracks or individual minerals causes anisotropy in physical properties. Mineral anisotropy can be caused by alignment of individual grains or layering of one or more minerals. Crack anisotropy can be naturally-occurring or artificially-induced. The phenomenon of anisotropy can be used to improve our understanding of the earth's crust and upper mantle through a study of physical properties which are sensitive to mineral orientation and crack distribution. Elastic properties (i.e. shear and compressional velocities)
which can readily be measured in situ are such physical properties. Thill et al. (1969) have shown that compressional
wave velocity is a particularly sensitive indicator of
mineral anisotropy and crack distribution in dry low porosity rocks. They found that velocities in the Yule marble were slowest parallel to a direction of distinct preferred
orientation of optic [00011 axes of calcite (the slow velocity direction in single crystal calcite) and that velocities in the Salisbury granite were lowest for a direction normal to a plane containing a dense concentration of cracks in quartz grains. However, there are certain inherent problems in the use of their data to interpret compressional velocities of rocks in situ. For instance, the compressional velocity
than the same rocks when completely dry (Nur and Simmons, 1969b). The degree of saturation in situ is generally not known, but
is probably near 100%. If saturation is complete, pore
pressure effects (Todd and Simmons, 1972) must be considered. In addition, in order to determine anisotropy with compressional waves, two perpendicular measurements of compressional velocity
are required. The two waves travel different paths, and problems arise involving compositional variations between the two propagation paths. It would be advantageous to
measure some physical property which would provide directional information without having to cope with local values of, and local variations in, percent saturation, pore pressure, and ,composition.
For a particular direction of propagation in elastically anisotropic media, there can exist a quasi longitudinal wave and two quasi shear waves. Particle motion of the three waves are perpendicular to each other and generally neither parallel nor perpendicular to the propagation direction. Although shear waves with high signal to noise ratios can readily be produced
and monitored in laboratory experiments, shear waves with
equally high signal to noise ratios are extremely difficult to obtain in the field. Shear waves, being late arrivals, are often masked by noise due to compressional waves and surface waves.
However, when shear velocities can be measured in situ, they provide more information about anisotropy than compressional wave velocities.
13
The velocity difference between vertically and horizontally polarized shear waves is explicitly related to the magnitude and symmetry of mineral and crack anisotropy. The degree of saturation has negligible effect on shear velocity at seismic
frequencies (Nur and Simmons, 1969b). Therefore the interpretation of shear data in terms of the intrinsic physical properties of the rock and crack distribution is the same regardless of the degree of saturation. And because only one propagation path is used, compositional variations along the path and the effect of pore pressure do not change the magnitude of the difference between the vertically and horizontally polarized waves. We conclude that shear wave velocities on rocks in situ, holds high potential for the study of rocks.
In laboratory studies, acoustic double refraction
(or the arrival of two shear waves of different velocities) has previously been observed in single crystals (Simmons and Birch, 1963), in rocks with stress-induced anisotropy in crack distribution (Nur and Simmons, 1969a), and in rocks with anisotropy in mineral orientation (Christensen and Ramananantoandro, 1971). In addition, Simmons (1964) and Tilman and Bennett (1972) report variations in shear velocity with orientation that exceed 10% for several rocks, but they do not discuss the origin of the anisotropy. We report new data for double refraction in a granite having naturally occurring crack anisotropy.
scale refraction surveys over hundreds of meters (Jolly, 1956), and in large scale seismic studies over thousands of kilometers (Byerly, 19381. On the basis of The laboratory
studies of acoustic double refraction we suggest that in situ observations of double refraction can be used to study
anisotropy in the earth's crust and upper mantle, and to determine the cause of anisotropy (mineral or crack).
SINGLE CRYSTALS
Consider a plane shear wave with known polarization P incident on the surface of a single crystal with direction cosines 24, k2, and £3. Wave propagation in the crystal is described by the Christoffel equation (Hearmon, 1961)
Jr..
1J - 6. .pU2 = 0 (1)1J
where r , the Christoffel stiffnesse, are related to the elastic constants and depend on direction, p is 4ensity, and u is velocity. The solution of this cubic equation for a given direction shows that one compressional and two shear
waves can propagate. Hence the incident shear wave is resolved into two shear waves that travel along the same path with
different velocities. The particle motions of the two waves are perpendicular to each other, but generally not perpendicular to the direction of propagation. The shear waves are quasi-shear waves, having distinct energy flux vectors and different velocities. The phenomenon is called acoustic double refraction
(Waterman- and Teutonico, 1957), and we shall use the abbreviation ADR. In their measurement of the elastic constants of the
cubic crystal pyrite, Simmons and Birch (1963) observed ADR. A shear wave polarized in the (111) direction was transmitted
along the (110) direction. If the displacement of the input wave were in the (001) or (110) direction, only a single shear
the motion of the input wave was rescLved into the two components, recognized by Simmons and Birch as two distinct shear arrivals
(travelling with the above velocities) and a series of reflections of the initial pulses.
Single crystal data can be used to illustrate the way in which seismic anisotropy in rocks can be studied. Consider wave propagation along the (110) direction of a cubic crystal. The velocities are
[1/2(C11
+ C12) + C44 1/2 (2) V C44 1/2 (3) sl -C1 - C1211/2 Vs2 2p (4)and a measurement of the three velocities along this single direction is sufficient to determine the full set of elastic constants (C 11, C12, and C44). Similarly when shear waves propagate through rock, any anisotropy causes a difference
in the shear velocities. Measurement of shear velocities therefore gives information about the anisotropy.
17
ANISOTROPY IN MINERAL ORIENTATION
Anisotropy in the elastic properties of many igneous rocks is caused by a preferred orientation of individual mineral grains in the rocks (Birch, 1960 and Brace, 1965). For example, the intrinsic velocities of some ultrabasic rocks are influenced by a preferred orientation of olivine grains. Birch (1960, 1961) and Simmons (1964) noted
anisotropies in compressional and shear velocities of dunites at high pressure.that exceeded 10%. Christensen (1966) and
Crosson and Lin (1971) correlated this anisotropy with preferred orientation of olivine grains in two dunites; and Christensen
(1971) showed that this anisotropy exists in situ throughout the Twin Sisters dunite in Washington State. Ernst (1935), Brothers and Rodgers (1969), and numerous other authors showed a similar preferred orientation of olivine fabric in many ultrabasic
nodules. In addition, through a series of high temperature compression tests on dunite, peridotite, and olivine powder, Ave'Lallement and Carter (1970), Carter et al. (1972), and Baker and Carter (1972) have produced samples experimentally which show preferred mineral orientation.
Acoustic double refraction, caused by mineral orientation, has been documented by Christensen and Ramananantoandro (1971)
in a comprehensive study of the Twin Sisters dunite. Their fabric diagrams for the Twin Sisters dunite show a distinct concentration of olivine a axes, surrounded at 90* by girdles of b and c axes. [Stonely (1949) termed this symmetry transverse
anisotropy. For a comprehensive discussion of types of anisotropy in rocks see Paterson and 7eiss (1961).] Due to the large directional variations in compressional and shear
velocity in single crystal olivine (Verma, 1960), the anisotropy in fabric in the Twin Sisters dunite causes acoustic double
refraction.
The anisotropy and double refraction of the Twin Sisters
dunite are attributed to mineral anisotropy because the anisotropy remains at high pressures of 5-10 Kb where microcracks are
closed. Christensen and Ramananantoandro illustrated acoustic double refraction in the Twin Sisters dunite by propagating a
shear wave normal to the a axis (the fast compressional velocity direction) and rotating the polarization of the input and
receiving transducers through a series of angles from parallel to the a axis (O*) to perpendicular to the a axis (90*). At 0*, one distinct shear arrival was evident. As the polarization of the transducers was rotated, the amplitude of this shear arrival decreased, and reached zero at 90*; a second arrival of slower velocity was then evident. At intermediate orientations both
arrivals were visible but of lower amplitude. The double refraction is predicted from the theory of wave propagation in transversely isotropic elastic media.
Stonely (1949) discussed wave propagation in a medium with transverse anisotropy. The Christoffel equations are greatly
simplified for this symmetry. Let the velocities be V , Vsl' Vs2'
symmetry axi3. In Nur's (197.1) notation, the velocities are (5) V= + B] 1/2 p
_
2p]
1/2 sin2i + C13 1 3cos
2p11/2
A = Ci11 1 sin2j + C1 3 1 3 + C3333 COS2
B = [(C1111 -+ 4(C1133
C1 313 )sin2$ - (C3 3 3 3 - Ci13 3)cos2P 2
+ C1 3 1 3) 2 sin
2$ cos2
4P1/2
and p is density. For propagation along the symmetry axis the velocities are simply
C3333 1/2 V = p p][12 V s 1/2 SV = 3
13
s2
L
PJ
and for propagation normal to the symmetry axis
VP=
[C111j1/2
Vp p C 12 121/2
Vs 2 -p C 1313 1/ 2 ,V =i P 19 Vl Vs 2 C12 12 (6) (7) where (8) (9) ($p = 0) , (10) (11) IFor propagation normal to the concentration of a axes in olivine, equation (11) applies. We note explicitly that two distinct shear arrivals are predicted by the Christoffel equation for all directions of propagation other than along the symmetry axis.
21
GEOMETRICAL ANISOTROPY - MINERAL LAYERING
A second source of anisotropy in igneous rocks is the arrangement of the individual minerals; the particular example of layering is most important in the earth. For
example, Uhrig and Van Melle (1955) found that the compressional velocity normal to interbedded layers of clastic and carbonate
sediments was 10 to 20% less than that along the layers. Bachus (1962) showed that this anisotropy was consistent with the theory of wave propagation through layered media
in which the wavelength is much greater than the layer thicknesses. Layering of rocks in situ include not only sedimentary rocks but also basalt flows interbedded with pyroclastics or soils, rhythmic layering of igneous bodies typified by the Palisades Sill described by Walker (1969), and compositional layering in metamorphic rocks. Large scale
mineral layering is recognized in the earth's crust as a 6 km/sec layer above a 7 km/sec layer separated by the Conrad discontinuity. Smaller scale mineral layering occurs as alternating layers
in lab samples of such mineral pairs as olivine-feldspar, wollastonite-diopside, and garnet-pyroxene.
All rocks with mineral layering should exhibit double refraction. The difference between the two shear arrivals
depends on the relative thickness of the layers with respect to wavelength, and the properties of the individual layers.
The theory of wave propagation in layered media is well developed (Brekhovskikh, 1960 and Backus, 1962). The velocities
including the elastic properties of the minerals in each layer, layer thickness (d), and the wavelength (X) of the propagating wave. For the short wave length limit, X<<d, the velocities are simply time averages through the layers; velocities in each layer can simply be calculated from the individual mineral elastic constants. In this case, VSl = VS2. For the long wavelength
limit X>>d, the solution is more complex, but has been solved by Backus (1962). The solution is similar to that for a transverse isotropic medium (equations 5, 6, and 7) where the effective elastic constants involve averages over the elastic constants and densities of the individual layers. For propagation along the layers, two pseudo-shear waves are predicted. The velocity
for polarization normal to the layering is always less than that for polarization parallel to the layering. For X ~ d, the
solution is extremely complex. Thomson (1950) gives the solution in terms of propagating matrices. Velocity solutions, requiring complete specification of layer thickness and boundary conditions, can be obtained numerically. Values of VSl and VS2 are
intermediate to those of the long and short wavelength limits. Two pseudo-shear waves of different velocity again exist.
NATURALLY OCCURRING CRACK ANISOTROPY
The presence of microcracks in all low porosity rocks
significantly influences the values of elastic constants at low confining pressures (i.e. Adams and Williamson, 1923; Birch, 1960; Simmons, 1964; and Brace, 1965). An anisotropic distribution
of microcracks generates anisotropy in values of effective
elastic constants. Preferred orientations in crack distribution can result from primary features such as preferred mineral
orientations (i.e., mica in a micaceous schist) where grain
boundaries, cleavage, etc. are open cracks or from an anisotropic stress distribution acting on the rock after formation. For
instance, because of extension fracturing due to removal of
overburden pressure by erosion, most granites are more intensely
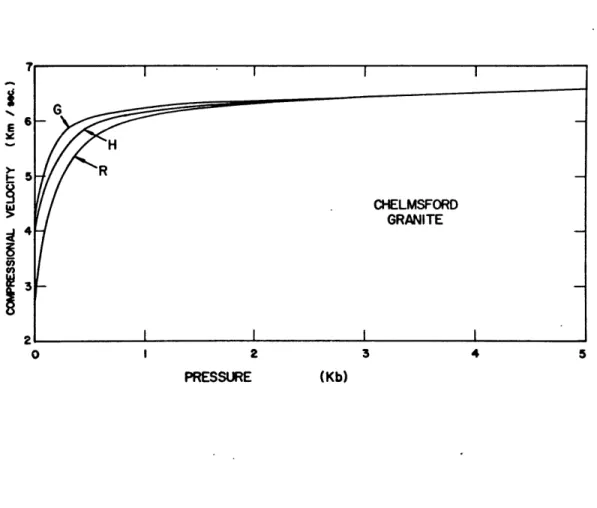
cracked in the horizontal plane than in any other plane (Jahns, 1943). The Chelmsford granite (table 1) is a particularly good example
for both crack anisotropy resulting from stress fracturing and mineral orientation of mica. Peng and Johnson (1972) noted
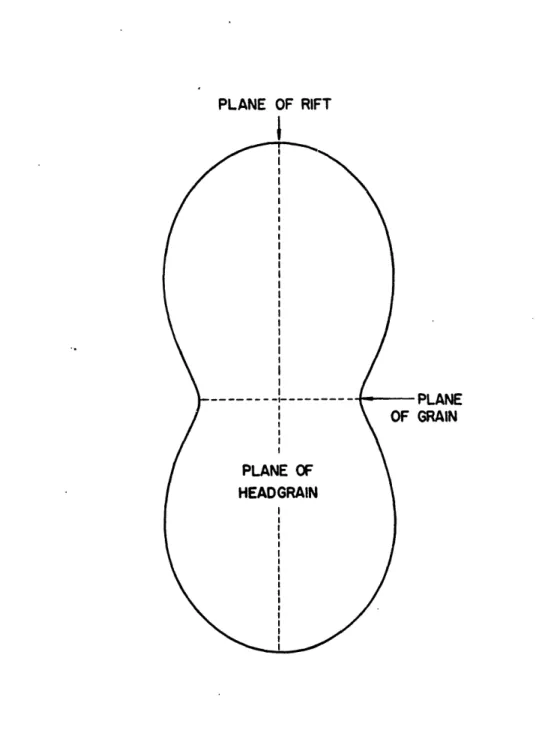
that cracks are preferentially oriented parallel to the horizontal rift plane (R) relative to either the grain (G) or headgrain (H) planes. The rift, grain, and headgrain are quarrying terms used to describe the easiest, intermediate, and most difficult
directions for splitting. In the Chelmsford granite, the rift is perpendicular to the grain but the headgrain can be chosen at any angle relative to the rift or grain (Skehan et al., 1964); in our sample the headgrain plane is normal to both the rift and grain planes. The intense cracking parallel
of overburden material by erosion. There are secondary, but much smaller, concentrations of cracks parallel to the grain and headgrain planes (Peng and Johnson, 1972). Splitting parallel to the grain plane is controlled by a concentration of microcracks
lying between 7* and 12* of the grain plane (Peng and Johnson,
1972), a preferred orientation of mica (and thus cleavage cracks in mica) along the grain plane, and possible open cracks between mica flakes and adjacent minerals. A less pronounced concentration of cracks in the headgrain plane accounts for the ease of splitting along the grain surface relative to the headgrain surface.
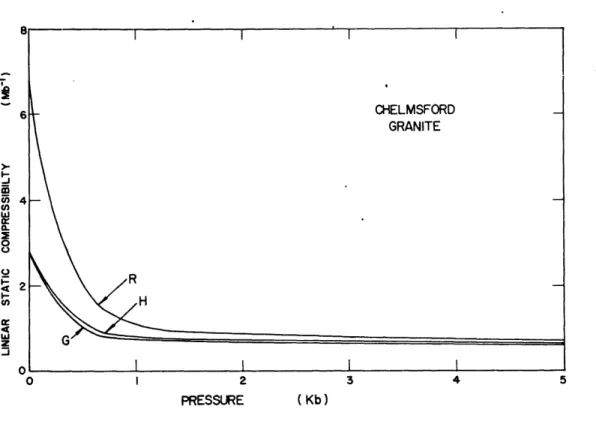
The effect of crack anisotropy on the linear static compressibility of Chelmsford granite is illustrated in
figure 1. The sample used for these measurements was quarried about 50 ft directly beneath - and oriented with respect to
-that of Peng and Johnson. The larger number of cracks perpendicular to the rift is manifested by a much larger compressibility at low pressures (about 130% at P = 0). At high pressure where cracks are closed, the three linear compressibilities are the same. Peng and Johnson noted similar behavior in the value of Young's modulus for the Chelmsford granite.
An anisotropic crack distribution generates anisotropy in effective elastic constants, and hence double refraction. The phenomenon of double refraction is illustrated in figure 2
for the Chelmsford granite. A single sample was cored normal to the grain plane, the ends of the sample were ground parallel to ± 0.001 inches, and the sample dried for 24 hours at 70*C
25
in a vacuum oven. The sample was then jacketed with thin copper foil which was seated tightly to the sample at a pressure of 5 Kb, and AC cut quartz transducers were fixed with epoxy to the copper end pieces. Shown in figure 2 are
a series of tracings of received shear waves that propagated
perpendicular to the grain plane; polarization of the transducers
varied from normal to the headgrain plane (0*) to normal to the
rift plane (90*). Because the propagation direction is
normal to the grain plane (and hence the concentration of mica flakes), shear waves of all polarizations are influenced in the same way by the mica; thus the only parameter influencing velocity differences is the anisotropy in crack distribution. The wave forms are shown at confining pressures of 50, 250, and 2000 bars.
At low pressure, two distinct arrivals are evident; a fast arrival for transducer polarization normal to the
headgrain (0*) and a slower arrival for transducer polarization normal to the rift (90*). Both arrivals are visible at
intermediate angles. Because of the concentration of crack poles parallel to the rift, the shear velocity normal to the rift is less than that normal to the headgrain. Increasing the pressure to 250 bars closes some fraction of the cracks and reduces the velocity difference between the two shear waves. At 2000 bars, most cracks are closed and double
refraction is barely visible. At still higher pressures only one shear wave exists at all angles, 0* through 90*. Where
of double refraction is removed.
The effect of crack anisotropy on velocities has been
treated theoretically by Nur (1971) by extending Walsh's (1965) concept of penny-shaped cracks to orientational distributions. Following the solutions given by Stonely (1949) for a transverse isotropic medium, Nur obtained expressions similar to those
given in equations 5, 6, and 7 with the important difference that now the effective elastic constants involve an integration over crack parameters. If the crack distribution is anisotropic, two pseudo shear waves exist; the shear velocity is lowest for a direction normal to the greatest concentration of crack planes.
STRESS INDUCED CRACK ANISOTROPY
Crack anisotropy can be induced in rocks containing
microfractures by the application of a non-hydrostatic stress field. The resulting anisotropy in crack distribution
causes anisotropy in physical properties. The variation in compressional velocity induced by uniaxial stress has been studied for concrete (Jones, 1952) and several low porosity igneous rocks (Shimozuru, 1955; Tocher, 1957; Matsushima, 1960; Valarovich et al., 1963; Nur and Simmons, 1969a; and Thill, 1972). Cracks oriented normal to the stress axis are closed by a uniaxial stress; velocity therefore increases with stress until stres-ses near the fracture strength (C) are
reached. At stresses near C, the large increase in crack density causes the velocity to decrease slightly. On the other hand, cracks aligned parallel to the stress axis are relatively uneffected by the axial stress until new cracks are formed (at stress about C/2); velocities therefore only increase slightly with stress for stresses less than
C/2. At stresses near C/2 (for unconfined laboratory samples), either new cracks begin to form parallel to the stress axis or pre-existing cracks along the stress axis are opened further
(Brace et al., 1966). Therefore at stress greater than C/2, the velocity normal to the stress axis decreases steadily with
increasing stress until the rock fractures. However, in the earth dilatancy probably cannot occur because of confining pressures. The anisotropy in stress values probably does not
exceed 100 to 200 bars for tectonic regions (Wyss and Molnar, 1972; Aki, 1967; and others). The critical observation is this: cracks normal to the stress axis close but cracks parallel to the stress axis are relatively unaffected by uniaxial stress. Thus velocities increase parallel to the axis but are relatively unaffected normal to the axis.
The effect on shear velocity of stress-induced anisotropy in crack distribution has been studied by Nur and Simmons
(1969a). They used the Barre granite which is isotropic in both physical properties and crack distribution, even at low confining pressures. By applying a uniaxial stress, they created a plane of low crack density (transverse anisotropy). This symmetry is the same as that occurring naturally in the Chelmsford granite. Their observations of induced double refraction are therefore similar to those we have outlined above for the Chelmsford granite.
The theoretically predicted effect of stress on the elastic properties of rocks containing microcracks is included in
Nur's (1971) paper. Nur has derived expressions for velocities under hydrostatic pressure, for velocities across axes of
uniaxial stress, and for velocities along axes of uniaxial stress, in the Barre granite, and has found that his theory adequately describes velocity variations under both hydrostatic pressure and uniaxial stress. In particular, the observed
IN-SITU ANISOTROPY
In-situ velocity anisotropy has previously been reported. Among the first to notice two distinct shear arrivals associated with horizontally (SH) and vertically (SV) polarized shear waves,
travelling through the interior of the earth, were Neumann (1930) and Byerlee (1934, 1938). For instance for an earthquake occurring off the California coast in 1934, Byerlee (1938) noted an SV
arrival approximately 14 sec after the SH arrival on a
seismogram recorded in Massachusetts. This particular example of double refraction in situ is difficult to interpret in
terms of anisotropy in the deep crust or upper mantle because the path of propagation is extremely complex; east-west
variations in heat flow (Horai, 1969), velocity structure (Herrin, 1969), and seismic attenuation (Solomon, 1972) are
evident across the continental block of North America. However, the differences in SH and SV arrival times do suggest that
mineral anisotropy occurs in the upper mantle beneath the U.S. This fact is further substantiated by McEvilly (1964) and
Brune (1969) who report anomalously low phase velocities for Rayleigh waves (SV) when compared with phase velocities for Love waves (SH) in the central U.S.
In addition to anisotropy in continental structure, seismic anisotropy has also been reported in oceanic areas. In a number of refraction surveys in the Pacific basin, Hess (1964),
Christensen (1969), Raitt et al. (1969), Raitt (1969), Keen and Barret (1971), and others report azimuthal variations of
interpret this anisotropy in terms of preferred orientation of olivine fabric. However, they have not yet measured shear velocities. If anisotropy is present, it will cause double refraction. Shear velocities therefore provide an additional method for both verifying the existence of such anisotropy and
interpreting the anisotropy in terms of the elastic properties of the upper mantle.
A particularly intriguing example of ADR has been reported by Bentley (1972). During an ultrasonic velocity logging
experiment to depths of 1550 meters in the Antarctic ice sheet, he noted anisotropies in compressional and shear velocities. He attributed the anisotropy to one, and in some cases two, directions of preferred orientation of the ice crystals. The
alignment of ice crystals is a common phenomenon throughout the ice sheet in Antartica (Bentley, 1972). Kamb (1972) has shown that the preferred orientation is stress induced.
There are several in situ observations of double refraction caused by anisotropy in mineral layering and crack distribution. For instance, Jolly (1956) has investigated the propagation of
SV and SH waves through a uniform section of shale. The shale, having a dense concentration of horizontally oriented cracks, in addition to mineral layering, provides an ideal transverse isotropic medium. At shallow depths (<100 meters) the SV wave was
50-100% slower than the SH wave; the difference in the two shear velocities decreased with depth. Crack orientation and mineral layering evidently controlled the difference in the
31
shear velocities at shallow depths.
Layering occurs on a larger scale across extensive areas of the earth and lunar surfaces in the form of one or more layers of basalts or breccias. In earthquake seismology, one propagates shear waves of wave length on the order of
kilometers through the earth and moon. Shear waves travelling through layers of such thickness should exhibit double
refraction. If the mare surface is covered with layered basalts and breccias, two shear arrivals should be evident on seismograms recorded from natural or manmade impacts on the lunar surface. Any observed ADR can be used to study layered structure on the
lunar surface.
Because non-uniform stress causes anisotropy in crack
distribution and therefore anisotropy in compressional velocity, Tocher (1957) suggested that compressional velocity measurements near fault zones can be used to monitor stress changes. Eisler
(1969), Aki et al. (1970), Kanamori (1970), and others have followed this suggestion and interpreted velocity changes in situ in terms of stress built up. However, because of the inherent problems (as previously mentioned) in interpreting compressional velocity in terms of the degree of saturation, pore pressure, and composition, extreme caution must be taken in the interpretation of compressional data.
We suggest that the key to observing crack closure under stress lies with shear velocity measurements at more than one polarization. For instance, a number of authors
crust. (The stress drops associated with earthquakes induced by these stresses is one to two orders of magnitude less than these stresses.) Using these stresses and the laboratory
data of Nur and Simmons (1969a) for stress induced shear velocity anisotropy in granite, we should expect shear velocity anisotropy of about 0.2 km/sec, or about 8% difference in the two shear
velocities at 200 bars. The corresponding velocity differences for two compressional waves normal and parallel to the stress axis is 13% at 200 bars. Although the SH and SV shear velocity
measurements are not quite as sensitive to anisotropy as are the two perpendicular compressional velocity measurements, the
difference between the shear velocities along a single propagation path, carry only information about anisotropy; the difference in the SH and SV arrivals is not affected in any way by the percent saturation, pore pressure, or compositional variation. Any
anisotropy is due solely to the closing of cracks in the rock; a measurement of the difference between the SH and SV velocities near a source of stress build-up, describes only the stress acting on the rock.
DISCUSSION
We have considered the effects of crack and mineral anisotropy on the propagation of shear waves through rocks in the laboratory on samples chosen specifically for their anisotropy. How do
we apply the laboratory observations to the interpretation of anisotropy in situ? For instance, if anisotropy is present in both crack distribution and mineralogy, how do we separate the two sources of anisotropy? To answer these questions, we
consider a simple example.
The Chelmsford granite contains both crack anisotropy (i.e. cracks preferentially oriented parallel to the rift) and mineral anisotropy due to mica orientation (parallel to the
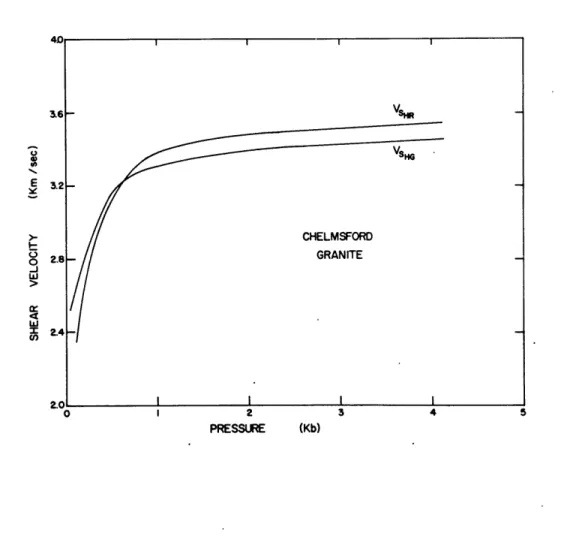
grain). Both these sources of anisotropy influence shear velocities. In figure 3 we have plotted the shear velocities for propagation
perpendicular to the headgrain and polarization normal to the rift (V HR) and to the grain (V HG) planes. The value of V HR should be most sensitive to the intense concentration of cracks in the
rift, the value of V HG should be sensitive to the mica concentration in the grain. At low pressures cracks are open, and the effect of the of the dense crack concentration in the rift dominates the effect
of mica orientation; thus VHR < V HG. At higher pressures the
cracks are closed and the effect of the intrinsically lower velocity perpendicular to the mica cleavage dominates that of cracks; thus VSHR V HG At low pressure the crack distribution is more
important in determining shear velocities; at high pressures cracks are closed and the effect of mineral anisotropy dominates. Thus,
34
measuring shear velocity under hydrostatic pressure separates crack and mineral anisotropy.
Now consider the same experiment in situ, where the earth acts as a pressure vessel. Jolly (1956) has measured shear velocities in shale; shale is a prime example of a rock with
both crack and mineral anisotropy. Jolly found a large difference (50-100%) in SH and SV velocities at shallow depths; the difference decreased at greater depth. To interpret these results, consider the effect on cracks and mineral layering due to the increase in pressure with depth in the earth. Cracks close with depth
(pressures) but mineral layering is unaffected. The large
difference between SH and SV velocities near the surface is due mainly to dense concentration of horizontally oriented cracks; with depth the cracks close and the difference between SH and
SV velocities approaches the value expected solely for mineral layering. Thus because the earth provides a graded pressure scale with depth, we can carry out the same experiment in situ that we did with Chelmsford granite in the laboratory. We can therefore separate the sources of anisotropy.
It follows then that anisotropy for a given lithologic unit which varies with depth is crack anisotropy. In the same way,
anisotropy which does not vary with depth is mineral anisotropy. And finally, any anisotropy at depths where pressure is greater
than 1-2 Kb, is certainly mineral anisotropy, for at such pressure all cracks are closed.
SUMMARY
Previously most authors (for instance Simmons, 1964) have reported only one shear velocity for a given propagation direction
in rocks. It has now become evident that a single shear velocity value does not fully describe shear wave propagation in a given direction
for anisotropic rocks. The difference in the two shear velocities for waves having the same propagation path and perpendicular
polarizations can exceed 10%. Thus in rock samples with anisotropy in crack and mineral distribution, more than a single shear
velocity measurement must be obtained in each propagation direction in order that the velocities completely describe the elastic
behavior of the rock.
Recognizing the fact that shear velocities carry information about anisotropy, crack and mineral anisotropy in the earth's crust and mantle and in the lunar interior can be studied using shear waves. In particular, much information can be
obtained from shear velocity measurements of mineral anisotropy in the earth's upper mantle, mineral layering in terrestrial and lunar volcanic rocks, naturally occurring crack anisotropy in granites and shales, and stress induced crack anisotropy in areas of the earth's crust under stress.
Adams, L.H., and E.D. Williamson, The compressibility of minerals and rocks at high pressure, J. Franklin Inst., 195, 475-529, 1923.
Aki, K., Scaling law of seismic spectrum, J. Geophys. Res., 72, 1217-1231, 1967.
Aki, K., T. De Fazio, P. Reasenberg, and A. Nur, An active experiment with earthquake fault for the estimate of the in situ stress, Bull. Seism. Soc. Am., 60,
1315-1336, 1970.
Ave'Lallement, H.G., and N.L. Carter, Syntectonic recrys-tallization of olivine and modes of flow in the
upper mantle, Geol. Soc. Amer. Bull., 81, 2203-2220, 1970.
Bachus, G.E., Long wave elastic anisotropy produced by horizontal layering, J. Geophys. Res., 67, 4427-4440, 1962.
Baker, D.W., and N.L. Carter, Seismic velocity anisotropy calculated for ultramafic minerals and aggregates, in Flow and Fracture of Rocks,Geophys. Monograph 16,
157-166, American Geophysical Union, Washington, D.C., 1972.
Bentley, C.R., Seismic wave velocities in anisotropic ice: a comparison of measured and calculated values in and around the deep drill hole at Byrd Station,
37
Antarctica, J. Geophys. Res., 77, 4406-4420, 1972. Birch, F., The velocity of compressional waves in rocks
to 10 kilobars, part 1, J. Geophys. Res., 65, 1083-1102, 1960.
Birch, F., The velocity of compressional waves in rocks to 10 kilobars, part 2, J. Geophys. Res., 66, 2199-2224, 1961.
Brace, W.F., Some new measurements of linear compressibility of rocks, J. Geophys. Res., 70, 391-398, 1965.
Brace, W.F., B.W. Paulding, and C. Scholz, Dilatancy in the fracture of crystalline rock, J. Geophys. Res.,
71, 3939-3954, 1966.
Brekhoskikh, L.M., Waves in Layered Media,transl. by D. Lieberman, ed. by R.T. Beyer, Academic, New York,
1960.
Brothers, R.N., and K.A. Rodgers, Petrofabric studies of ultra-mafic nodules from Aukland, New Zealand, J. Geol.,
77, 452-465, 1969.
Brune, J.N., Surface waves and crustal structure, in The Earth's Crust and Upper Mantle, Geophys. Monograph 13,
230-242, American Geophysical Union, Washington, D.C., 1969.
Byerl7', P., The Texas earthquake of August 16, 1931, Bull. Seism. Soc. Amer., 24, 81-99, 1934.
Byerlty1 , P., The earthquake of July 6, 1934: amplitudes and first motion, Bull. Seism. Soc. Amer., 28, 1-13, 1938.
Carter, N.L., D.W. Baker, and R.P. George, Jr., Seismic anisotropy, flow, and constitution of the upper mantle, in Flow and Fracture in Rock, Geophys. Monograph 16,
167-190, American Geophysical Union, Washington, D.C., 1972.
Christensen N.I., Elasticity of ultrabasic rocks, J. Geophys. Res., 71, 5921-5931, 1966.
Christensen N.I., Fabric, seismic anisotropy, and tectonic history of the Twin Sisters Dunite, Washington, Geol. Soc. Amer. Bull., 82, 1681-1694, 1971.
Christensen, N.I., and R.S. Crosson, Seismic anisotropy in the upper mantle, Tectonophysics, 6, 93-107, 1968. Christensen, N.I., and R. Ramananantoandro, Elastic
moduli and anisotropy of dunite to 10 kilobars, J. Geophys. Res., 76, 4003-4010, 1971.
Crosson, R.S., and N.I. Christensen, Transverse anisotropy of the upper mantle in the vacinity of the Pacific fracture zones, Bull. Seism. Soc. Amer., 59, 59-72, 1969.
Crosson, R.S., and J.W. Lin, Voigt and Reuss prediction of anisotropic elasticity of dunite, J. Geophys. Res.,
76, 570-578, 1971.
Eisler, J.D., Investigation of a method for determining
stress accumulation at depth,2, Bull. Seism. Soc. Amer., 59, 43-58, 1969.
Ernst, T., Olivinknollen der basalte als bruchstuche alter olivinfelse, Nachr. Gesell. Wiss. Gottingen, Math-phys.
39
Kl., N.F., Fachgr. 4, 1, 147-154, 1935.
Hearmon, R.F.S., An Introduction to Applied Anisotropic Elasticity, 136 pp., Oxford University Press, Oxford,
1961.
Herrin, E., Regional variations in p-wave velocity in the upper mantle beneath North America, in The Earth's Crust and Upper Mantle, Geophys. Monograph 13,
242-246, American Geophysical Union, Washington, D.C., 1969.
Hess, H., Seismic anisotropy in the uppermost mantle under oceans, Nature, 203, 629-631, 1964.
Horai, K., Cross-covariance analysis of heat flow and seismic delay times for the earth, Earth Planet. Sci. Lett., 7, 213-220, 1969.
Jahns, R.H., Sheet structure in granites: its origin and use as a measure of glacial erosion in New England, J. Geol., 51, 71-98, 1943.
Jolly, R.N., Investigation of shear waves, Geophysics, 21, 905-938, 1956.
Jones, R., A method of studying the formation of cracks in a material subjected to stress, Brit. J.,Appl. Phys., 3,
229-232, 1952.
Kamb, B., Experimental recrystallization of ice under stress, in Flow and Fracture of Rocks, Geophys. Monograph 16, 211-241, American Geophysical Union, Washington, D.C., 1972.
research in Japan, Tectonophysics, 9, 291-300, 1970. Keen, C.E., and D.L. Barrett, A measurement of seismic
anisotropy in the northeast Pacific, Can. J. Earth Sci., 8, 1056-1064, 1971.
Matsushima, S., Variation of the elastic wave velocities of rocks in the process of deformation and fracture under high pressure, Disaster Prevention Res. Inst., Kyoto Univ., Bull. 32, 1-8, 1960.
McEvilly, T.V., Central U.S. crust-upper mantle structure from Love and Rayleigh wave phase velocity inversion, Bull.
Seis. Soc. Amer., 54, 1997-2015, 1964.
Neumann, F., An analysis of the s-wave, Bull. Seis. Soc. Amer. 20, 15-32, 1930.
Nur, A., Effect of stress on velocity anisotropy in rocks with cracks, J. Geophys. Res., 76, 2022-2034, 1971. Nur, A., and G. Simmons, Stress-induced velocity anisotropy
in rock: an experimental study, J. Geophys. Res., 74, 6667-6674, 1969a.
Nur, A., and G. Simmons, The effect of saturation on velocity in low porosity rocks, Earth Planet. Sci. Lett., 7,
183-193, 1969b.
Paterson, M.S., and L.E. Weiss, Symmetry concepts in the structural analysis of deformed rocks, Bull. Geol. Soc. Amer., 72, 841-882, 1961.
41
cylindrical specimens of Chelmsford granite, Int. J. Rock Mech. Min. Sci., 9, 37-86, 1972.
Raitt, R.W., Ahisotropy in the upper mantle, in The Earth's Crust and Upper Mantle, Geophys. Monograph 13, 250-256, American Geophysical Union, Washington, D.C., 1969.
Raitt, R.W., G.G. Shor, Jr., T.J.G. Francis, and G.B. Morris, Anisotropy of the Pacific upper mantle, J. Geophys. Res. 74, 3095-3109, 1969.
Shimozuru, D., Elasticity of rocks under initial stresses, with special reference to the fracture problem, Bull.
Earthquake Res. Inst., 33, 437-450, 1955.
Simmons, G., The velocity of shear waves in rocks to 10 kilobars, 1, J. Geophys. Res., 69, 1123-1130, 1964. Simmons, G., and F. Birch, Elastic constants of pyrite,
J. A Phys., 34, 2736-2738, 1963.
Skehan, J.W., W.J. Keating, R.J. Robinson, and J.B. LeMasurier, Symposium on quarrying in Massachusetts, in Economic
Geology in Massachusetts, ed., O.C. Farquhar, 141-160, University of Massachusetts Graduate School, 1964.
Solomon, S.C., Seismic wave attenuation and partial melting in the upper mantle of North America, J. Geophys. Res., 77, 1483-1502, 1972.
Stonely, R., The seismological implications of aeolotropy in continental structure, Royal Astron. Soc. Monthly Notices, Geophys. Supp., 5, 343-353, 1949.
th
paper presented at 14 -Symposium on Rock Mechanics, Pennsylvania State University, 1972.
Thill, R.E., RJ. Willard, and T.R. Bur, Correlation of longitudinal velocity variation with rock fabric, J. Geophys. Res., 74, 4897-4909, 1969.
Thomson, W.T., Transmission of elastic waves through a
stratified solid medium, J. Appl. Phys., 21, 89-93, 1950. Tilmann, S.E., and H.F. Bennett, The use of ultrasonic
birefringence as a positive indicator of seismic anisotropy, Abstracts with Programs, 1972 Annual Meetings, 4, 691,
October, 1972.
Tocher, D., Anisotropy of rocks under simple compression, Trans. Amer. Geophys. Union, 38, 89-94, 1957.
Todd, T., and G. Simmons, Effect of pore pressure on velocity of compressional waves in low porosity rocks, J. Geophys.
Res., 77, 3731-3743, 1972.
Uhrig, L.F., and F.A. Van Melle, Velocity anisotropy in stratified media, Geophysics, 20, 774-779, 1955. Valorovich, M.P., D.B. Balashov, I.S. Tomashevskaya, and
V.A. Pavlogradskii, A study of the effect of uniaxial compression on the velocity of elastic waves in rock samples under conditions of high hydrostatic pressure, Bull. Acad. Sci. USSR, Geophys. Ser. (English Transl.), 8, 728-732, 1963.
Verma, R.K., Elasticity of some high density crystals, J. Geophys. Res., 65, 757-766, 1960.
Walker, R.K., The Palisades.sill, New Jersey: a reinvestigation, Geol. Soc. Amer., Special Paper 111, pp 178, 1969.
Walsh, J.B., The effects of cracks on the compressibility of rocks, J. Geophys. Res., 70, 399-411, 1965.
Waterman, P.C., and L.J. Teutonico, Ultrasonic double refraction in single crystals, J. A Phys., 28, 266-270, 1957.
Wu, T.T., The effect of inclusion shape on the elastic
moduli of a two phase material, Int. J. Solids Struct., 2, 1-8, 1966.
Wyss, M., and P. Molnar, Efficiency, stress drop, apparent stress, effective stress, and functional stress of Denver, Colorado earthquakes, J. Geophys. Res., 77, 1433-1438, 1972.
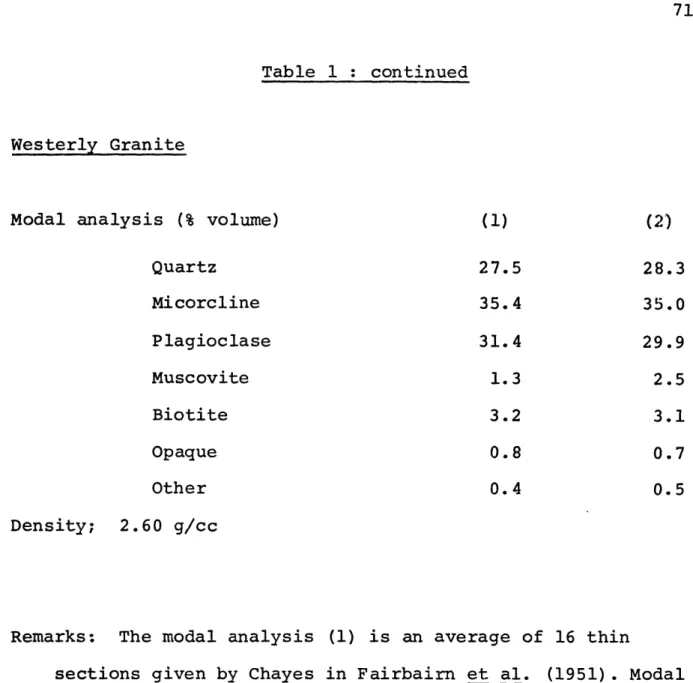
Chelmsford Granite
Modal Analysis: % volume
Quartz 34.4 Microcline 36.3 Plagioclase 18.5 Muscovite 8.1 Biotite 0.9 Other 1.0 Density: 2.63 g/cc
Remarks: The modal analysis is an average from three thin sections oriented in the rift, grain, and headgrain (2700 points each).
45 6 CHELMSFORD GRANITE CL 2 R 0 H w z G 0 C01 2 3 4 PRESSURE (Kb)
Figure 1. Linear static compressibility (Mb~) of Chelmsford granite normal to the rift (R) , grain (G), and headgrain (H) planes.
750*
900 *
CHELMSFORD GRANITE
Figure 2. Acoustic double refraction in Chelmsford granite. Tracings of shear arrivals are shown at 50, 250, and 2000 bars for propagation normal to the grain, and transducer polarization at a series of angles between the normal to
47 46 3.6 - SHR VsW E 3.2-- CHELMSFORD 2.8 - GRANITE -J w 2-4 -PRESSURE (Kb)
Figure 3. Shear velocity normal to the headgrain plane as a function of pressure to 5Kb in the Chelmsford granite. Velocity profiles are shown for transducer polarization
Chapter 3
Toward a Qualitative Relationship Between Elastic Properties
ABSTRACT
The distribution function LA ()dD (total crack length per unit area for cracks oriented between 6 + dO/2 and 0 - dO/2), determined with our new technique, was used to relate the effects of crack anisotropy and crack density to elastic properties of
low porosity rocks. The velocity variations caused by natural crack anisotropy in the Chelmsford granite correlated well with
the distribution function. Artificial crack porosity was
produced by thermally cycling a suite of Westerly granite samples in vacuum to different maximum temperatures. Higher temperatures produced larger crack densities. The elastic properties and
crack density measured on the suite of samples showed that variations in elastic properties could not be described by a
single crack parameter. However, two crack parameters [say
crack porosity and LA (M)dO] and the intrinsic elastic properties of the aggregate composing the rock, determine uniquely the
elastic properties of crack filled rocks.
INTRODUCTION
At the high pressures and temperatures of the deep crust and upper mantle, the grain surfaces in most rocks are probably in
solid contact with neighboring grains at sometime in their history. When a rock is brought to the pressure and temperature conditions near the surface of the earth, the differences in compressibilities and thermal expansions between adjacent grains introduce some
igneous rocks, a large percentage of the total porosity exists in the form of thin openings (microfractures) along grain boundaries and within individual grains. The remainder of the porosity
exists as more equidimensional cavities or pores. Application of one to two kilobars effective pressure, confining pressure minus pore pressure, approximately restores solid contact between
surfaces separated by microfractures, but has little effect on reducing the volume of the more spherically shaped pores. Because the measured microfracture and pore pososities are of comparable total volumes (Brace, 1965a), but the volume of a single micro-fracture is much smaller than the volume of a pore, there are
substantially more microfractures than pores in most igneous rocks. And because the effect of pressure on a microfracture of length a
and a pore of radius a changes values of elastic properties to
approximately the same extent (Walsh, 1965a), any effects of porosity on elastic properties are due primarily to the presence of micro-fractures. Several authors have studied recently the effects of cracks on physical properties.
Adams and Williamson (1923) first recognized the importance of cracks in increasing the static compressibility of various rocks. Subsequently Birch (1960, 1961) and Simmons (1964) found that the presence of cracks significantly decreased compressional and shear velocities of rocks. The values of such other properties as thermal conductivity (Walsh and Decker, 1966), permeability
(Brace et al., 1968), electrical resistivity (Brace and Orange, 1968), and fracture strength (Douglass and Voight, 1969) are similarly influenced by the presence of cracks. Because cracks
51
so significantly influence physical properties, anisotropy in
crack distri:ution causes anisotropy in physical properties beyond what can be accounted for by intrinsic mineral anisotropy.
Birch (1960, 1961) first suggested that low pressure variations' in compressional velocity of perpendicular cores was caused by crack anisotropy. Thill et al. (1969) showed conclusively a correlation between compressional velocity anisotropy and
microfractures in quartz in the Salisbury granite. Brace (1965b) found that linear compressibility was greater when measured
normal to planes of large microfracture concentration, and
Peng and Johnson (1972) successfully correlated crack anisotropy with compressive strength in the Chelmsford granite. These
authors have shown clearly that cracks influence physical
properties. It would be of prime importance if general relations could be found between crack parameters and physical properties.
In several theoretical papers, Walsh (1965a,b,c), Nur (1971), and Warren (1973) have considered the effect of pressure on elastic properties of rocks containing microfractures. Walsh modelled
rocks as isotropic elastic materials containing dilute concentrations of randomly oriented narrow cracks and calculated the effect of
pressure on static compressibility, on Young's modulus, and on Poisson's ratio in low porosity rocks. Nur calculated effects of stress and crack anisotropy on seismic velocities. Although the theories were developed to calculate the elastic properties as
functions of pressure, the expressions contain sufficient informaticn for some crack parameters to be calculated. For instance, total
crack aspect ratios (Morlier, 1971) can be calculated from stress-strain curves. However, the theoretical expressions depend on still other crack parameters not readily obtainable. Therefore, exact solutions for values of the elastic properties are
inherently difficult to obtain.
To study cracks in rocks, we would like to have values for such parameters as crack length, crack aspect ratio, number of cracks per unit area or volume, and the orientation of cracks. These parameters are quite general and presumably, their
quantitative relationship to physical properties would hold from one rock type to another (once the effect of intrinsic mineral
differences is removed). At present, because we cannot obtain these parameters, we have searched for a crack parameter which, while
still, generally applicable to rocks, is qualitatively meaningful in terms of physical properties of rocks, and is readily measureable. Baldridge et al. (1973) have developed a method for obtaining the crack parameter LA(e)de, the total crack length per unit area for cracks lying between the angles
e
+ dO/2 and 6 - d6/2. We will illustrate the usefulness of LA(e)de for describing the effect of (1) anisotropy in crack distribution and (2) density of cracks on the elastic properties of two granites.EXPERIMENTAL METHOD
The method of crack counting and the determination of crack length per unit area [LA(6)dO], discussed thoroughly by
Baldridge et al. (1973), are summarized here. Rock voids are impregnated with a mixture of furfuryl alcohol (C5H602) and
hydrochloric acid. After heating, a residue of carbon remains which is clearly visible in thin secti)n. By superimposing an array of parallel lines on the thin section, and counting the
number of crack intersections NL(6) for the array at given angles, the number of cracks per unit length is obtained for a given
direction. Using the method of Hilliard (1962) NL(e) is
transformed into a distribution function LA(6), the total crack length per unit area. LA(O)de, then gives the total crack length for cracks oriented between e + dO/2 and LA = f LA(O)dO gives
0
the total crack length. Although we have not collected enough data to apply rigorous statistical tests to our errors, from several counts we believe we can assign an error of about ± 10% to the values of LA(e)dO.
Velocities were measured with the standard pulse transmission technique of Birch (1960, 1961). All samples are cylinders about 6.5 cm in length and 2.5 cm in diameter; the end faces are surface ground parallel to ±0.002 cm. The Chelmsford granite samples
were dried in vacuum (< 1 torr) at 80*C for at least 12 hours before measuring velocity. A series of cores of Westerly granite were
thermally cycled in vacuum to maximum temperatures (Tmax) between 108 and 9530C. The heating and cooling were gradual over a 24-hour period, with Tmax held constant for approximately 12 hours. Each
end piece cut from a core used for elastic property measurements was subjected to the same thermal treatment as the core itself, and
then impregnated for use in the crack study. One MHz barium
titanate transducers were used to produce and receive the compressional wave and the estimated error in compressional velocity is less than
Compressibilities were measured on the same samples using a method similar to that of Brace (1965a). Thin copper jackets were seated on the samples to 5 Kb confining pressure. BLH Co. constantanfoil guages (type FAE-50-12S6 with epoxy backing) were then cemented with epoxy to the copper jackets, and again seated to 5 Kb, prior to making a run. A correction of + 0.54 x 10~ bar-l (Brace, 1964) was added to each compressibility value to compensate for the pressure effect on strain gauges. Strains were measured point by point on a BLH type 120C strain indicator
(Baldwin-Lima-Hamilton Corp., Waltham, Mass.). At low pressure where large strains are recorded, readings were taken every 25 to 50 bars; at high pressures where the strains are less and almost linear with pressure, readings were taken every few hundred bars. The estimated error in the compressibility
(slope of the strain-pressure curve) is 10% at low pressure (0 to 0.5Kb) but 1% at higher pressures.
Velocity and compressibility measurements were made in a simple piston-cylinder high pressure vessel. The pressure
medium was petroleum ether and pressure was measured on Heise bourdon tube guages, accurate to 1%. All samples were dried before jacketing. Pore pressures were therefore 1 bar, and
confining pressure equal to effective pressure for all measurements.
SAMPLE DESCRIPTIONS
Three Chelmsford granite samples were cored from a single large block in mutually perpendicular directions defined by the
normals to the rift, grain, and headgrain planes. The rift, grain, and headgrain are quarrying terms used to designate the easiest, intermediate, and most difficult planes of splitting, respectively (Skehan et al., 1964). A modal analysis for our sample of the Chelmsford granite is given in table 1.
The Westerly granite samples were cored parallel to each other from a single large block. All velocity and compressibility measurements were made parallel to the length of the cores, so that any angular crack or mineral anisotropy in the granite would not affect elastic property measurements from core to core. For example, the differences in the velocities of four cores dried at
100*C in vacuum were less than 1% at all confining pressures to 5 Kb. In the thin sections for the heated Westerly granite cores, no mineral alteration other than extensive micro-fracturing was
observed in the quartz, microcline, and plagioclase. The biotite and muscovite were somewhat altered. If major mineral alteration were present, it would appear as a difference in velocity values at high pressure, where all cracks are closed. We found that all
5 Kb velocity values were within 1% of each other. We thus assumed that little variations in mineralogy occurred from core to core, and any differences in the values of velocity or
compressibility at low pressure was due entirely to the differences in crack density. A modal analysis for the Westerly granite is given in table 1.
ANISOTROPY IN CRACK DISTRIBUTION


![Figure 4 (a). Compressional velocity [Vp (0)] and total crack length per unit area normal to the propagation direction](https://thumb-eu.123doks.com/thumbv2/123doknet/14757010.583075/86.918.202.667.109.723/figure-compressional-velocity-total-length-normal-propagation-direction.webp)
