HAL Id: hal-00003843
https://hal.archives-ouvertes.fr/hal-00003843
Preprint submitted on 10 Jan 2005
HAL is a multi-disciplinary open access
archive for the deposit and dissemination of
sci-entific research documents, whether they are
pub-lished or not. The documents may come from
teaching and research institutions in France or
abroad, or from public or private research centers.
L’archive ouverte pluridisciplinaire HAL, est
destinée au dépôt et à la diffusion de documents
scientifiques de niveau recherche, publiés ou non,
émanant des établissements d’enseignement et de
recherche français ou étrangers, des laboratoires
publics ou privés.
The sub-arcsecond dusty environment of Eta Carinae
O. Chesneau, M. Min, T. Herbst, L.B.F.M. Waters, D.J. Hillier, Ch. Leinert,
A. de Koter, I. Pascucci, W. Jaffe, R. Köhler, et al.
To cite this version:
O. Chesneau, M. Min, T. Herbst, L.B.F.M. Waters, D.J. Hillier, et al.. The sub-arcsecond dusty
environment of Eta Carinae. 2005. �hal-00003843�
ccsd-00003843, version 1 - 10 Jan 2005
Astronomy & Astrophysicsmanuscript no. EtaCar˙vReferee.hyper29424 January 10, 2005 (DOI: will be inserted by hand later)
The sub-arcsecond dusty environment of Eta Carinae
⋆
O. Chesneau
1, M. Min
2, T. Herbst
1, L.B.F.M. Waters
2, D.J. Hillier
3, Ch. Leinert
1, A. de Koter
2,
I. Pascucci
1, W. Jaffe
4, R. K¨
ohler
1, C. Alvarez
1, R. van Boekel
2, W. Brandner
1, U. Graser
1,
A.M. Lagrange
5, R. Lenzen
1, S. Morel
6, and M. Sch¨
oller
61 Max-Planck-Institut f¨ur Astronomie, K¨onigstuhl 17, D-69117 Heidelberg, Germany
e-mail: chesneau@mpia-hd.mpg.de
2 Sterrenkundig Instituut ‘Anton Pannekoek’, Kruislaan 403, 1098 SJ Amsterdam, The Netherlands
3 Department of Physics and Astronomy, University of Pittsburgh, 3941 O’Hara Street, Pittsburgh, PA 15260,
USA
4 Leiden Observatory, Niels Bohr weg 2, 2333 CA Leiden, The Netherlands,
5 Laboratoire d’Astrophysique de l’Observatoire de Grenoble, Universit´e J. Fourier, CNRS, BP 53, 38041 Grenoble
Cedex 9, France
6 European Southern Observatory, Casilla 19001, Santiago, Chile
Received; accepted
Abstract.The core of the nebula surrounding Eta Carinae has been observed with the VLT Adaptive Optics system NACO and with the interferometer VLTI/MIDI to constrain spatially and spectrally the warm dusty environment and the central object. In particular, narrow-band images at 3.74 µm and 4.05 µm reveal the butterfly shaped dusty environment close to the central star with unprecedented spatial resolution. A void whose radius corresponds to the expected sublimation radius has been discovered around the central source. Fringes have been obtained in the Mid-IR which reveal a correlated flux of about 100 Jy situated 0.′′3 south-east of the photocenter of the nebula
at 8.7 µm, which corresponds with the location of the star as seen in other wavelengths. This correlated flux is partly attributed to the central object, and these observations provide an upper limit for the SED of the central source from 2.2 µm to 13.5 µm. Moreover, we have been able to spectrally disperse the signal from the nebula itself at PA=318 degree, i.e. in the direction of the bipolar nebula (∼310◦) within the MIDI field of view of 3′′. A
large amount of corundum (Al2O3) is discovered, peaking at 0.′′6-1.′′2 south-east from the star, whereas the dust
content of the Weigelt blobs is dominated by silicates. We discuss the mechanisms of dust formation which are closely related to the geometry of this Butterfly nebulae.
Key words. Techniques: high angular resolution – Techniques: interferometric – Stars: early-type – Stars: winds, outflows – Stars: individual (η Carinae) Stars: circumstellar matter
1. Introduction
Eta Carinae is one of the best studied but least understood massive stars in our galaxy (Davidson and Humphreys, 1997). With a luminosity of 5×10⁶ L
⊙, it is one of the
most luminous stars and at 10 µm it is one of the brightest objects outside the solar system (Neugebauer & Westphal, 1969). Eta Car is classified as a Luminous Blue Variable (LBV). Among the most prominent characteristics of the unstable LBV phase are strong stellar winds and possible giant eruptions, which lead to the peeling off of the outer layers of the H-rich stellar envelope and the formation of small (∼0.2-2 pc) circumstellar nebulae (Nota et al. 1995).
Send offprint requests to: O. Chesneau
⋆
Based on observations collected at the European Southern Observatory, Chile
During the last two centuries, Eta Carinae has lived through a turbulent history. During the great eruption in the 1840s, the large bipolar nebula surrounding the central object (known as the “Homunculus”) was formed. Currently, the Homunculus lobes span a bit less than 20” on the sky (or 45000 AU at the system distance of 2.3 kpc) and they are largely responsible for the huge infrared lu-minosity of the system. The cause of the outburst remains unknown. The chemical composition of the Homunculus gas is not known, but some studies of the ionized outer ejecta (Lamers et al. 1998, Smith & Morse 2004 and ref-erences herein) suggest an overabundance of N and a se-vere depletion of C and O. Such an abundance pattern is consistent with CNO equilibrium burning, and suggests a highly evolved star at the base of the “explosion” .
The central source was studied by speckle interferome-try techniques, which revealed‘ a complex knotty structure
2 O. Chesneau et al.: The sub-arcsecond dusty environment of Eta Carinae
(Weigelt & Ebersberger 1986; Falcke et al. 1996). At first, three remarkably compact objects between 0.′′1 and 0.′′3
northwest of the star were isolated (the so-called BCD Weigelt blobs, the blob A being the star itself). Other similar but fainter objects have been detected since then (Weigelt et al 1995, 1996; Davidson et al 1997). It has been found that they are surprisingly bright ejecta mov-ing at low speeds (∼50 km.s−1) and that they belong to
the equatorial regions close to the star. Their separation from the star is typically 800 AU. The large scale equa-torial midplane debris-disc was nicely revealed with HST data (Morse et al. 1998).
The detection of a 5.52 year period in spectroscopy and near-infrared photometry (Damineli 1996) in Eta Carinae has been confirmed (Damineli et al. 2000 Davidson et al. 2000, Abraham et al. 2003, Corcoran 2003, Whitelock et al. 2003, 2004). The existence, mass and orbit of a com-panion and its impact on the behavior of the primary are still strongly disputed (e.g. Davidson 1999, Duncan et al. 1999; Stevens & Pittard 1999; Corcoran et al. 2001, Feast et al. 2001, Pittard & Corcoran 2002; Duncan & White 2003).
Dust plays a key role in the study of Eta Car. It in-tervenes in every observation as strong and patchy extinc-tion. It also allows the mass of the nebula to be deter-mined. Dust has also been frequently invoked as an im-portant process in explaining the photometric variability of Eta Car. However, the exact influence and location of dust formation/destruction has never been observed and established. Eta Car was observed with the Infrared Space Observatory Observatory (ISO) by Morris et al. (1999). The ISO spectra indicated that a much larger amount of matter should be present around Eta Car in the form of cold dust than previously estimated. Observations with higher spatial resolution by Smith et al. 2002a and Smith et al. 2003a showed a complex but organized dusty struc-ture within the three inner arcseconds. They showed that the dust content around the star is relatively limited and claimed that the two polar lobes should contain a large mass of relatively cool dust which could explain the ISO observations.
The high spatial resolution images of the equatorial regions are puzzling in several ways and raise new key questions in addition to the numerous ones still to be an-swered: Why was the eruption azimuthally asymmetric? Is the complex geometry of the dusty torus a consequence of the 1840 outburst or has it been affected by more recent events? What is the status of the complex Weigelt blob re-gion? Why did the star eject such slow-moving material in its equatorial zone? Does the star form dust continuously, or in episodes related to the mini outburst or the putative wind-wind interaction of Eta Car with its companion?
Improved spatial resolution is a major reason for the recent progress in our study of this emblematic star. HST STIS observations allowed the observation of the stellar spectrum of Eta Car roughly separated from its nearby ejecta (Hillier et al. 2001). Moreover this impressive in-strument has allowed the study of the stellar wind from
several latitude points of view in the nebulae by means of P Cygni absorption in Balmer lines reflected in the nebula (Smith et al. 2003). The asphericity of the wind proper-ties has been convincingly proven and Smith et al. sug-gested that the observed enhanced polar wind mass-loss rate may be explained through the theoretical frame de-veloped by Stan Owocki and collaborators (Dwarkadas & Owocki 2002). In their model, an enhanced mass loss oc-curs along the rotation axis, due to the large temperature difference between pole and equator, caused in turn by the rapid rotation of the star (the von Zeipel effect). Recently, the ionized stellar wind of Eta Carinae has been resolved on the 5 milliarcsecond (mas) scale at a wavelength of 2.2 µm with data obtained with VINCI on the Very Large Telescope Interferometer (VLTI, van Boekel et al. 2003). These observations are consistent with the presence of one star which has an ionized, moderately clumpy stel-lar wind with a mass loss rate of about 1.6x10⁻³M
⊙/yr.
This star-plus-wind spherical model, developed by Hillier et al. (2001), is also consistent with the HST STIS ob-servations of the central object. It has also been found that the star is elongated with a de-projected axis ratio of about 1.5 and that the axis itself is aligned with the axis of the large bipolar nebula. These VLTI observations gave an important confirmation of the wind geometry previously proposed by Smith et al. 2003.
The Hillier model suggests a flux level of 200-300 Jy at 10 µm and a spatial extent of the star plus wind of 10-15 mas diameter. These dimensions can only be probed using MIDI at the VLTI. The VINCI observations do not require the presence of other components in the core. In particular, no evidence for a hot dust disc or the puta-tive companion were found. However the presence of warm (300-600 K) dust in the immediate surroundings of Eta Car cannot be excluded since it is too cool to be detected at 2 µm.
The MIDI recombiner attached to the VLTI is the only instrument that is able to provide sufficient spatial and spectral resolution in the mid-infrared to disentangle the central components in the Eta Car system from the dusty environment. By definition an interferometer mea-sures a correlated flux, i.e. a flux originating from a suf-ficiently spatially unresolved source so that it is able to produce fringes. The measured correlated flux depends on the source total flux, its geometry and on the length and direction of the projected baseline(s) of the interferome-ter. We used the 102 m baseline between the telescopes Antu (UT1) and Melipal (UT3) to observe, for the first time, Eta Car with a resolution of 5-10 mas through the entire N band.
These observations have been complemented with broad- and narrow-band observations taken with the NAOS/CONICA (NACO) imager installed on UT4 (Kueyen), equipped with an adaptive optics (AO) system. The diffraction limit at 3.8 µm is about 100 mas. At this wavelength, the NACO adaptive optics is less constrained by the atmosphere, providing routinely an excellent cor-rection (Strehl ratio reaching 0.5). A careful deconvolution
O. Chesneau et al.: The sub-arcsecond dusty environment of Eta Carinae 3
procedure can improve it to about 50-80 mas. The NACO observations offer the opportunity to bridge the gap to the high resolution data of MIDI obtained with a sparse UV coverage.
In Section 2, we describe the observations and the data reduction. We analyze the NACO and MIDI images in Section 3, and then we examine the spatial distribution of the dust close to the star in Section 4. The information extracted from the correlated flux detected by MIDI is presented in Section 5. Finally in Section 6, we summarize the implications of the extracted information.
2. Observations and data reduction
2.1. NACO high resolution imaging
We have observed Eta Carinae with the adaptive op-tics camera NACO (Lenzen et al. 1998; Rousset et al. 2003) attached to the fourth 8.2 m Unit Telescope of the Very Large Telescope (VLT) of the European Southern Observatory (ESO), located at Cerro Paranal, Chile. NAOS was operated in the visual wavefront sensor con-figuration with the SBRC Aladdin 1024x1024 detector. We observed with J, H, Ks with the S13 camera and L′
broad-band filters and the NB 374, NB 405 narrow band filters that cover the emission lines Pfund γ and Bracket α respectively with the L27 camera. Using camera mode S13 and L27, the field of view was 14′′x14′′ and 28′′x28′′
re-spectively and the pixel scale was 13.25 and 27.1 mas per pixel respectively, a size sufficient to satisfy the Nyquist sampling criterion. 13.25 mas and 27.1 mas correspond to 30 and 62 AU respectively at the distance of 2.3 kpc. The AutoJitter mode was used, that is, at each exposure, the telescope moves according to a random pattern in a 10′′
box. Cross-correlation was used to recenter the images at about 0.15 pixel accuracy.
Table 1.Journal of observations with NACO/UT4. The phase within the 5.52-year cycle is computed from the ephemeris of Daminelli et al. (2000).
Star Filter Camera Time texp
15/16-11-2002, JD=2452625, Φ = 0.87 ηCar J S13 T08:12:00 86s ηCar H S13 T08:16:02 86s ηCar Ks S13 T08:04:21 86s ηCar L′ L27 T08:20:24 50s 16/17-11-2002, JD=2452626, Φ = 0.87 ηCar NB 374 L27 T08:47:00 50s ηCar NB 405 L27 T08:50:44 50s HD 101104 NB 374 L27 T09:10:17 50s HD 101104 NB 405 L27 T09:17:51 50s
A neutral density filter with an attenuation factor of 70 was used in order to avoid saturating the central peak
of the point spread function. However, the L′ image was
saturated within the first 0.′′5 even using the shortest
ex-posure time possible (0.17s). The NB 405 narrow-band image is not saturated but the peak of the central source is in the non-linearity regime of the detector. The NB 374 narrow-band image does not suffer from this effect due to the lower continuum and line fluxes at this wavelength and the slightly narrower filter.
Individual dithered exposures were co-added, resulting in a total exposure time texp shown in Table 1. The data
reduction has been performed using a self-developed IDL routine that processes the individual frames as follows. First, bad pixels are removed. Then, the sky is computed as the mean of the dithered exposures, and subtracted frame by frame. Finally, all the sky-subtracted frames are shifted and added together. The reduced broad-band im-ages are shown in Fig. 1. These broad-band imim-ages have not been photometrically calibrated. In Fig. 2, we show a color composite image of the filters L′, Brα and Pfγ.
The narrow-band images were deconvolved using the Richardson-Lucy algorithm (1974) using as Point Spread Function (PSF) the star HD 101104 observed immedi-ately after the source acquisition. The seeing during the 1h narrow-band images observations was stable, typically 0.5 arcsec and the measured FWHM of the PSF at 3.74 and 4.05µm is 97 and 107 mas respectively, i.e. very close to the diffraction limit of the telescope. By contrast, the FWHM of the central object in Eta Car images in J, H and Ks is 65, 74 and 77 mas respectively, to be compared with the diffraction limit of 33, 43 and 57 mas respectively. We applied only 40 iterations to enhance the spatial res-olution and contrast of the images, stopping before the appearance of any severe artifacts. The resulting Pfγ im-age is shown in Fig. 3. The quality of the deconvolution process can be judged by the comparison of the raw im-ages and the deconvolved ones at iterations 10 and 40 in Fig. 5.
The deconvolved images in the two filters are very sim-ilar apart from the larger extension of the central object at 4.05 µm. This is obviously an artefact of the deconvolution due to the fact that in the Br α filter, the 4-6 brightest pix-els have entered the non-linearity regime of the detector. Therefore the central object differs from the true telescope PSF referenced with the observation of HD 101104. The distortion of the central peak mimics the flux emitted from a resolved object with the central object appearing larger in the Br α filter than in the Pfγ one (where the FWHM of the peak is about 60 mas, i.e. 60% of the diffraction limit). This effect is localized and does not affect the rest of the deconvolved image. Indeed one can check in Fig. 5 that all the structures are in common between both filters. We attempted to flux-calibrate the NB 374 and NB 405 images by using the AO calibrator, HD 101104 ob-served immediately after Eta Car. HD 101104 is a M4III star (Dumm & Schild 1998) which has been chosen for brightness considerations and not with the purpose of pho-tometric calibration. Hence this target is not well suited for such a task but we attempted anyway to calibrate the
4 O. Chesneau et al.: The sub-arcsecond dusty environment of Eta Carinae
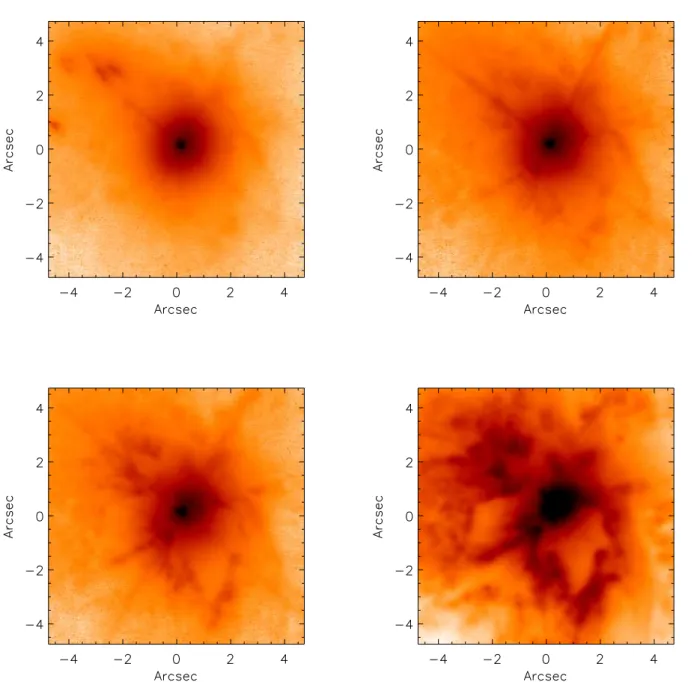
Fig. 1.From left to right and up to down, J, H, Ks, L′ images from NACO shown in logarithmic inverted scale. The
L′ image is slightly overexposed in spite of the smallest possible integration time.
flux received by the narrow-band filters. From the typical intrinsic color K-L′=0.21 of an M4III star, and measured
K-band magnitude of mK=0.0±0.1., its L′ magnitude is
estimated to be mL′=−0.2±0.1. Within the L’ filter, the
3.74 µm region of a M4 star is relatively free from lines, but the 4.05 µm region is strongly affected (Fluks et al. 1994). Therefore, the intrinsic color of HD 101104 within the NB 374 filter is about K-NB 374=0.15±0.1, which means that the magnitude of HD 101104 within this filter is m3.74=−0.15±0.1.
We estimated the L′ magnitude of Eta Car to be L′
=-1.85±0.2 within a circle of 3′′, based on the flux received
in the L′ filters in the non-saturated regions and also
from the flux received in the 3.74 µm filter. The evolu-tion of the magnitude with the encircled flux is shown in Fig. 4. A non-negligible flux is of course emitted out-side the studied regions but the dynamic reached with the NACO short exposures is too limited to allow a good pho-tometric estimation outside this radius and the photome-try computed here is probably underestimated. The quasi-simultaneous L band magnitudes (centered at 3.45 µm and not at 3.8 µm) from Whitelock et al. 2004 are -1.737 for JD=2452603.60 (November 25, 2002) and -1.761 for JD=2452661.57 (January 22, 2003). By scaling the PSF
O. Chesneau et al.: The sub-arcsecond dusty environment of Eta Carinae 5
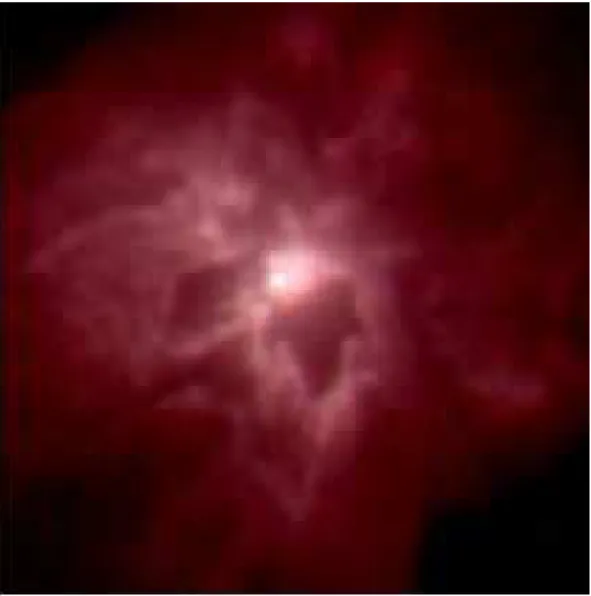
Fig. 2. Color image combining the flux from L′ (red) and Brα (green) and Pfγ (blue) filters. At these wavelengths,
the hydrogen emission represents only a small amount of the flux: about 10% and 2% of flux recorded with the Brα and Pfγ filter respectively. The L′ filter shows deeper details of the nebula but is saturated in the 0.′′5x0.′′5 core. The
white bar represents 1′′.
flux to the flux of the central source we estimate the stel-lar contribution in the NB 374 filter to be 520±70Jy or m3.74=−0.8±0.3.
2.2. MIDI observations
2.2.1. Observing sequence
Eta Car was also observed with MIDI (Leinert, Graser et al. 2003a and 2003b) the mid-infrared recombiner of the Very Large Telescope (VLT). The VLTI/MIDI interfer-ometer operates like a classical Michelson interferinterfer-ometer to combine the MIR light (N band, 7.5 - 14 µm) from two VLT Unit Telescopes (UTs). For the observations pre-sented here, the UT1 and the UT3 telescopes were used, separated by 102 m with the baseline oriented 56◦ (E of
N).
The observing sequence, typical of interferometric measurements, is influenced by the design of the instru-ment (Leinert et al. 2003a, 2003b, Przygodda et al. 2003). The chopping mode (f=2Hz, angle -90 degree) is used to visualize and accurately point at the star. The detector pixel size projected on the sky is 98 mas (measured by observations of close visual binaries) and the field of view (FOV) is limited to 3”. The number of frames recorded for each image was generally 2000, and the exposure time per frame is by default 4 ms to avoid fast background sat-uration. If the result of the centering is not satisfactory, the procedure is started again.
Then, the MIDI beam combiner, the wide slit (0.′′6×3′′), and the NaCl prism are inserted to disperse the
light and search for the fringes by moving the VLTI delay lines. The resulting spectra have a resolution λ/∆λ ∼30. When searching for the fringe signal, the large delay line of
6 O. Chesneau et al.: The sub-arcsecond dusty environment of Eta Carinae
Fig. 3. Pfγ deconvolved image. The resolution achieved is in the order of 60 mas. To enhance the contrast, the image I1/4 is shown. The color scale is expressed in Jy/arcsec2. Taken into account the large error bars of the photometry,
this scale is only indicative of the flux.
the VLTI is moved to compensate for Earth rotation and atmospheric delays, while the MIDI internal piezo-driven delay line is driven in scans to create the fringe pattern. Once the fringes are found a file is recorded while MIDI is self-tracking them. Finally, two other files are recorded for the photometry. In the first file, one shutter only is opened, corresponding to the calibration of the flux from UT1 and the flux is then divided by the MIDI beam split-ter and falls on two different regions of the detector. The total flux is determined separately by chopping between the object and an empty region of the sky, and determin-ing the source flux by subtraction. Then the same proce-dure is applied with UT3.
A list of all observations is presented in Table 2. The scientific observations have been mainly conducted in the night of the 16th and 17th of June 2003. Unfortunately,
Eta Car was only observable at the very beginning of the night and has consequently been observed with two close sky projected baselines of 74 m and 78 m and PA=57◦and
62◦ respectively. We also report some observations which
were performed in February 2003 during the first MIDI commissioning run (see Sec. 5.1). These observations were carried out when the MIDI fringe tracker was not perform-ing well and the sensitivity is quite limited compared to the measurements performed in June. However, some data recorded in undispersed mode are of particular interest and are presented here (Sect. 5.1).
2.2.2. Acquisition images
Custom software, written in the IDL language was used to reduce the images, spectra and fringe data. MIDI is
O. Chesneau et al.: The sub-arcsecond dusty environment of Eta Carinae 7
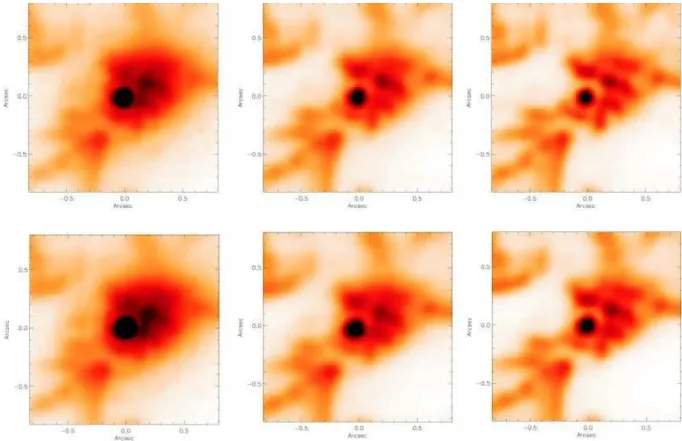
Fig. 5. Zoom into the deconvolved images from the NB 3.74 (up) and NB 4.05 (bottom) filters. The raw images are shown in the left side, the deconvolved images at iteration 10 and 40 are shown in the middle and the in the right side. The resulted images from the two filters are fairly similar except for the size of the central source which is 25% larger in Brα due to a slight non-linearity of the detector at high flux regime.
Fig. 4. Evolution of the L’ magnitude based on aperture photometry with increasing radius. The integrated flux within a circle of 3′′is L′=-1.85±0.2.
a relatively new and unique instrument. The MIDI data reduction is described more extensively in Leinert et al. (2004) and a devoted paper is in preparation.
The first step of the reduction is to read in the ac-quisition datasets, average the frames on the target and the frames on the sky, and subtract the average sky frame
from the average target frame. Despite the high number of optical elements in the VLTI/MIDI system (33 in to-tal), the quality of the 8.7 µm images is comparable to the best Mid-IR images published to date (Smith et al. 2002a). The spatial resolution has been slightly increased by per-forming a deconvolution using 40 iterations of the Lucy-Richardson algorithm and the result is shown in Fig. 9. The spatial resolution reached after the treatment is about 150 mas. Most MIDI targets are unresolved by a single 8 m telescope; thus many PSF samples are available for testing the quality of the deconvolution process. We used as PSF reference the acquisition images of HD 120323 (2 Cen, M4.5III, m8.7=-1.8), HD 148478 (α Sco, M1.5Ib, m8.7
=-4.34) and HD 151680 (ǫ Sco, K2.5III, m8.7=-0.37
extrap-olated).
The 8.7 µm magnitudes have been extracted from the Catalog of Infrared Observations (Edition 5, Gezari+ 1999). Accurate 8.7 µm photometry of the MIDI acqui-sition images is difficult. First, the acquiacqui-sitions from Eta Car and α Sco were slightly saturated, which affects the linearity of the detector response but also its local off-set. Then, due to a pupil mismatch, the FOV and also the background level are different between the two tele-scopes. For UT3, the FOV was about 3′′×2′′ while for
UT1 the FOV was less than 2′′×2′′. We end up with an
8 O. Chesneau et al.: The sub-arcsecond dusty environment of Eta Carinae
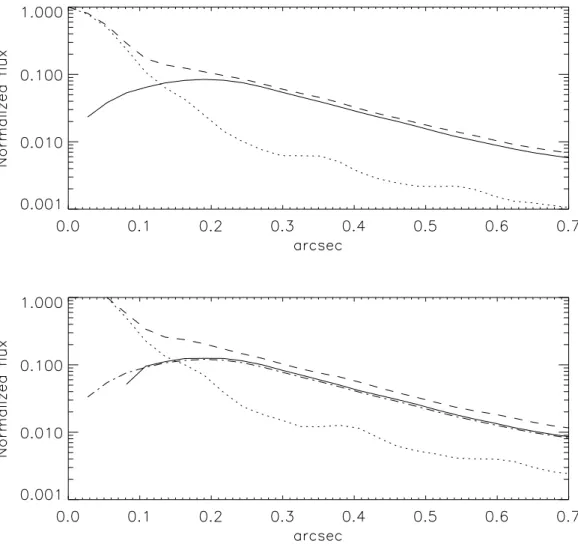
Fig. 6. On the top, radial flux normalized to the peak with NB 3.74 filter for Eta Car (dashed line), and the PSF HD 101104 (dotted line) and their subtraction (solid line). Close to the source, a strong decrease of the flux is clearly seen that we attribute to the dust sublimation region at about 0.′′1 (230 AU). On the bottom panel the same treatment
is applied to the NB 4.05 images. However, the flux reference is chosen to be at ∼0.′′05 (2 pixels) from the peak in
order to account for the non-linearity of the detector at maximum. The dashed-dotted curve is the residual of the NB 3.74 filter subtraction scaled for comparison. The two curves agree fairly well and the contribution of the Brα line is hardly visible.
of -5.65±0.3 and -5.45±0.3 respectively. One of the MIDI acquisition images from UT3 is shown in Fig. 10 and the best deconvolved 8.7 µm image is shown in Fig. 9. The flux scale given in Fig. 9 should be considered only as an indication due to the large errors mentioned above and also due to the further difficulties in the deconvolution process.
2.2.3. Dispersed photometry
The second reduction step consists of reading the dis-persed photometric datasets used for the calibration of the contrast of the dispersed fringes. We use the same proce-dure to average the frames on the target and the frames on the sky, and then subtract the average sky frame from
the average target frame. Eta Car is a complex extended object which requires a dedicated procedure of reduction. In the following we describe the ’classical’ data reduction of MIDI data applied for sources unresolved by a single dish telescope, i.e. for the calibrators.
In the averaged, subtracted frame, the wavelength axis is oriented along the horizontal detector axis. For each de-tector column, the vertical centroid and width of the spec-trum are estimated by fitting a Gaussian function to the peak. The centroid position in all illuminated columns is fitted with a quadratic polynomial as a function of column number, while the width is fitted by a linear function. This procedure is carried out on both photometric datasets (corresponding to telescope UT1 and UT3 respectively). Both fits are averaged and used to create a 2-dimensional
O. Chesneau et al.: The sub-arcsecond dusty environment of Eta Carinae 9
Table 2. Journal of observations with MIDI/UT1-UT3. The phase within the 5.52-year cycle is computed from the ephemeris of Daminelli et al. (2000).
Star Template Time Frames
23/24-02-2003, JD=2452695, Φ = 0.91, B=75m, Θ = 60◦
ηCar Search. undispersed T07:06:22 9000 ηCar Track. undispersed T07:09:25 9000 ηCar Track. dispersed T07:15:01 9000 ηCar Search. undispersed T07:20:01 2800 ηCar Search. undispersed T07:24:03 2800
ηCar Phot. UT1 disp. T07:36:42 400
ηCar Phot. UT3 disp. T07:38:59 400
12/13-06-2003, JD=2452893, Φ = 0.96, B=74m, Θ = 62◦
ηCar Track. dispersed T00:31:24 9000 ηCar Track. dispersed T00:35:43 10000 ηCar Track. dispersed T00:39:17 7500
ηCar Phot. UT1 disp. T00:43:53 3000
ηCar Phot. UT3 disp. T00:45:55 3000
14/15-06-2003, JD=2452806, Φ = 0.96, B=78m, Θ = 56◦
HD 120323 Acquisition N8.7µm T23:08:03 2000 HD 120323 Acquisition N8.7µm T23:09:16 2000 HD 120323 Track. dispersed T23:18:08 12000 HD 120323 Phot. UT1 disp. T23:23:24 3000 HD 120323 Phot. UT3 disp. T23:25:28 3000 ηCar Acquisition N8.7µm T23:47:45 2000 ηCar Acquisition N8.7µm T23:48:51 2000 ηCar Track. dispersed T23:55:47 12000
ηCar Phot. UT1 disp. T00:02:10 3000
ηCar Phot. UT3 disp. T00:03:49 3000
HD 148478 Acquisition N8.7µm T00:14:53 2000 HD 148478 Acquisition N8.7µm T00:17:01 2000 HD 151680 Acquisition N8.7µm T00:24:12 2000 HD 151680 Acquisition N8.7µm T00:25:23 2000 HD 151680 Track. dispersed T00:32:49 12000 HD 151680 Phot. UT1 disp. T00:38:22 2000 HD 151680 Phot. UT3 disp. T00:40:08 2000 HD 167618 Acquisition N8.7µm T01:18:33 2000 HD 167618 Acquisition N8.7µm T01:19:41 2000 HD 167618 Track. dispersed T01:38:28 12000 HD 167618 Phot. UT1 disp. T01:33:15 3000 HD 167618 Phot. UT3 disp. T01:35:28 3000 HD 168454 Acquisition N8.7µm T02:35:55 2000 HD 168454 Acquisition N8.7µm T02:37:12 2000 HD 168454 Track. dispersed T02:40:47 12000 HD 168454 Phot. UT1 disp. T02:50:18 3000 HD 168454 Phot. UT3 disp. T02:52:34 3000
weighting mask consisting of a gaussian function with the average position and width of the spectra for each column. This mask is applied to both photometric and interfero-metric data to supress noise in regions where few source photons fall. (Sect. 2.2.5).
We used HD 167618 (η Sgr) and HD 168454 (δ Sgr) as calibrators for the dispersed photometry. They are sec-ondary flux calibrators which were observed several times during the June run and have been calibrated using two primary calibrators (α Aql and HD 177716) for which very
good quality spectra are available (Cohen et al. 1998). The airmass correction is extracted from the observations of HD 168454 at two different airmasses.
Considering the very good atmospheric conditions en-countered during this observing run, the N-band images are close to the diffraction limit. This implies that we can obtain about 8-10 independent spectra of the nebula with a mean spatial FWHM of about 250 mas. This informa-tion is valuable for the study of the nebula dust content and provide complementary information to the correlated flux study described in Sec. 5.
A set of spatially resolved spectra of Eta Car were extracted along the slit direction using a modified ver-sion of the MIDI photometric algorithm. A ‘point source’ weighting mask was constructed from a calibrator, and then shifted along the slit to extract a sequence of spectra from Eta Car itself. The stability of MIDI within its cryo-stat permits such a procedure. The purpose is to avoid a bias on the trace due to the shift of the emission photocen-ter with wavelength in the N band towards the north-west, due to the increasing contribution of colder dust situated in the Weigelt complex (Smith et al. 2002a).
The slit was positioned at PA=140◦±3◦, i.e. very close
to the nebular principal orientation. Nine spectra with suf-ficient SNR have been extracted separated by 400 mas, the five central ones using a gaussian weighting function with a FWHM of 200 mas and the four external ones with a slightly larger beam in order to increase the SNR (which implies a slight cross-talk between the beams). The pa-rameters of the apertures are reported in Tab 4 and the spectra are presented in Fig. 11.
2.2.4. Undispersed correlated flux
The spatial distribution of the fringes detected by MIDI with the 8.7 µm filter is shown in Fig. 12. The data were recorded during February commissioning time when the main observing modes of MIDI had not yet ‘crystallized’. This figure is very interesting because it is one of the first wide field interferometric detections of fringes reported to date. The fringes are detected by measuring the fluctua-tion of the detector power, pixel-by-pixel, as the OPD is scanned. The level of the detector, background and sky noise are clearly identified and well constrained by the multiple tests performed on the sky during MIDI commis-sioning. By choosing the frames for which fringes are de-tected we can localize the fringe signal to an area of about a PSF size. Since fringes are detected only in the com-mon part of the beams coming from the individual UTs, the spot visible in calibrators exhibits a sightly smaller FWHM than in the non-interferometric acquisition im-ages. We have checked that the calibrators observed before and after Eta Car have a similar extension by performing a 2D gaussian fit. Due to the individual pointing errors from each telescope, the overlap spot is not necessarily perfectly symmetric, but no asymmetry larger than 15% is observable. In contrast to calibrators, the fringes from
10 O. Chesneau et al.: The sub-arcsecond dusty environment of Eta Carinae
Eta Car are more extended than the acquisition PSF. To verify the extension of this signal we have first removed a noise pattern extracted at OPD positions farther than 1 millimeter away from the white light fringe (OPD=0), i.e. at a location where no fringes are present. A typi-cal spot extracted from a typi-calibrator was then centered on the maximum, scaled and subtracted from the figure. This technique is similar to the one used to remove a PSF from images.
2.2.5. Dispersed correlated flux
Each frame of the fringe data is reduced to a one-dimensional spectrum by multiplying it with the mask, integrating in the direction perpendicular to the spec-tral dispersion, and finally subtracting the two oppositely phased output channels of the beam combiner from each other. The spectra from each scan with the piezo-mounted mirrors were collected and fourier-transformed with re-spect to OPD. The fringe amplitude at each wavelength is then obtained from the power spectrum. We typically summed four pixels in the dispersion direction to improve the signal-to-noise ratio.
The correlated flux varies from scan to scan due to the variable overlap of the two telescope beams. The scans used to estimate the flux were selected based on the white-light fringe amplitude, i.e. the fringe amplitude that is seen after integrating over all usable wavelengths. The his-togram of all white-light fringe amplitudes within a fringe track dataset usually shows a small peak near zero, and a broad peak at higher amplitudes. We interactively set a threshold just below this broad peak, and average the fringe amplitudes of all scans with a white-light fringe am-plitude higher than this threshold to give the final fringe amplitude as a function of wavelength. The raw visibility is obtained by dividing the fringe amplitude by the to-tal photometric flux. The calibrated visibility is obtained by dividing the raw visibility of an object by that of an unresolved calibrator. The photometrically calibrated flux creating the fringes is called correlated flux.
The MIDI reduction software has been modified to al-low it to handle spatially extended fringes in the slit di-rection. The extraction mask, which is usually wide in the slit direction to include all the light from the sources has been narrowed to cover no more than 3-4 pixels (i.e. 0.′′
3-0.′′4) along the slit. We used the set of masks created for
the photometric study described in table 4. At first we checked that the calibrated visibilities of calibrators de-rived with this mask were identical to the ones dede-rived with the normal width. It turned out that the instrumen-tal visibility is slightly higher (about 5-10%, depending on the wavelength) when the mask is narrower. This bias is perfectly corrected when the visibilities are calibrated, i.e. when the raw visibility of the science object is divided by the calibrator visibility.
A binning of 6 pixels in the dispersion direction was used to increase the signal, providing a spectral resolution
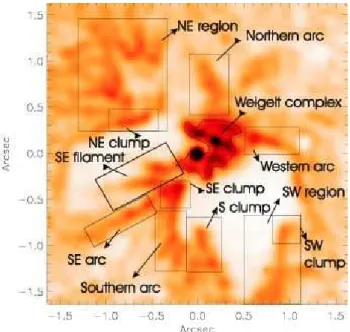
Fig. 7. Location of interesting regions in the ’butterfly’ dusty nebula close to Eta Car. The naming convention is partly based on Fig. 4 of Smith et al. (2003a).
of about 15. The visibilities were calibrated and multiplied by the flux calibrated spectra shown in Fig. 11. The aper-ture 5 is placed at the maximum of correlated flux which coincides with the peak of the deconvolved 8.7 µm image.
3. Description of the images
Our NACO observations cover at unprecedented spatial resolution the spectral region of transition between the optical and near-IR, dominated by scattering processes while the MIDI observations cover the mid-IR thermal emission from the dust regions. The general appearance of the J, H, Ks images is indeed very different from that of the L′ and the 8.7 µm images.
In the near-infrared, the central 1.′′5 of the nebula are
dominated by a point source. A complex ’butterfly’ shape morphology in the immediate vicinity emerges clearly only at around 2 µm, though some features can already be traced at shorter wavelengths (Fig. 1).
In Fig. 7, we have labelled the structures seen in our deconvolved NACO 3.74 µm image in order to guide the discussion on the geometry of the dusty nebula.
3.1. Weigelt blobs and other dusty clumps
The core (central 1′′× 1′′ aperture) is dominated in the
northwest by a region of large dust content which was not resolved by Smith et al. (2003a) but is clearly visible in our NACO data which we call the ’Weigelt’ complex (Weigelt & Ebersberger 1986; Hofmann & Weigelt 1988). The ’Weigelt complex’ dominates the stellar flux in the mid-infrared, shifting the core photocenter from the star to about 0.′′3 north, as seen by the difference between the
O. Chesneau et al.: The sub-arcsecond dusty environment of Eta Carinae 11
raw and deconvolved MIDI images at 8.7 µm (Fig. 10 and Fig. 9). The Weigelt blobs are small, dense knots of dust and gas within about 1000 AU, i.e 0.′′3 northwest from the
star.
The positions and hence the velocities of the Weigelt blobs were studied by further speckle observations about 10 years after the initial ones (Weigelt et al. 1995, 1996) and also by HST imaging and spectroscopy (Davidson et al. 1997, Dorland et al. 2004, Smith et al. 2004a). These observations demonstrated that the ejecta are mov-ing slowly (less than 50 km.s−1from the star) on the
equa-torial plane. This means that our image of the Weigelt complex seen at 4 µm can probably be compared to the optical ones detected some years ago. An attempt of this kind is shown in Fig. 8 by using the images published in Morse et al. 1998.
The position of the largest structures (clumps) can be measured accurately from our images. The brighter clump can be related to the Weigelt clump C, but the clump B is clearly absent. The location of clump D is close but not coincident to a bright clump in the ‘hook’ shaped region directly north of the star. The hook is also very close to a structure called the UV knot in the image published by Morse et al. 1998 (Fig. 8). It must be stressed out that this comparison is based on images separated in time. However Dorland et al. (2004) have confirmed that the proper mo-tion of these structures is at most ≃5 mas per year. In a span of 5 years the clumps have moved by at most 25 mas, i.e. less than one pixel on the NACO detector. We are convinced that the structures seen in the NIR are corre-lated to the ones seen in the visible or UV. The visible structures, dominated by scattering, trace the walls of the dense clumps of dust. We propose to call the two brightest NIR clumps to the north-east of the star clumps C’ and D’ since they do not coincide with the visible ones but are probably related to them.
Astrometric measurements of the Weigelt blobs C and D have been recently reported by Dorland, Currie and Hajian (2004) and by Smith et al. (2004a). Both used HST data to measure the relative proper motions of blob C and blob D with respect to the star. The position angles are consistent with linear, radial, ballistic motions and no evidence of azimuthal motion was detected. The weighted position angle measurements from Dorland et al. for blobs C and D are PAC= 300.6±0.6 and PAD= 336.8±0.4
de-grees. Dorland et al. used a least-squares three-parameter fit of a two-dimensional Gaussian with fixed width and re-moved the strong diffusive background by using a median filter method.
We applied a similar method on our NACO images, i.e. on the two deconvolved images of the narrow band fil-ters at 3.74 µm and 4.05 µm and on the Ks image (with-out median filtering). This method was not possible for the saturated L′ filter. We also used a two-dimensional
Gaussian for the fits with the FWHM taken as a free pa-rameter. These measurements are a starting point to a further monitoring of these structures by NACO. We de-cided to concentrate on the two brightest blobs D’ and C’
and on the bright southern clump that we call SE (Fig. 7). The results are presented in table 3.
While Dorland et al. and Smith et al. propose different ejection dates for the clumps of 1941 and 1890, respec-tively, their measured values of 1934±20 and 1907±12 agree within statistical errors. In visible and UV spec-tral regions, the blob emission is dominated by the ab-lated halo while the dusty clumps are traced by NACO. The consequence is a large variability in shapes and hence centroid positions of the blobs seen with different filters. NACO has the great advantage of providing the location of the dust clumps in the NIR with a spatial resolution comparable to that of the HST. The contribution of the scattered light in L′ is drastically reduced compared to
shorter wavelengths. NACO measurements not yet able to provide further constraints of the outburst but soon will be. More effort should be put in to decreasing the er-ror bars of single position measurements by using different methods of position determination, as shown by Smith et al.. We thus advocate a monitoring of the Weigelt complex by NACO at least during a span of 6 years which would correspond also to the course of the 5.52-year motion of the binary.
3.2. Arcs and filaments
The geometrical aspect of the dusty nebula is impressive. It is characterized in both the NACO and MIDI images by two particularly dark regions in the east and south-west, and a third one in the north-east where a faint nebulosity is visible, suggesting that these regions are also relatively devoid of dust.
The resemblance between the MIDI deconvolved image (Fig. 9) and the NACO one is striking. A large part of the regions denoted in Fig. 7 can be recognized (some of them interrupted by the limits of the MIDI FOV): the Weigelt complex, the NE and SW regions, the Northern and Western arcs, the S clump.
It must be pointed out that the brighter clumps dis-cussed in the previous section are just the emerged part of a fainter nebulosity contained within well-defined borders of about 0.′′5×0.′′5 shown in Fig. 7. This triangle-like
neb-ulosity seems to be connected to the south with a fainter structure, the ‘SE filament’ apparently aligned in the same direction as the Weigelt blobs complex (PA∼300-330◦).
There is no clear separation between the bright northern Weigelt blobs complex and this SE filament. Moreover, the bright Weigelt complex clearly embeds the star itself and the most probable explanation of the faintness of the SE filament is the small amount of material involved in this structure. The Weigelt complex appears interrupted in the north-east of the star giving birth to a ‘hook’ region directly to the North, reminiscent of the one detected in UV by Morse et al. 1998 (see also Fig. 7).
Of particular interest is the bright spot at about 0.′′
5-0.′′8 southeast of the star, seen particularly well in our
12 O. Chesneau et al.: The sub-arcsecond dusty environment of Eta Carinae
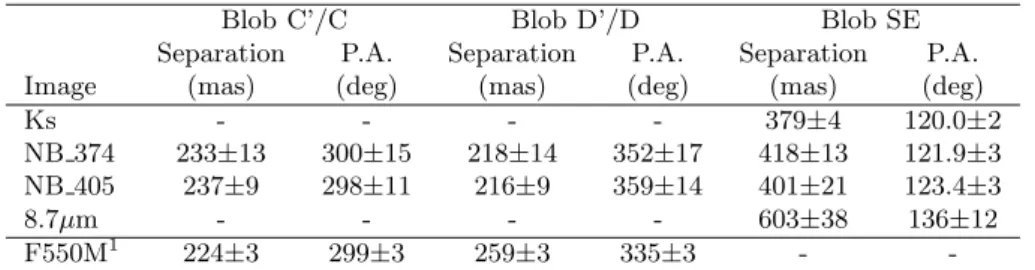
Table 3.Separation and position angle measurements with respect to the star of several blobs seen in our images.
Blob C’/C Blob D’/D Blob SE
Separation P.A. Separation P.A. Separation P.A.
Image (mas) (deg) (mas) (deg) (mas) (deg)
Ks - - - - 379±4 120.0±2
NB 374 233±13 300±15 218±14 352±17 418±13 121.9±3
NB 405 237±9 298±11 216±9 359±14 401±21 123.4±3
8.7µm - - - - 603±38 136±12
F550M1 224±3 299±3 259±3 335±3 -
-1- Optical data from HST taken in 2002.786 from Smith et al. 2004a.
Fig. 8. Comparison of the 3.74 µm deconvolved NACO image (in contours) with the highest resolution HST images (background, from Morse et al. 1999) at large (left) and small (right) scales. The location of the dusty clumps does not coincide with that of the Weigelt blobs, but their structure is somehow complementary to the image. The optical/UV blobs are probably hot regions less shielded from the central star’s UV flux which could coincide with the dust clump surfaces facing the star. This is particularly true for Weigelt blobs C and D.
and Brα images. This blob connects two well-defined arcs: the Southern arc and the SE arc. The SE arc, brighter in the NIR has already been denoted as ‘jet’ from images at lower resolution (see Rigault & Gejring 1995 or Fig.1 in Smith & Gehrz 2000 for instance).
The Southern and SE arcs seem to partly hide the SE filament and seem to be in front of it. Moreover they are connected in a complex but traceable way to the northern arcs. These arcs are apparently hidden (or embedded) in the north by the Weigelt complex. This is particularly visible in the 3.74 µm and 4.05 µm images (Fig. 5), but some hints can also be extracted from the MIDI image.
3.3. Dust sublimation radius
Our NACO Pfγ and Brα deconvolved images show no ev-idence for significant emission in the inner regions (see Fig. 6). The radius where the flux inflexion point is lo-cated is about 130-170 mas in both deconvolved images. The width of the empty regions is not symmetric around the source, it is more extended to the north than to the south. It could be argued that this gap is an artefact of the deconvolution process but a decrease of emissivity is already visible in the radial profiles shown in Fig. 6, ex-tracted from the raw images. Moreover, we carried out further tests to verify the reality of the feature. While in-creasing the number of iterations by steps, we checked that at each time the gap remained stable in size and shape. Until the appearance of strong artifacts affecting the whole
O. Chesneau et al.: The sub-arcsecond dusty environment of Eta Carinae 13
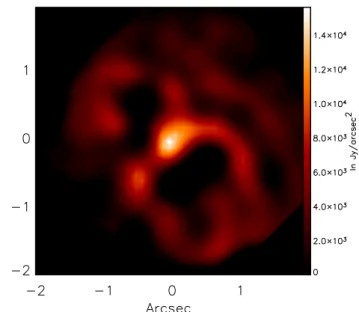
Fig. 9. Deconvolved acquisition image of Eta Car with the 8.7 µm filter (UT3). In order to enhance the contrast, the image I1/4is shown but the color scale is expressed in Jy/arcsec2. The bright spot which emerges in this image
is in the position of the central star and at the location where a strong correlated flux has been detected by MIDI (see Fig. 12). The image has been de-rotated with respect to Fig. 10 so that the north is up and east is left.
image, this feature behaves like any other: its shape is slowly distorted, but its position remains essentially unaf-fected. The same behavior is seen in the deconvolution of both the Pfγ and the Brα images, but the artifacts appear earlier for the slightly overexposed Brα image.
Indeed, the presence of a gap of this size does not con-tradict our other knowledge of Eta Car. The deconvolved Pfγ and Brα images reach a spatial resolution of about 60 mas. This scale is particularly interesting since it is close to the expected radius where dust sublimates.
Using the approximation of a black-body equilibrium temperature, we end-up with the formula presented by Smith et al. 2003a (Eq.3):
Tdust≃13100 × R−1/2AU K (1)
We see that a dust temperature of about 400 K is ex-pected at 900 AU or 0.′′4 (if shielding from closer material
is not taken into account). Taking a typical sublimation temperature of about 1000 K, we find that this radius is expected at about 150 AU, i.e. 70 mas from the cen-tral star. Of course, the dust sublimation radius is only an indicative distance; the amount of dust will steadily decrease as the temperature increases beyond the subli-mation point of each dust species. In the following section
we provide some indications on the dust composition in the nebula.
This gap between the central source and the Weigelt complex may have another explanation. Dorland et al. (2004) and Smith et al. (2004a) have presented evidences that the Weigelt blobs C and D were created in an out-burst, either in 1941, or in 1890. If no dust has formed in the equatorial plane since then, then the gap is a natural consequence of the proper motion of the Weigelt blobs and not related to the temperature near the central star.
The question of the vertical extent of the Weigelt com-plex is also a difficult one. Hillier and Allen (1992 ) ar-gued that the central source is occulted by dust, while the Weigelt blobs suffer much less circumstellar extinc-tion. The location of this extinction is somewhat uncer-tain. Why should the star be occulted, but not the Weigelt blobs? Moreover the central source has brightened appre-ciably over the last decade. At V it is now a factor of 3 brighter (see Davidson et al 1999, and recently Martin et al. 2004). The simplest interpretation is that the extinc-tion is decreased, and hence dust is evaporating, leading to a larger void region around the star. Interestingly, van Genderen & Sterken have shown that this brightening oc-curred in a relatively short time after the 1998.0 spectro-scopic event attributed to the periastron passage a hot companion (see also Sec. 6.3).
In the deconvolved images (see Fig. 5) a large part of the nebulosity has disappeared in the treatment, but in Fig. 2 we can see that the star is somewhat embedded. In L′ the dust becomes more and more optically thin and
the regions towards the line of sight are difficult to detect. This can be done only by a careful study involving several filters, to map the extinction and evaluate the amount of scattering. This study could be performed with carefully calibrated NACO images but this implies dedicated ob-servations which will be postponed to a future study.
4. Dust composition and temperature
In this section we will concentrate on the interpretation of the 9 single-dish N band MIDI spectra. The N band spec-tra of Eta Car are characterized by a strong, smooth fea-ture around 10.5 µm. The feafea-ture has an unusually broad wing at the long wavelength side. The 9 MIDI spectra, shown in Fig. 10, display a change in the emission fea-ture as a function of position in the nebulae. From the north to the south the peak position is shifted from 10.5 to 11.5 µm.
In order to study the mineralogy of the dust we made an attempt to fit the 10 µm spectra. The spectrum in the 10 µm region is dominated by thermal emission from warm (T > 250 K), small (a < 2 µm) dust grains. Colder grains will emit most radiation at longer wavelengths while big dust grains will contribute mainly to the continuum which makes the determination of their mineralogy diffi-cult. We use here a very simple model consisting of a single blackbody source function with two different dust species, amorphous olivine (MgFeSiO4) and corundum (Al2O3).
14 O. Chesneau et al.: The sub-arcsecond dusty environment of Eta Carinae
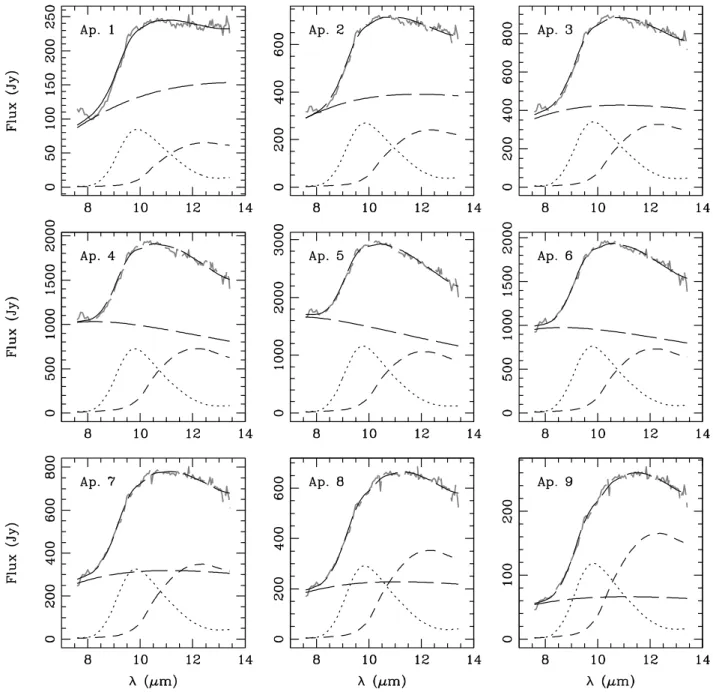
Fig. 11. Spatially resolved MIDI spectra expressed in Jansky (grey lines) together with the spectra of the best fit models (solid line). The dotted line shows the olivine contribution, the dashed line the corundum contribution and the long-dashed shows the continuum emission. The spectra are extracted from the north-west (upper left panel) to the south-east (lower right panel). The slit is aligned to the nebula. The 9 spectra are spaced by 0.′′4, the maximum
flux in the MIR is in aperture 5 while the star is located in aperture 6. The SE clump and the southern arcs spectra are in apertures 7, 8 and 9.
We also add continuum emission with the same temper-ature. The choice of the dust components will be dis-cussed below. We take a single grain size of 0.1 µm. Using a more complicated source function involving a distribu-tion of temperatures or by including more dust species or grain sizes did not improve the fit significantly. By in-cluding more dust species we find that some trace of crys-talline olivine might be present but with an abundance less than 5%. In order to calculate the emission
efficien-cies of the dust grains, we have to assume a shape of the dust grains. The choice of the particle shape model can be crucial in obtaining reliable results. However, since both dust components used here have a rather smooth behavior we restrict ourselves to simple, frequently used methods to calculate the emissivities. The best fitting results were ob-tained if we take the amorphous olivine grains to be homo-geneous and spherical. For the corundum grains we had to use a so-called continuous distribution of ellipsoids (CDE)
O. Chesneau et al.: The sub-arcsecond dusty environment of Eta Carinae 15
Fig. 10.MIDI 8.7 µm acquisition image. The north points towards the upper-left side and east the lower-left and the position of the slit is indicated. The slit is 0.′′6 wide and
3′′long. The numbers indicate the central positions of the
apertures described in Table 4.
Table 4. Positions and beam size of the apertures used to extract the spatially resolved spectra along the main axis of the nebula, increasing numbers from north to south. The three last columns report the result of the best fit to the spectra by using thermal emission with temperature Tbb and opacities computed for various dust species.
Ap. Shift FWHM Tbb Silic. Al2O3
(mas) (mas) (K) (%) (%) 1 -1568 350 310±50 75±15 25±15 2 -1176 330 390±50 65±10 35±10 3 -784 200 460±50 60±10 40±10 4 -392 200 600±70 55±5 45±5 5 0 200 720±80 55±5 45±5 6 392 200 570±5 55±5 45±5 7 784 200 440±50 55±5 45±5 8 1176 330 440±50 50±5 50±5 9 1568 350 480±60 45±5 55±5
(Bohren & Huffman 1983) to reproduce the observations. The abundances are obtained by using a standard linear least square fitting procedure. This simple model gives us an indication of the composition of the small, warm dust component, and, using the observed MIDI spectra, pro-vides a quantitative way to study the spatial variation in the dust composition.
We include amorphous olivine in our fitting procedure because it is one of the most abundant dust species in circumstellar, cometary and interstellar dust. Corundum is expected to be the first species to condense at very high temperatures (1700 K) and preferably at high den-sities (corresponding to a pressure of 10−3atm, see e.g.
Tielens 1990). Mitchell & Robinson (1978) showed that a substantial amount of corundum is needed in order to fit
the large aperture 10 µm spectrum of Eta Car. The spec-trum of Eta Car obtained by ISO, presented by Morris et al (1999), provides additional evidence for the presence of non-silicate dust. The reason is that if all of the emission around 10 µm would be caused by silicates, this would generate an appreciable 18 µm emission feature, which is not observed. Moreover, the broad red wing of the 10 µm feature extends to 15.5 µm, which is not characteristic for silicate emission. Another argument that the 10 µm emis-sion should contain a significant component of non-silicate dust is the lack of a clear detection of crystalline silicates as seen in some other LBVs (Waters et al, 1997). As it is hard to explain that in Eta Car only amorphous silicates would form, the lack of observable silicate crystals suggests that the dust material is not completely dominated by sil-icates. Finally, we note that corundum is also expected to be present in the ambient environments of these types of stars. In recent studies of AGB stars for instance, abun-dances of corundum of about 10-30% are reported (see the extensive discussion in Maldoni et al. 2004). Moreover, the appearance and disappearance of the corundum signature in the variable spectra of pulsating OH/IR stars is in-terpreted as evidence for dust formation (Maldoni et al. 2004). The above arguments strongly favor a grain com-ponent in addition to silicates. As corundum can naturally explain the red-wing of the 10 µm feature, we adopt this species as the extra component.
It is worth discussing that Mitchell & Robinson (1986) discarded the possibility of corundum as a dust compo-nent. They did so because i) corundum is not expected to survive as a separate grain component as it would act as nucleation centers for the later precipitation of silicates, and ii) the required amount of aluminum suggested an unrealistic overabundance compared to the solar value. Mitchell & Robinson fitted the broad long-wavelength shoulder of the 10 µm feature (which we attribute to corundum, see below) by emission from large (2 µm) amor-phous silicate grains that display a very broad 10 µm feature. For their calculations they use the refractive in-dices of ’astronomical silicate’ as derived by Draine & Lee (1984). However, calculations for large amorphous olivine grains using laboratory measurements of the refractive in-dices, by for example Dorschner et al (1995), show a fea-ture that is less broadened and is incompatible with the observed red wing of the 10 µm MIDI spectra. Concerning their first argument, one should keep in mind that the Eta Car nebula is expected to be a CNO processed medium (Davidson et al. 1986, Waters et al. 1997, Smith et al. 2004b). This could lead to a condensation sequence that is different from that which occurs in other stars favoring the creation of corundum. In Eta Car, the oxygen that re-mains after the CO molecule formation could be so modest relative to the amount of metals present that part of the material is only able to form simple oxides, such as Al2O3.
(Also, one may expect a chemistry driven by remaining metals, notably sulphur, forming species such as MgS.) An alternative explanation for the presence of corundum may be that the gas density at the location of dust
for-16 O. Chesneau et al.: The sub-arcsecond dusty environment of Eta Carinae
mation is so low that it is not possible to complete all of the condensation sequence leading to silicate dust, i.e. the condensation reactions freeze out. Concerning the second argument of Mitchell & Robinson, note that both possibil-ities discussed above may, at least in principle, explain the apparent over abundance of solid state aluminum relative to silicon.
The results of the analysis as described above are sum-marized in table 4, the 9 spectra are shown in Fig. 10 together with the best fit model. Also shown are the con-tributions from the various components. We see that when we go down from north to south the abundance of corun-dum is increased. This is consistent with the observed shift of the feature towards longer wavelengths when going from north to south.
It should be noted that the derived abundances are subject to a correct estimate of the continuum contribu-tion. In our simple model the contribution from cold dust grains to the continuum emission is not taken into account. Including this in a more complicated model might cause changes in the derived dust composition. To test the effect of grain size on the derived abundances we have performed calculations in which large amorphous olivine grains were added. This reduced the derived abundance of corundum in all fits by ∼ 5%, i.e. the trend in the compositional gradient is not significantly effected.
The evolution seen in the spectra is indirect evidence that dust is continuously created in the butterfly nebula or at least that the geometry of the butterfly nebula strongly influences the chemical composition of its dust content. The aperture 1 spectrum is dominated by emission from olivine grains. This aperture is pointed towards the region where the Weigelt complex ends and probably encounters, in the equatorial plane, the walls of the polar lobes. The dust in this region is efficiently shielded from the light of the central object. The aperture 7-9 spectra are dom-inated by the emission from aluminum oxide grains. A possible explanation for this might be that the condensa-tion reaccondensa-tions freeze out. In this scenario the difference in dust composition between the Weigelt complex and the SE clump reflect a different formation process; the equatorial dust being formed preferably during outbursts which pro-vide dense enough regions to complete the condensation process whereas the dust formed in the rims of the but-terfly nebula is continuously processed but the reactions are quickly freezed out. An argument against this scenario however is that the impact of the wind through the rims should provide a density discontinuity large enough to provide the conditions of dust silicate formation. Spectra taken beyond the rims of the butterfly nebula are needed to constrain the condensation sequence and begin a study of the chemical map of the dust within the full nebula.
5. Correlated flux
5.1. Location of the fringes
The spatial distribution of the fringes detected by MIDI with the 8.7 µm filter is shown in Fig. 12. We have checked that the peak of the fringes is localized at the position of the star itself1but an extended halo is also visible in the
Weigelt complex about 0.′′4-0.′′6 northwest from the star.
This is the confirmation that highly compressed material which emits strongly at 8.7 µm exists in this region.
The fluctuations from the fringes at the location of the Weigelt blobs are definitely more extended than a single PSF FWHM at 8.7 µm (220 mas). They coincide roughly with the location of the blob C’ observed by NACO but are more extended owing to the larger PSF of the 8m telescope at this wavelength. This implies that in the equatorial Weigelt region a fraction of the dust is embedded in clumps with a typical size smaller than 10-20 mas (25-50 AU) within a total extent of about 1000 AU. Nevertheless, this correlated flux represents only a few percent of the total flux at these locations. It must be pointed out that only a few scans with fringes have been recorded during this commissioning measurement and the lowest detectable fringe signal visible in Fig. 12 is about 20 Jy. In June, the measurements performed in dispersed mode (following section) represents more than 200 scans. MIDI has been able to record fringes further out from the central source with a sensitivity reaching about 5 Jy. From this result we are confident that the spatial distri-bution of the correlated flux can be studied in the future at distances larger than 0.′′5 from the central object.
5.2. Correlated spectra
In Fig. 13, we show the correlated flux of three central masks around the star (apertures 5 to 7). For comparison, the photometric flux of aperture 6 is shown (this aperture contains the star, the maximum flux being in aperture 5). The correlated fluxes measured by MIDI are 98±47 Jy, 87±33 Jy and 82±41 Jy, respectively. The errors have been estimated from the variance of the measurements using several calibrators and by varying slightly the parameters of the apertures. The fringes have been recorded using the same slit as used for the photometry. Unfortunately, this slit is about two PSFs wide and the signal from the star has been mixed up with the signal from the dust situated perpendicular to the axis, i.e. at PA≃60◦.
The baseline is roughly perpendicular to the main axis of the nebula and van Boekel et al. (2001) have reported that the star is prolate. This means that the baselines were oriented perpendicular to the main stellar axis, where the star is smaller, corresponding to a maximum correlated flux. Hence, our measurement can be considered as an upper limit of the correlated flux observable from the star.
1 by comparing the position of the fringes with the position
O. Chesneau et al.: The sub-arcsecond dusty environment of Eta Carinae 17
Fig. 12.Left, the figure shows the rms of the fluctuations within the MIDI FOV. The external regions are dominated by the detector noise and the internal regions by the tunnel and sky background fluctuations. The signal from the fringes is strong and centered on the position of the star as seen in the deconvolved acquisition image at 8.7 µm. The contour plot represents the contours of the deconvolved MIDI 8.7 µm acquisition image. Right, the noise pattern and the fringe pattern from a calibrator have been subtracted from the previous figure in order to show the extended fringe signal. The orientation is the same as in Fig. 10.
Fig. 13. MIDI correlated flux measured with a 74m (PA=62◦) and a 78m (PA=56◦) projected baseline. The solid
line denotes the photometric flux as extracted using the mask centered on the star (aperture 6) which can be seen in Fig. 11. The dotted lines represent the correlated flux measured with the aperture 6. scale has been multiplied by 10. The dashed and dashed-dotted lines represent the correlated flux extracted with aperture 5 (dashed) and 7 (dashed-dotted).
18 O. Chesneau et al.: The sub-arcsecond dusty environment of Eta Carinae
We compared these measurements with the model pre-sented in Hillier et al. (2001). For that purpose, we used three flux distributions from the model at 8, 10 and 13 µm, of respectively 332, 287 and 241 Jy which can be approx-imated by a 2D gaussian with a FWHM equal to 6.4, 6.8 and 8.2 mas. With the UT1-UT3 projected baseline of 78m, we can compute the expected correlated flux by performing the Fourier transform of the flux distribution from the (spherical) models. The visibility for the theoret-ical star at 8, 10 and 13 µm is 0.54, 0.59 and 0.65 respec-tively. This corresponds to correlated fluxes of 180, 169 and 156 Jy. These fluxes are larger than those observed by a factor of 2. Moreover, the correlated flux measured at the location of the central star includes also a non-negligible contribution from the dust.
The correlated flux from the Weigelt region is dom-inated by the brightest clumps. Due to the complexity of their spatial distribution, the curves of correlated flux present an oscillating behavior which is very dependant on the projected baseline length and direction. This is par-ticularly visible in the correlated flux spectra extracted from aperture 5 (dashed line in Fig. 13). In particular, the frequency and the stability of this oscillation over the N band suggest that a few clumps separated by 0.′′05-0.′′1
dominate the correlated flux of apertures 5 and 7. The cor-related flux extracted from aperture 6 (which contains the star) is larger and the oscillation much lower suggesting that the dust contribution is relatively low, about 10-20 Jy, compared to the stellar flux. We are left with a stellar flux of about 70-90 Jy at 8 µm and about 50-70 Jy between 10 and 13 µm.
The correlated fluxes represent about 50 Jy in the lo-cation of the Weigelt complex and only 5-10 Jy in the south. If we compare these correlated fluxes with the to-tal measured fluxes, the visibility and hence the clumping factor are larger at the location of the Weigelt complex (more than 3% visibility) than at the SE clump (less than 2%) though this difference is within the MIDI error bars. We are quite confident that even the smallest correlated fluxes reported here are real. No correlated flux can be detected at the northern edge of the slit. At this location, the flux from the nebula is still well above the detection limit of MIDI, which is of the order of one Jansky for faint fluxes. Moreover, MIDI has observed some bright overre-solved sources without showing spurious fringe detection. For instance, no fringe signal was detectable for the bright source OH 26.5+0.6, an OH/IR star with a N band flux at the time of our observations of ≈ 650 Jy (Chesneau et al. 2004).
6. Discussion
6.1. Inferences for the observations of the central star
As noted in section 5.2, the IR fluxes deduced from the present observations, and by van Boekel et al 2003, are a factor of 2 to 3 smaller than those predicted by the model. Below we discuss the possible cause of these discrepancies.
The first cause we examine is the correction for red-dening. From the inferred dust temperatures, and from the JHKL variability observations of Whitelock et al. (2004), we can infer that the K band flux of Eta is dominated by the central source, and by scattering. Feast, Whitelock and Marang (2001) give an IR magnitude for Eta Car of around 0.4 to 0.5. This, and the stellar K magnitude of 1.2 derived by van Boekel, implies that half the starlight is scattered. Thus there is considerable extinction at K, and this extinction could easily explain the difference between the van Boekel K flux and the model K flux. However at 10 µm, the extinction will be lower, and probably can-not explain the discrepancy. Moreover, a variable free-free emission seems to be also an important flux contribution in K band which is also contaminated by the emission from the Brγ line (Whitelock et al. 2004). The complexity of the K band is such that the constraints provided in N-band should be more reliable. Thus we must look to the modelling for an explanation of the discrepancy.
There are some major difficulties associated with mod-elling of the optical/UV spectra of Eta Car.
1. We cannot compare the model fluxes with those ob-served since the reddening and reddening law are un-certain, and have to themselves be derived from the observations. In addition, the amount of circumstellar reddening is probably variable.
2. There is evidence for a possible wind asymmetry. This might explain explain why Hillier et al. severely over-predicted the strength of the P Cygni absorption lines seen in optical spectra. Direct evidence for an asymme-try comes from the variable terminal velocity derived from the scattered Hα profiles (Smith et al. 2003b), and from VLT measurements (van Boekel et al 2003). 3. The companion star could be a substantial source of ionizing photons which could also affect the symmetry of the wind. The large impact of the orbital cycle on the near-infrared photometry is a strong argument for it (Whitelock et al. 2004).
4. The spectrum of the primary is intrinsically variable, and part of the variability is probably not attributable to a companion. In particular during 2002, and leading up to the event in 2003, the H Balmer lines were up to a factor of 2 weaker compared to the previous cycle. The behavior of the radio emission is also different from the last cycle (Duncan & White 2003).
Given all these difficulties it is not surprising that the agreement of model and observations is not perfect. The match of the model with a large part of the spectrum from the central object is already a success. However it is worth examining in more details possible causes of the discrepancies. We consider two possible causes: variability and wind asymmetry.
Since the IR flux will originate where the wind is at a substantial fraction of the terminal velocity, we can use the mass-loss rate formula of Wright & Barlow (1975) to estimate the scaling of the IR flux with mass-loss rate. In particular, ˙M ∝ S0.75. Thus a factor of 2(3) reduction