muscle architecture described with
diffusion weighted MRI
by
Terry A. Gaige
Submitted to the Department of Mechanical Engineering
in partial fulfillment of the requirements for the degree of
Master of Science in Mechanical Engineering
at the
MASSACHUSETTS INSTITUTE OF TECHNOLOGY
June 2007
@
Massachusetts Institute of Technology 2007. All rights reserved.
Author ...
$epartmentCertified by ...
of Mechanical Engineering
May 18, 2007
... ...p.og
Kamm
igineering
'upervisor
C ertified by ...
...
k11d GilbertResearch Scientist, Mechanical Engineering
A Th- Supervisor
Accepted by ...
...
. ...
Lallit Anand
Chairman. Department Committee on Graduate Students
MA'SSA(CHU fE-1T7S I N S TTUTE
JUL 10 207
..
BARKER
Complex
Complex muscle architecture described with diffusion
weighted MRI
by
Terry A. Gaige
Submitted to the Department of Mechanical Engineering on May 18. 2007, in partial fulfillment of the
requirements for the degree of
Master of Science in Mechanical Engineering
Abstract
The complex array of fiber orientations exhibited by muscles such as the tongue, esophagus, and heart, enable function beyond basic pulling. Among other things, the presence of crossing geometry adds the ability to push by bi-directional contraction causing expansion in the orthogonal direction. Diffusion weighted magnetic resonance imaging (DW-MRI), provides a convenient, non-destructive, method for deriving fiber architecture in many tissues. DW-MRI finely probes tissue microstructure by deter-mining direction-specific variations of signal attenuation. Gradients are applied in a set of directions, intensities, and durations and the attenuation data combined to form an approximation of fiber alignment within each voxel. The main original contri-butions of this work are the calibration and application of diffusion weighted imaging methods to several muscular tissues and analysis of the data. Of particular note are:
(1) the relation of diffusion spectrum MRI derived muscle architecture to 3D whole
tissue two-photon microscopy data, and (2) the ability to capture mechanically rel-evant tongue muscle architecture data from human in vivo and analysis. Muscular tissue is involved in nearly all vital functions of biological organisms: respiration, ingestion, digestion, circulation in addition to basic motion. The application of DW-MRI technologies to muscle tissue as described in this paper could lead to insights about or aid in the remediation of muscular dystrophies and other myopathies. Thesis Supervisor: Roger Kamm
Title: Professor, Mechanical Engineering Thesis Supervisor: Richard Gilbert
Acknowledgments
In this section I will attempt to acknowledge all those who have contributed in their own way to completion of this research. First and most importantly, I thank Richard Gilbert, the driving force behind all of this work, for his continual mentoring and for insisting on calling me "Professor". And second, Sam Felton, my fellow graduate researcher and good friend, for keeping me sane. I thank Prof. Roger Kamm for ex-cellent bioengineering classes, for his advice on this thesis, for a lab to call home and a desk to work on. I thank our collaborators at Massachusetts General Hospital: George Dai, Thomas Benner, Ruopeng Wang, and Van Wedeen, as well as Jon Glickman from Brigham Women's Hospital, for their expertise and willingness to share it. I thank our undergraduate student researchers, Sean Nabar, Tristan Lang, Teresa Wang and
Chris Cabral for their unique perspectives and hard work. I thank Hyuk-Sang Kwon for acquiring terabytes of data on mouse tongues and especially Yoon-Sung Nam for dependably providing an endless supply of them. I thank my labmates and friends for their assistance and welcome diversions: Nate Hammond, Vernella Vickerman, Cherry Wan, Johanna Varner, Aida Abdul Rahim, Anusuya Das, Jeff Hsu, Charlene Chuang, Sungyon Lee, Barry Kudrowitz, Chester Tse, Kim Huestis, Kynam Doan, Arthur Mak, Angela Chen, Allison Kao, Jenny French, Melissa Read, and Brady Young. Thanks also to all my brothers at Chi Phi for letting me be their resident advisor the past year. I thank my friends in the San Francisco area where I spent each summer: Maria Tonione, Janet Fang, Kim Tsao, Dave Smith, Max Planck, and Philip Lee for providing me a life plan for at least the next few years. Finally, I thank my parents, Karen and David., my big sister, Dana, and little sister, Jacy, for everything else.
Contents
1 Introduction
1.1 M otivation. . . . . 1.2 Sum m ary . . . .
2 Introduction to diffusion MRI
2.1 Basics of MRI . . . . 2.1.1 Magnetism and spin .
2.1.2 Image formation . . . .
2.2 Diffusion weighted imaging... 2.2.1 Diffusion Tensor Imaging 2.2.2 Diffusion Spectrum Imaging
2.3 Tractography . . . . 17 . . . . 1 7 . . . . 1 8 . . . . 1 8 . . . . 1 9 . . . . 2 1 . . . . 2 1 . . . . 2 3 3 Multi-scalar architecture 3.1 M ethods . . . .
3.1.1 High field diffusion spectrum image of mouse tongue . . . . . 3.1.2 Whole tissue two-photon microscopy and autocorrelation analysis
3.1.3 Orientational distribution function and tractography . . . . .
3.2 R esu lts . . . .
3.2.1 Mvoarchitecture of the Iurine tongue . . . .
3.2.2 Visual co-registration of diffusion and microscopy tractographies
3.3 D iscussion . . . . 13 13 15 25 27 27 28 30 31 31 31 32
4 In vivo: lingual myoarchitecture and local mechanics
4.1 Muscular hydrostats ... ...
4.2 Myoarchitecture of the hunian tongue . . . . 4.2.1 Methods for in vivo DTI tractography . . . .
4.2.2 R esults . . . . 4.2.3 D iscussion . . . . 4.3 Strain rate during propulsive phase of the swallow . . . .
4.3.1 Phase contrast imaging.... ...
4.3.2 Physiological Gating of MR Imaging . . . .
4.3.3 R esults . . . . 4.3.4 D iscussion . . . .
5 Ex vivo: esophagus and heart
5.1 Myoarchitecture of the normal and infarcted sheep heart
5.1.1 M ethods . . . .
5.1.2 Normal cardiac myoarchitecture . . . .
5.1.3 Remodelling following infarction . . . .
5.2 Myoarchitecture of the bovine esophageal wall . . . .
5.2.1 M ethods . . . .
5.2.2 R esults . . . .
5.2.3 D iscussion . . . .
6 Conclusion and Future Work
6.1 Diffusion and aspects of microstructure . . . .
6.2 Diffusion imaging as a template for active deformation . . . .
A Diffusion weighted imaging specimen preparation
37 . . . . 37 . . . . 41 . . . . 43 . . . . 44 . . . . 51 . . . . 55 . . . . 55 . . . . 57 . . . . 59 . . . . 61 65 65 . . . . 66 . . . . 66 . . . . 68 . . . . 69 . . . . 70 . . . . 72 . . . . 74 83 83 84 87
List of Figures
1.1.1 Histology of the esophageal muscularis showing the complexity of fiber
alignm ent. . . . . 14
2.2.1 A typical diffusion weighted pulse sequence. . . . . 20
2.2.2 Simulation of a diffusion weighted MRI experiment. . . . . 20
2.2.3 Derivation of fiber alignment from diffusion spectrum imaging. . . . . 23
3.0.1 Mesoscale tractography: Template for contractility at the interface of microscopic and macroscopic scales. . . . . 27
3.1.1 Single slice example of the two-photon data set. . . . . 29
3.1.2 Derivation of fiber alignment from two-photon microscopy. . . . . 30
3.2.1 DSI tractography of murine tongue. . . . . 32
3.2.2 Comparison of mesoscale tractography rendering derived from diffusion spectrum imaging (DSI) and two-photon microscopy (TPM). . . . . . 33
3.3.1 Dimensions of probability distribution function. . . . . 35
4.1.1 The concept of a muscular hydrostat. . . . . 39
4.1.2 Conceptual drawings of lingual prototypical deformations. . . . . 40
4.2.1 Examples of raw diffusion weighted image data. . . . .44
4.2.2 DTI tractography of human tongue (complete data set). . . . . 46
4.2.3 DTI tractography of human tongue compared with anatomical drawing (sagittal). . . . . 47
4.2.4 Definition of mean vector direction. . . . . 48
4.2.5 DTI tractography of human tongue (midline coronal). . . . . 49
4.2.6 DTI tractography of human tongue (axial). . . . . . . 50
4.2.7 Demonstration of the mode of styloglossus insertion . . . . 52
4.3.1 Phase Contrast strain rate raw data. . . . . 57
4.3.2 Swallow based MRI gating system. . . . . 59
4.3.3 Combined strain rate and fiber direction during swallowing . . . . . 60
5.1.1 DSI tractography of sheep heart myoarchitecture. . . . . 67
5.1.2 Helical ventricular band model of sheep heart myoarchitecture. ... 68
5.1.3 DSI tractography of normal and remodelled cardiac myoarchitecture. 69 5.2.1 DSI of cow esophagus (axial view). . . . . 77
5.2.2 DSI tractography of cow esophagus (side view). . . . . 78
5.2.3 Demonstration of crossing helices in the proximal esophagus. . . . . . 79
5.2.4 Histology of the esophageal muscularis. Circumferential sections. . . . 80
5.2.5 Histology of the esophageal muscularis. En face orientation. . . . . . 81
List of Tables
4.2.1 Individual muscle mean values and standard deviations of five subjects. 48
Chapter 1
Introduction
1.1
Motivation
Muscular tissue is involved in nearly all vital functions of biological organisms: respi-ration, ingestion, digestion, circulation in addition to basic motion. The majority of muscle in the human body is composed of myocytes aligned generally in one direction and attached at both ends to the skeleton through a tendon. Much research has been done regarding activation, strain rate and force output for these muscle types
[36,
86]but the incorporation of that understanding to muscles exhibiting multi-directional fiber alignment, such as the tongue, esophagus, and heart, is less explored. Muscles with crossing fibers do not function simply by pulling. The presence of crossing ge-ometry adds the ability to push by bi-directional contraction causing expansion in the orthogonal direction. Muscles that use this phenomenon, which is based on the near
incompressibility of water, are called muscular hydrostats; of which, the mammalian tongue, the elephant trunk, and octopus tentacles are all quintessential examples. The esophagus and heart are not typically considered muscular hydrostats, but they do have complex architectures and the same principles are relevant.
Several possible methods exist and have been attempted to evaluate muscle struc-ture. such as histological sectioning of whole tissue [77]. electron microscopy with or without chemical-maceration [44, 65]. or by careful dissection [54]. Histology. an inherently 2D approach is ambiguous for those fibers oriented at an angle through
the image plane. electron microscopy is limited to surface imaging of small regions, and direct dissection is tedious; additionally all are destructive of the tissue. Figure
1.1.1 shows a histological section of a bovine esophageal wall. In this small region the
muscle cells are aligned in many directions.
Figure 1.1.1: Histology of the esophageal muscularis showing the complexity of fiber alignment. Notice the ineptitude of 2D histological images at providing useful infor-mation regarding 3D architecture
A unique application of magnetic resonance imaging allows sensitivity to the
di-rection and magnitude of water diffusion. From the assumption that water diffuses most easily parallel to barriers, this imaging technology offers a convenient, non-destructive, method for deriving fiber architecture at an intermediate multicellular scale. or mesoscale, in many tissues. The use of these diffusion weighted magnetic res-onance imaging (DW-MRI) technologies to muscle tissue as described in this paper, could lead to insights about muscular dystrophies and other myopathies. Relating tissue scale architecture to the stress and strain fields will lead to better understand-ing and organ morphogenesis: such as the effect of missunderstand-ing adhesion proteins on the development of normal cardaic architecture. or studving the structural remodeling of
tissue following infarction. Improving the methods to the point that accurate and fast fiber orientation data is achievable in vivo may also assist during image guided surgery.
1.2
Summary
In this thesis there will be a section covering the background of diffusion MRI, a sec-tion relating diffusion MRI to microstructure obtained with two-photon microscopy, and a section on each of three organs exhibiting complex myoarchitecture: tongue, esophagus, and heart.
The main original contributions of this work are the calibration and application of diffusion weighted imaging methods to various muscular tissues and analysis of the data. Of particular note are:
* the ability to capture mechanically relevant tongue muscle architecture data from human in vivo and analysis.
" the relation of diffusion spectrum NIRI derived muscle architecture to 3D whole
tissue two-photon microscopy data.
Chapter 2
Introduction to diffusion MRI
Magnetic resonance imaging (MRI) works by placing a sample in a strong magnetic field, applying a radio frequency (RF) signal which is stored in the spins of nuclei and then re-emitted. The signal response is then captured with an antenna and informa-tion about the sample reconstructed. MRI has many advantages over other imaging technologies. It is non-invasive and able to image in deep tissue with high contrast between tissue types. Resolutions range from 10 pm to 10 mm. To present knowl-edge there are no secondary harmful effects other than interference with implanted devices and the innate dangers of strong magnetic fields combined with large or sharp metallic objects. Also many clever adaptations are possible, such as diffusion imag-ing and strain rate imagimag-ing. This chapter introduces the basic theory of magnetic resonance imaging (MRI) and provides a semi-thorough explanation of how MRI can be sensitized to the amount and direction of self-diffusion in biological tissue.
2.1
Basics of MRI
The discovery of nuclear magnetic resonance has allowed the rapid development of a very useful and widely applicable imaging technology. In 1946, Bloch [5] and
Pur-cell [59] discovered separately that atomic nuclei with unpaired protons precess in
strong magnetic fields with a frequency relative to the field strength. Most elements have at least one isotope with unpaired protons. but those most useful for MRI are
3 1P, 23Na, 4N, '3C, 19F and, most importantly, due to its abundance in biological
tissue, 'H. The magnetic resonance phenomenon was initially used simply to study chemical structures, but in the early 1970's the ability to derive spatial information
by introducing gradients was discovered [38, 43], thus bringing MRI into the diverse
realm of medical imaging applications.
2.1.1
Magnetism and spin
The magnetic forces we are familiar with, such as those which hold esteemed artwork to the refrigerator door, originate from electron spin and motion. Nuclear magnetic moments, the forces originating from proton spin, are much weaker, but because they precess around stationary magnetic fields at a much lower frequency, a unique signal is discernible, given that enough unpaired spins are present in an imaging volume
(called a voxel).
In a steady state, the net magnetization vector for a group of spins. M. aligns itself with an external magnetic field, BO. If M is disturbed, it will precess around
B. at the Larmor frequency, Wo = 'Bo, where y is the gyromagnetic ratio specific to each kind of nuclei. M can be tilted away from BO by applying a perpendicular magnetic field, but since M rotates. this second magnetic field must rotate at the same rate to always remain perpendicular, which is done simply by applying an RF pulse, perpendicular to BO and oscillating at Wo.
If the RF pulse is stopped just as M has tilted 90', M will slowly relax to the
parallel state. As the net magnetization vector relaxes, it will continue to precess around BO thereby causing a rotating magnetic field, also known as an RF signal. This signal can be sensed using an antenna or coil placed around or adjacent to the sample being imaged.
2.1.2
Image formation
In a uniform magnetic field all spins of the same material precess at the same
relative portions of various materials. In order to extract spatial information about a sample, a gradient can be added on top of B0 which causes some spins to precess
faster, and some slower, based on their location within the gradient. The most com-mon way to identify a point in space is to first select a slice of spins by applying an RF pulse of a particular frequency while the sample is within a gradient, G,. Gra-dients in the x and y-axis are then applied to establish position in the transverse xy-plane. One way is to apply a gradient, G., for a short period of time, which introduces a linear phase shift along y and then read the signal while a third gradi-ent, Gx is applied, which encodes along the x-axis by frequency. These gradients are conventionally called the slice, phase, and frequency (or read), encoding gradients.
2.2
Diffusion weighted imaging
The different diffusion imaging techniques use the same principle: that signal strength decreases as a result of the random motion of water molecules within a magnetic gradient. An image is sensitized to the amount of self diffusion in a particular direction
by sustaining and reversing a gradient in that direction. The protons that diffuse
parallel to the gradient direction experience a dephasing that contributes to a net signal attenuation. Protons that diffuse perpendicular to the gradient direction are unaffected.
A standard diffusion weighted pulse sequence is shown in Figure 2.2.1 along with
an accompanying simulation of how the spins respond in Figure 2.2.2. The simulation is shown in the rotating reference frame so the spins appear stationary in each image. First, the spins are tipped by a 7r/2 pulse, then they experience a steady gradient of duration 6. During this gradient the spins in the stronger field aquire more phase shift than the others. Then the spins are allowed to diffuse meanwhile being flipped a full 7r. Time A later, the gradient is reapplied and the spins regain coherence. At time of acquisition, the spins realign, creating a strong echo that is diminished by the dephasing that occurred by particles that changed position between the first and second gradient.
-r/2 7
RF
G
Figure 2.2.1: A typical diffusion weighted pulse sequence [33] is a modified spin-echo pulse sequence that sensitive to the attenuating effects of diffusion. The pulse sequence involves a 7r/2 pulse, and two gradients of duration 6 seperated by A and a full 7r pulse. Readout is accomplished using typical single shot echo-planar spatial
encoding.
IV
$
We
Tr/2 6 T 6 acq
Figure 2.2.2: Simulation of a diffusion weighted MRI experiment [33]. Spins acquire a phase difference, then regain coherence diminished relative to the amount of diffusion parallel to an applied diffusion weighting gradient.
Diffusion weighted MRI can be used to finely probe tissue microstructure by de-termining direction-specific variations of MR signal attenuation [4]. Tissues with anisotropic fiber architectures exhibit analogous anisotropic diffusion behavior be-cause microscopic barriers, such as cytoskeletal elements, and membranes restrict typical Brownian motion to certain preferential directions [8]. In diffusion MR imag-ing, gradients are applied in a set of directions, intensities, and durations and the attenuation data combined to form an approximation of fiber alignment within the voxel. The different diffusion imaging techniques: diffusion tensor. diffusion spectrum, q-ball and others. vary in how the gradients are applied and how they reconstruct the
2.2.1
Diffusion Tensor Imaging
The diffusion tensor model depicts the net diffusion in a volume of tissue with a symmetric second rank tensor. The diffusion tensor can be interpreted physically as an ellipsoid with its axes constructed along its three orthogonal eigenvectors and with each axis length proportional to the appropriate eigenvalues. The longest axis, i.e. direction of greatest diffusion, is assumed to correlate to local muscle fiber orientation. The extent of signal attenuation relates to the applied gradient and the diffusion tensor according to:
Sb
-In so =bq Dqj (2.2.1)
So
where Sb is the signal of the attenuated image at each voxel, So is from the unattenuated image, D is the diffusion tensor, and b is the scalar quantity termed the
b value, which is a function of the shape, temporal spacing, duration and magnitude of
the diffusion weighting gradient pulses. The vector qi is a unit vector in the direction of the ith applied gradient. The six unique coefficients of the diffusion tensor, D, can be found by applying a minimum of 6 non-collinear diffusion-weighting gradients and comparing the resulting images to one unattenuated image. To improve signal to noise, gradients are applied in numerous evenly spaced directions arrayed on the surface of a sphere, resulting in a system of linear equations that over-constrains the components of the diffusion tensor and may be solved using multiple linear regression.
Though useful, the tensor model chooses only a single diffusion maximum and therefore fails to describe fiber populations oriented at multiple directions within a voxel. When structures in complex tissues need to be understood, a high angular resolution diffusion imaging method should be used.
2.2.2
Diffusion Spectrum Imaging
Diffusion Spectrum Imaging (DSI) is a particular application of diffusion weighted MRI that aims to extract the complete ensemble average probability density function (PDF) of diffusing hydrogen atoms in a voxel of tissue. The PDF. which simply
maps the likelihood that a particle has diffused a particular distance and direction, reflects the tissue microstructure within the voxel. Directions of greatest diffusion are expected to correspond to the orientation of the long axis of fiber-like cells. These methods., described in brief in the next few paragraphs, have been previously used to image the myoarchitecture of the bovine tongue, and track neurons in brain tissue
[85, 24].
The PDF is represented by a mathematical expression termed the average diffusion propagator (,P). which is the sum of the probability density functions for each possible proton spin position and weighted by the proton density distribution. Stejskal and Tanner [70] [71], related PS(RIA) to the amount of signal attenuation for an applied
diffusion weighting gradient . and duration 6:
iI(. A) =1(0, A) PS(R A)e( dR, (2.2.2)
q = 7#6. (2.2.3)
Where q is called the q-value, -y is the proton gyromagnetic ratio, ,l is the signal intensity, A is the diffusion time, and R is the diffusion distance. The b-value defines the maximum diffusion weighting for a set of diffusion weighted image acquisitions:
b = max 11 2,A. (2.2.4)
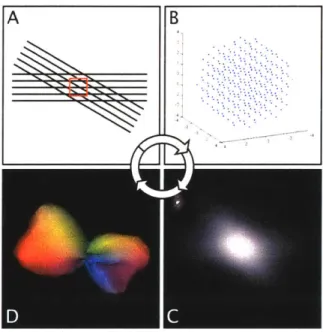
Equation (2.2.2) shows that a Fourier relationship exists between the diffusion weighted signal in q-space and the three-dimensional probability distribution function. As shown in Figure 2.2.3, in DSI, diffusion weighted images are acquired for a sphere of q-values with indexed positions in a Cartesian grid in q-space and the PDF is reconstructed directly by the following:
PDF =F 1 (I(-) (2.2.5)
where F denotes the inverse Fourier transform. To reduce the data from a 3D inage voluime to a contour surface. the PDF is integrated radially and weighted by
the magnitude of R:
ODF =
J
P,(p| A)p'ftdpwhere p and ft are the magnitude and unit vector describing R. The result, normalized by the minimum and maximum diffusion for each voxel, theoretically describes the underlying fiber architecture and is termed the orientational distribution function (ODF).
A B
Figure 2.2.3: Derivation of fiber alignment from extract multiple fiber directions within a voxel (A imaging first acquires a diffusion weighted signal directions and magnitudes in q-space (B). Then,
diffusion spectrum imaging. To
- red square), diffusion spectrum
for an indexed array of gradient through the fourier relationship. the probability density function is found (C). Lastly, radial integration provides an orientational distribution function which mimics the subvoxel fiber alignments (D).
2.3
Tractography
Streamline construction through tractography generates multi-voxel scale tracts along vectors corresponding to directions of maximal diffusion in each voxel. These data are derived solely from the principal eigenvector for each voxel. and thus ignore the
degree of diffusional anisotropy.
2:3
Mathematically a streamline is defined to be tangent to a vector field at all points.
dS(s)
ds t(S(s)) (2.3.1)
where S(s) is the streamline. s is a path coordinate along S, and F is the vector field. We create the streamline vector field from the set of eigenvectors correspond-ing to the largest eigenvalue of the diffusion tensor for each voxel. In the present experiments, tractography definition employed an approach called fiber assignment
by continuous tracking (FACT) in which the vector field is assumed to be continu-ous rather than discrete [46]. The method operates by adding an angular threshold
constraint for intervoxel connectivity. If the angular difference between the incoming streamline and the vector field of a particular voxel exceeds the threshold. the tract will stop. In the current work. we employed an angular threshold of ±35' to define tract continuity. Streamlines were seeded at the center of every voxel and traced in both directions. Tractography visualization employed TrackVis, custom software developed using VTK, an open source 3D visualization tool (http://www.vtk.org/).
Chapter 3
Multi-scalar architecture
The power of diffusion weighted magnetic resonance imaging (DW-MRI) is to conve-niently probe three-dimensional microstructure at an intermediate scale or mesoscale. In this chapter we explore this mesoscale by imaging a mouse tongue with both high field diffusion spectrum imaging (DSI) and with two-photon microscopy (TPM).
DSI reveals whole tissue myoarchitecture from a top-down approach while TPM
ap-proaches from below by imaging individual cells with submicron pixel resolution. The goal of this chapter is to elucidate more clearly the relationship between the observed diffusion function and characteristics of tissue microstructure. Cell mem-branes, the cytoskeleton, and sub-cellular components, restrict the motion of water molecules and thereby affect the directionality of diffusion. DSI theoretically allows the direct reconstruction of the probability density function (PDF) for a voxel of tis-sue. The PDF simply maps the likelihood of any particle to move a certain distance and direction. It has been generally confirmed that directions of enhanced diffusion in the PDF correlate to fiber direction [42], but the PDF may also contain much more information about the microstructure. Characteristics such as compartment size and surface permeability might even be more useful than the fiber direction. The ability to describe multiple compartment sizes could even be possible in biological tissue as has been done in synthetic porous media [45, 48]. The problem currently restraining us from inferring more than fiber direction from diffusion data is nmainly a lack of understanding of the precise biophysical barriers involved and their relative
contributions to diffusional anisotropy The roles of surface relaxation due to inelastic collisions, surface permeability, and cellular transport remain a mystery [79].
The tongue was selected for this study because it consists of a complex array of variably aligned fibers. In this tissue, the comparison of DSI with with TPM will allow:
* a more rigorous validation of DSI's capability to extract multiple fiber directions accurately within a voxel of tissue,
" a comparison of the DSI derived PDF to physical dimensions of the
microstruc-ture.
* a detailed visualization of the muscular anatomy of the mouse tongue.
A few technological advancements have allowed this comparison to be made.
Whole tissue two-photon microscopy was made possible with the development of high throughput 3D tissue multiphoton imaging system (10 frames per second) with computer-controlled specimen stage and microtome. Additionally incremental hard-ware and softhard-ware improvements have brought the resolution of high field DW-NJRI to become commensurate with a TPM field of view (FOV).
The orientational distribution function (ODF) is hereby proposed as the mesoscale template for contractility that links the microscopic and macroscopic scales (Figure
3.0.1). DSI data is 7D; for each 3D voxel there is a 3D probability density function
with a scalar value at each point. For easier visualization, the dimensions are reduced
by radially integrating from the center of each PDF, resulting in a set of ODFs.
Similarly, the principal patterns in the microscopy data were revealed by radially integrating from the center of the autocorrelation data. The local maxima of the ODFs for each method were identified and compiled into a vector field. In this manner, mesoscale tractography was performed from both the exact fiber orientation obtained by microscopy and that obtained by DSI of the whole tissue. thus providing a spatial linkage at the mesoscale.
The generation of tractography representation of ivoarchitecture from the two
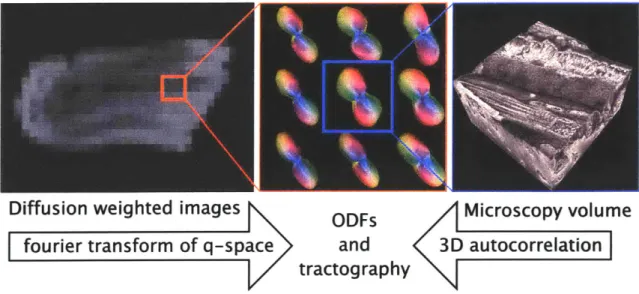
Diffusion weighted images ODFs Microscopy volume
fourier transform of q-space and 3D autocorrelation
tractography
Figure 3.0.1: Mesoscale tractography: Template for contractility at the interface of microscopic and macroscopic scales. To quantitatively relate myofiber architecture at the resolution of the cell and the tissue, voxel specific ODFs and intervoxel tracts were generated. A set of diffusion weighted images leads to the extraction of subvoxel information about fiber alignment in the form of an ODF field, whereas an ODF field can also be generated directly via the 3D autocorrelation function of the microscopic image.
predicted structure based on diffusion can be directly compared to the underlying microstructure. Combining knowledge of the physical dimensions with simulations of restricted diffusion experiments, it may be possible to draw conclusions about the precise origin of diffusional anistropy; thus providing a means to extract additional useful information from diffusion spectrum imaging in biological tissue, such as com-partment size and membrane permeability.
3.1
Methods
3.1.1 High field diffusion spectrum image of mouse tongue
Whole anterior tongues from female 357BL or FYDR-Rec mice (n=3) were scanned with a Magnex Scientific 9.4 T 2 cm diameter horizontal bore magnet with Magnex gradient coil set capable of 20 G/cm. The imaging protocol employed a diffusion gradient sampling scheme. which consisted of a key-hole Cartesian acquisition to
include q-space values lying on a Cartesian grid within a sphere for a total of 515 sampling points. With a max b-value of 7000s/mm, voxel size was 150 x 150 x 150[m 3, and TR 1200 ms, the entire acquisitions required 22 hours to complete.
3.1.2
Whole tissue two-photon microscopy and
autocorrela-tion analysis
Two-photon image acquisition
Whole anterior tongues from female 357BL (n=2) and FYDR-Rec mice (n=1) were imaged using a multi-focal multi-photon high speed imaging system with a robotic sample stage and an automated microtome. Prior to scanning, excised tissue samples were fixed in buffered neutral 10% formalin within 1 hour of harvest, and embedded in
paraffin within 1 day by the Brigham and Women's Hospital Department of Pathology. Two photon microscopy was achieved using a custom-built microscope and acqui-sition software [37, 401. The light source for two-photon excitation was a commercial Ti:Sapphire laser, Mira (Coherent, Santa Clara, California., United States). pumped
by a 10-W solid-state laser delivering 150fs pulses at a rate of 8011Hz with the power
delivered to the objective ranging from 100 - 250 mW depending on imaging depth.
The excitation wavelength was set to 890 nm, with the excitation signal passing through an Achroplan 40 x /0.8 NA water-immersion objective (Zeiss, Oberkochen., Germany) and collected after a barrier filter by a photoniultiplier tube. Figure 3.1.1 shows an example of TPM raw data
Autocorrelation image analysis
Analysis of microscopic FOV was accomplished using an autocorrelation algorithm to extract main fiber directions for each 3D field of view. The 3D autocorrelation was found by taking the Fourier transform of image volume. performing component
by component multiplication by its own complex conjugate and inverse transforming back into real space.
-100
175
200 25 50 75 100 125 150
ydim (n)
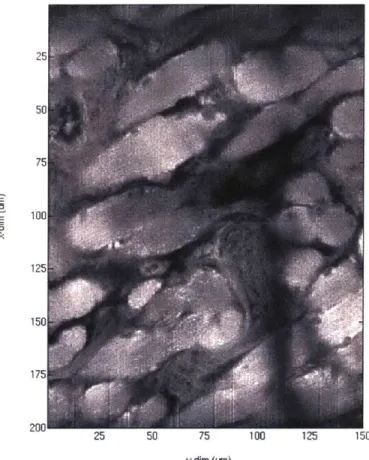
Figure 3.1.1: Single slice example of the two-photon data set. Above images were acquired for an entire mouse tongue. Each field of view (FOV) dimensions were
150 pm x 200 pm x 80 pm. Adjacent FOV had 30 pm, 40 pm, and 20 pm of overlap
in each dimension repectively. Resolution in the xy dimension was 0.5 pm, and z-dimension was 2 pm
Acorr = F-( C) (3.1.1)
Where F-1 denotes the inverse fourier transform. G is the 3D fourier transform of the image volume, and C is the complex conjugate of G. Each FOV was divided into 4 unique image volumes with dimensions 80 x 60 x 60 pm'. The image volumes were first linearly interpolated in the z direction to give isotropic voxel resolution and windowed with a Kaiser window to reduce edge effects. A frequency filter was applied to remove those features with a wavelength greater than or equal to 120[pmn. The main patterns in the microscopy data are revealed by radially integrating from the center
of the autocorrelation data, thereby creating an ODF similar to that created for each voxel using diffusion spectrum MRI. A single value was recorded for the bidirectional radial integration for the set of 181 vectors equally spaced on the surface of a half-sphere over a distance of 12.5 pm with a stepsize of 0.05 pm; thus compressing each
9.2 megabyte image volume file into a single vector with 181 components.
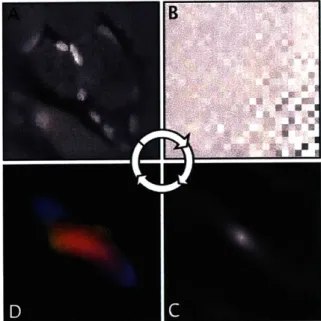
Figure 3.1.2: Derivation of fiber alignment from two-photon microscopy. To summa-rize fiber directions within a TPM field of view, an autocorrelation is performed: First the data by windowed with a Kaiser window (A) to reduce edge effects, then by the
3D Fourier transform, the data is expressed in frequency space (B) and a frequency
filter applied to remove patterns with a wavelength greater than or equal to twice the FOV. The 3D Fourier tansform is then multiplied by its own complex conjugate to obtain the autocorrelation (C). Lastly, radial integration provides an orientational distribution function which describes fiber alignments.
3.1.3 Orientational distribution function and tractography
Both DSI and two-photon microscopy autocorrelation result in an ODF summarizing the fiber orientation within block of tissue. Although they are informative, overall fiber architecture is often difficult to infer from looking at ODFs alone. A vector field was created from the local maxima of each ODF and streamline tractography performed. Tractography is an intuitive visualization method that creates connec-tions based on angular similarity of adjacent voxels (Section 2.3). The current images
employed a 350 angular threshold to generate intervoxel tracts. It should be empha-sized that the tracts so constructed do not represent actual anatomical entities, such as fiber bundles or fascicles, but indicate a set of macroscopically related diffusion maxima corresponding to a set of similarly aligned muscle fiber populations.
3.2
Results
3.2.1
Myoarchitecture of the murine tongue
The mouse tongue is surprisingly complex. Depicted in Figure 3.2.1 is the normal myoarchitecture of the excised anterior murine tongue obtained by DSL demonstrat-ing in particular the predicted relationship among the intrinsic fiber populations and novel observations regarding the configuration of the transversus fibers and the inser-tion points for the extrinsic fiber groups. Of the extrinsic muscles, the genioglossus
(gg) is the most clear, entering from below and extending along the sagittal plane into
the lingual core. The laterally located green fibers wrapping superiorly as they ap-proach the anterior tip could either be the ends of an inferiorly positioned styloglossus or perhaps the mouse equivalent of the chondroglossus.
3.2.2
Visual co-registration of diffusion and microscopy
trac-tographies
We show in Figure 3.2.2 a direct comparison of tractography renderings (sagittal ori-entation) from DSI and from two photon microscopy for the mouse anterior tongue. Observe the high degree of concordance in terms of the distribution of myofiber tracts. The ability to identify the cells comprising a region of niesoscale architecture is signifi-cant since it provides a direct anatomical validation for DSI tractography and provides
a method for relating structural data at the cellular level with niorphogenesis at the
scale of the tissue.
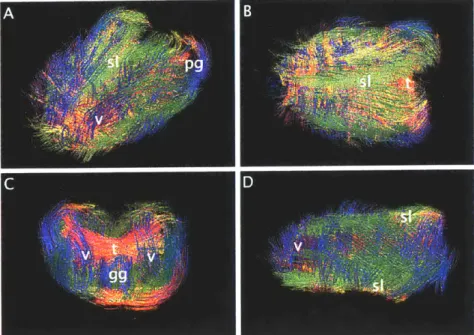
Figure 3.2.1: DSI of murine tongue. Demonstrated is a full diffusion spectrum imag-ing with tractography data set obtained at 9.4 T (voxel size 150 pm) of the anterior
357BL mouse tongue from the (A) oblique, (B) coronal (superior), (C) axial
(poste-rior),and (D) sagittal perspectives. The green superior longitudinalis (sl) and inferior longitudinalis (il) run along the dorsal and ventral exterior surfaces. The transversus (t) and verticalis (v) are not perfectly horizontal and vertical but rather form an in-teresting concave box like structure, becoming parallel with each other at the corners. Extrinsic fibers identified include the genioglossus (gg) and palatoglossus (pg)
3.3
Discussion
The compilation of TPM data into a visualization of overall tissue architecture is in it-self a useful accomplishment. Currently efforts are focus on computational alignment of adjacent FOV to correct for the around ± 5 pm accuracy of the mechanical stage. The method described in this paper provides a less computation intensive alternative which identifies interconnectivity, yet ignores possible FOV missalignment. Whole tissue architecture derived by TPM via autocorrelation analysis and visualized using TrackVis (software developed for viewing diffusion weighted MRI tractograpy data -http://trackvis.org) may even be more convenient and adept for certain applications than a precisely aligned montage.
The architectures found using DSI and TPM exhibit very similar features (i.e lougitudinalis sheath. crossing intrinsic niuscles in lingual core. location and
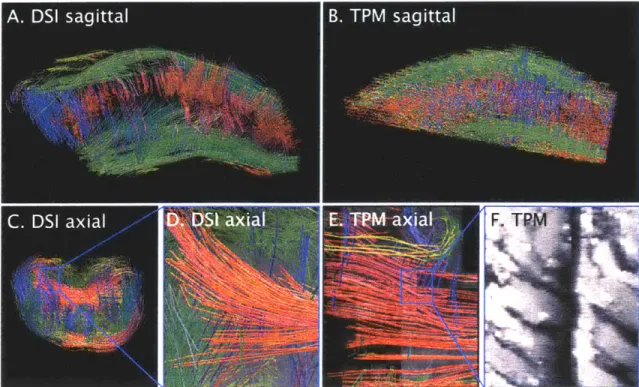
Figure 3.2.2: Comparison of mesoscale tractography rendering derived from diffusion spectrum imaging (DSI) and two-photon microscopy (TPM). Upper row: Tractog-raphy of mouse tongue myoarchitecture (sagittal orientation) obtained by DSI (A) and TPM (B). The most lateral slices of the DSI tractography have been removed to match the TPM. DSI tractography image (C) of an axial slice, and a close-up (D), emphasizing the transverse oriented fibers. Similar resolution TPM tractography im-age is displayed (E) accompanied by a TPM imim-age in (F) of a region of myocytes corresponding to the indicated myofiber tracts shown in (E, blue square). These results confirm the capacity of these imaging methods to derive intermediate scale myofiber tracts both from the local diffusion maxima displayed by DSI and directly from 3D microscopy data.
tion angle of genioglossus), although no quantitative co-registration has yet been performed.
The comparison of the diffusion function with the autocorrelation function is in-teresting because, theoretically, for the long diffusion time limit in cells with perfect boundaries, the diffusion-derived PDF would be identical in form to the autocorrela-tion intensity distribuautocorrela-tion [79]. The fact that the width of the PDF at its narrowest dimension should be equivalent to twice the fiber diameter was confirmed by the-oretical analysis and computer simulations of unrestricted and restricted diffusion experiments were performed. though these simulations should be built upon to
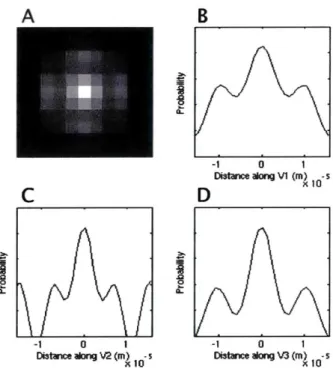
count for semipermeable membranes and cell walls, as well as intricacies of DW-MRI. The probabillity distributions from the raw DW-MRI data were reconstructed for several voxels in the lingual core in a continuous method as to preserve physical dimensions. Figure 3.3.1 shows an intensity image of the PDF calculated discretely according to the inverse fourier transform relationship described in Section 2.2.2. The other three plots show three linear continuous probability distributions along the three eigenvectors of the hessian matrix describing the 3D PDF at the origin. The hessian matrix is defined as:
IxX Ixy Ixz
H =Ix I, lz , (3.3.1)
Izx I-V Izz
where I is the intensity of the PDF at a point in diffusion space and is equal to the following for the sum over all 515 points acquired in q space. Only the symmetric and real components are considered.
1 515
I =E((i)) cos( (i) -), (3.3.2)
where E is the signal intensity of the voxel at the specified gradient vector. q,
and r is the vector describing a location in diffusion space. Ijk is the second partial
derivative of I with respect to the identified axes
j
and k. At the origin, this can bewritten as:
I 1k 2 1
Z
E( (i))q (i)qk(i) (3.3.3)where qj and qk are the
j
and k components of q. The linear probabilitydistribu-tions along the eigenvectors were calculated using Equation 3.3.2.
The eigenvector corresponding the smallest eigenvalue of the Hessian matrix should correspond to the narrowest width of the PDF. From the plots in Figure 3.3.1, one can see that the dimensions of the PDF aloiig the tertiary eigenvector are approxiniately 10pm. though the lack of sampling at high spatial frequency makes the reconstruction
very wavy. Additionally, the value obtained for estimated diameter is not very close to the actual cell diameters observed in Figure 3.1.1, which are closer to 20 to 25 pum. There are many possible explanations for the discrepancy; such as subcellular com-ponents hinder diffusion, or the short diffusion times used in the pulse sequence do not allow definition of such large distances. Much more effort should be concentrated on these analyses. A B -1 0 1 Distace aong V1 (m) -s X 10
C
D
Distance ong V2 (m) 5 Distance oNg V3 (m) -s
X10 X10
Figure 3.3.1: Dimensions of the DSI probability distribution function for typical voxel in lingual core. (A) Middle slice of discretely calculated 3D probability distribution function. (B) Continuous probability distribution along V1, primary eigenvector of the hessian matrix describing center voxel, (C) Continuous PDF along V2 and (D) Continuous PDF along V3 (the secondary and tertiary eigenvectors respectively). The width of the narrowest (V3) distribution should correspond to twice the cell diameter in uniformly oriented tissue.
One issue discovered during this experiment was that the tissue being studied must not contain fluorescent cells. The specimens obtained were from mice being used in an unrelated experiments. Most were wild type, but some were FYDR-Rec (Fluorescence Yellow Direct Repeat - Recombined), which is a trangenic mouse that expresses EYFP proteins. These mice were injected with Hoechst. a nucleus-staining dye.
just
prior to sacrifice. It was discovered that the lingual myocyte nuclei exhibitedfluorescence as well. The high signal from nuclei resulted in poorer definition of cell boundaries and disrupted the extraction of fiber direction by the autocorrelation algorithm. This appeared to cause an increase in the bias towards selecting maxima in the x. y, and z orthogonal directions.
In conclusion, derivation of 3D fiber orientation through two complimentary imag-ing methods was performed on whole mouse tongues, a tissue consistimag-ing of complex arrays of variably aligned fibers. We compared mesoscale myofiber tracts derived from magnetic resonance DSI, which probes microstructure at a multi-cellular scale based on the preferential diffusion of water in the presence of microscopic barriers, and TPM, which images individual cells with submicron resolution. DSI was performed at 9.4 T (b-value 7000 s/mm and 150 pm. isotropic voxels) and multivoxel tracts generated on the basis of angular similarity. TPM was performed with a high throughput 3D tissue multiphoton imaging system (10 frames per second) with computer-controlled specimen stage and microtome. and myofiber tracts generated from autocorrelation analyses of individual fields of view. Computational simulations were performed to model restricted diffusion to infer compartment size, i.e. fiber diameter. These data revealed a consistent relationship between the dimensions of the diffusion probability density function and characteristics of tissue microstructure, and the virtual super-imposition of the distributed mesoscale myofiber tracts. The identification of the cells comprising mesoscale myoarchitecture provides a direct anatomical validation for DSI tractography and a method for relating information at the cellular level with morphogenesis of tissues.
Chapter 4
In vivo: lingual myoarchitecture
and local mechanics
In this chapter we demonstrate how MRI methods can be applied in vivo to study complex muscle architecture and its relation to mechanics. The tongue was selected for study because of its accessibility by surface coils, relative freedom from motion due to respiration and heart beats, and for its well known structural intricacy. We first explain the concept of crossing fibers and hydrostat function, then explain how diffusion derived myoarchitecture and strain rate imaging were used to study the propulsive phase of the swallow. This application of technologies is new and has brought diffusion imaging of myoarchitecture closer to clinical application.
4.1
Muscular hydrostats
A muscular hydrostat is a body or appendage, consisting almost entirely of muscle,
that both creates motion and provides structural support for that motion. The entire body of an organism may be a muscular hydrostat. as are the bodies of some wornis, or the muscular hydrostat may be an appendage originating from a bony prominence,
such as the tongue and elephant trunk.
To illustrate what is meant by the term muscular hydrostat, let us consider a highly simplified model of a non-muscular hydrostat. the well-known water balloon.
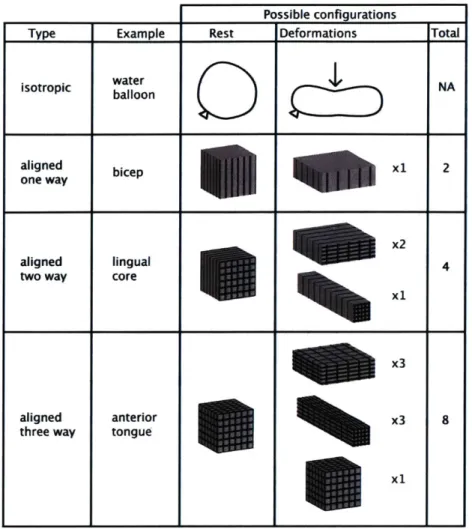
We know intuitively this objects key mechanical properties, that is, highly elastic rubber-constituted walls and aqueous contents, which by its isotropic nature allows the balloon to deform equally in all directions in response to the application of pres-sure. As shown in the first row of Figure 4.1.1. pressure applied from any single direction will result in passive compressive deformation of the balloon in that direc-tion and commensurate expansion in the two orthogonal direcdirec-tions. Extending this concept, passive compression of the balloon from two directions simultaneously will result in commensurate expansion in the remaining direction. A muscular hydro-static tissue differs from this simplified balloon model in two fundamental ways: 1) The internal structure of the tissue is not homogeneous, but rather is comprised of narrow and elongated anatomical units, i.e. muscle fibers, surrounded by a relatively inflexible interstitium. The tissue will thus deform preferentially along the long axis of the muscle fibers, rather than transverse to the long axis of the fibers. 2) De-formation of a muscular hydrostat results from shortening, i.e. contraction, along the long axis of internally located muscle fibers, or stretching, i.e. elongation, of the tissue resulting from the contraction of externally located muscle fibers. As a result,
a muscular hydrostat is constrained in the manner in which it may deform by the orientation and contractile properties of its constituting fibers, a property termed anisotropic deformation. If we now consider a muscular tissue whose fibers are all aligned in the same direction (second row of Figure 4.1.1), such as the skeletal muscle of the extremities, such as tissue has the capacity to compress with fiber shortening only along the long axis of its fibers and to expand only in directions orthogonal to the long axis of its fibers. On the other hand, if we consider a tissue whose fibers are crossed orthogonally to each other, such as the core region of the mammalian tongue (third row of Figure 4.1.1), it is capable of compressing or expanding in one or mul-tiple directions, depending upon the extent to which particular fiber populations are involved, to generate localized stiffening and/or displacements associated with speech and swallowing.
Hydrostatic deformation is associated with the
juxtaposition
of muscle fiber arrays obliquely oriented to each other. at both the microscopic and macroscopic scales. TheFigure 4.1.1: The concept of a muscular hydrostat is defined in this figure. Given the presence of local anisotropy in a muscular tissue, the complexity of fiber alignment determines the number of possible deformations attainable.
existence of crossing fibers allow for the possibility of synchronized multi-directional contraction and isovolemic deformation. The results of this model demonstrate that synergistic contractions of fibers at orthogonal or near orthogonal directions to each other is a necessary condition for volume conserving deformation. In conclusion evi-dence is provided in support of the supposition that hydrostatic deformation is based on the contraction of orthogonally aligned intramural fibers functioning as a mechan-ical continuum.
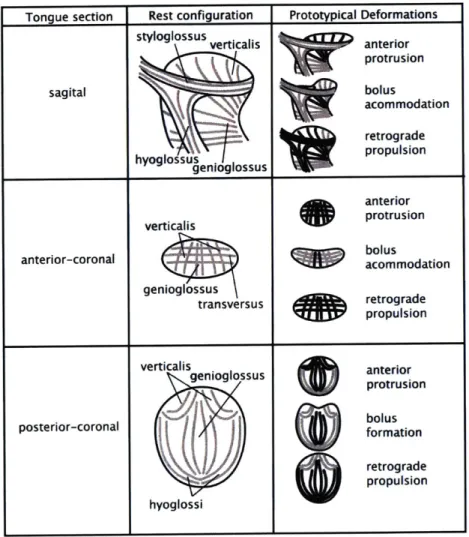
We present in Figure 4.1.2 a series of conceptual drawings indicating which muscles might contribute to the formation of several prototypical shapes. namely. anterior directed protrusion. bolus accommodation during swallowing. and retrograde bolus
39
Possible configurations
Type Example Rest Deformations Total
isotropic water NA balloon C aligned bicep X1 2 one way aligned lingual x2 4
two way core
x3
aligned anterior x3 8
three way tongue
propulsion during swallowing. In each case, the deformations are depicted from the sagittal, anterior coronal, and posterior coronal perspectives. In each instance, the specific deformation is described from the perspective of contributions of intrinsic and extrinsic fiber populations, and is viewed in the context of its hydrostatic properties. The fact that the tissue embodies fibers with extensive and complex crossing patterns emphasizes that the tissue is capable of compression or expansion in one or many directions based on the specific fiber populations which are active.
Figure 4.1.2: Conceptual drawings depicting the way in which synergistic contrac-tions involving the intrinsic and extrinsic muscles may contribute to prototypical deformations, namely anterior protrusion, bolus accommodation during swallowing. and retrograde propulsion during swallowing.
Anterior protrusion appears to result principally from the synchronous contrac-tion of the tranversus and verticalis fibers. The role of the genioglossus in this rather
Tongue section Rest configuration Prototypical Deformations
styloglossus verticalis anterior
protrusion sagital bolus acommodation retrograde hyoglossus propulsion genioglossus anterior verticalis protrusion anterior-coronal bolus I acommodation genioglossus transversus retrograde propulsion verticalis anterior
genioglossus an~ rteruion
protrusion
posterior-coronal
11
bolusformationbi rretrograde
propulsion hyoglossi
simple deformation is controversial, but in general it appears to be less important in humans as compared to other mammalian species for which forceful extension and manipulation of the tongue is critical for obtaining food. The process of bo-lus accommodation is important for all mammalian species for forming the ingested morsel of food into a bolus, which then may be propelled retrograde in the course of swallowing. The exact method by which bolus accommodation is accomplished thus defines the physical limits of oral ingestion and embodies important species spe-cific functionality. In this regard, note the prominent role believed to be exerted by graded contraction of the midline genioglossus fibers in humans, while also acknowl-edging the contribution of intrinsic fibers towards the stiffening and broadening the bolus accommodating concavity. Lastly, let us consider the complex set of events contributing to the rapid and forceful reconfiguration of the tongue as it facilitates bolus movement from the oral cavity to the pharynx. Given the diverse forms and sizes taken by the bolus, it is reasonable to postulate the involvement of multiple synergisms involving at varying orientations to each other. It might reasonably be predicted that retrograde lingual propulsion involves the coordinated actions of the genioglossus, hyoglossus, styloglossus merging with the inferior longitudinalis, as well as the stiffening effect of bidirectional contraction of the core lingual fibers. The pre-cise delineation of which muscles contribute to specific functional deformations of the tongue and to what degree they are active in modulating adaptive lingual mechanics will require considerable further research.
4.2
Myoarchitecture of the human tongue
The tongue is an intricately configured muscular organ, which is responsible for the manipulation and transport of food in the oral cavity during swallowing, as well as the subtle variations in shape and stiffness needed for human speech. The tongues invoarchitecture consists of a large array of variably aligned and extensively interwo--en intrinsic (without attachment to bony surfaces) and extrinsic (with attachment to bony surfaces) muscles. The intrinsic musculature consists of a core region of
orthogonally-aligned fibers, contained within a sheath-like bundle of longitudinally oriented fibers. The intrinsic fibers are delicately merged with extrinsic muscles that modify shape and position from a superior direction (palatoglossus), posterior direc-tion (styloglossus), and inferior direcdirec-tion (genioglossus and hyoglossus). It is generally believed that these fibers function synergistically to constitute a near limitless number of physiological deformations.
To visualize the complex myoarchitecture of the tongue this experiment employed MRI sensitized to the directionality of water diffusion [70. 39]. Diffusion weighted imaging has the capacity to resolve anisotropic particle movement, and thus infer fiber organization at a voxel scale in biological tissue [4, 27, 30, 47, 87]. The anisotropy of water diffusion in skeletal muscle in particular has been demonstrated and anatom-ically validated [8, 31, 32, 82, 10]. In the ex vivo bovine tongue, diffusion tensor fields were exploited to produce a virtual anatomical displays [25, 83]. Acknowledg-ing the limitations of a diffusion tensor to describe fiber alignment in the context of intravoxel fiber crossing or divergence, lingual myoarchitecture in excised tissue was imaged with diffusion spectrum imaging (DSI), a method which depicts complex fiber relationships in terms of the multimodal behavior of a probability distribution function (PDF) and the multivoxel associations of the local diffusion environments were represented with tractography [26, 22]. In the aggregate, these studies allowed for the reconsideration of lingual myoarchitecture in terms of macroscopic tract-like structures that constitute an anatomical template for local tissue deformation. The logical extension of this approach to the in vivo realm should allow correlation of macroscopically resolved myofiber tracts with local deformation in humans. The use of DSI in vivo, however, is compromised by poor signto-noise related to short al-lowable imaging times. As an alternative approach, we employed multiple gradient direction diffusion tensor imaging (DTI) with tractography. While lacking the ability to resolve intravoxel crossing fibers., DTI tractography may well have the capacity to resolve intervoxel crossing and non-crossing fibers at scales which are relevant since they coincide with the practical dimensions of mechanical deformation.
61. 78. 12, 20] and skeletal muscular tissue in vivo [67, 19. 69. 23]. In the current
study, we have modified our approach in several specific ways: First, we employed an increased number of different diffusion sensitizing gradients to improve angular pre-cision [56, 34]. Second, to reduce potential bias in the more heterogeneously oriented tissue of the tongue, we used isotropic voxels. Third, for improved SNR in the region of interest, two surface coils were used with overlapping sensitive volumes. Lastly, we incorporated the method of tractography to provide data of intervoxel geomet-ric association, and thus allow important structure-function inferences. Our results demonstrate the feasibility of resolving the highly complex anatomical relationships characteristic of the human tongue using DTI tractography.
4.2.1
Methods for in vivo DTI tractography
The lingual myoarchitecture of 5 normal human subjects was investigated using DTI tractography. Subjects were instructed to attempt to refrain from motion during each scan and to position the tongue in the oral cavity in a naturally occurring configu-ration, thus minimizing the air space around the tongue. Data was acquired using a
1.5 T system (Avanto, Siemens Medical Systems, Erlangen, Germany) equipped with
two custom-built surface coils, each approximately 60 mm x 60 mm. The surface coils were mounted on thin plastic sheets, placed flush against each cheek and gently se-cured. In this study, we employed a twice-refocused spin echo DTI pulse sequence to reduce eddy current distortions [60]. The pulse sequence incorporated standard single shot echo-planar (EPI) spatial encoding. Imaging parameters were as follows: TR
3 s, TE = 80 ms, field of view 192 mm x 192 mm, 24 slices. 3 mm slice thickness. A
b-value of 500 s/mm2 was chosen to give adequate diffusion weighting while retaining
a sufficiently high signal-to-noise ratio. Diffusion-weighting gradients were applied in 90 unique directions in addition to 15 non-diffusion weighted volumes. Complete tongue acquisitions were accomplished in 5 mmn. 15 s.
Streamline construction through tractography was employed to generate multi-voxel scale tracts along vectors corresponding to directions of maximal diffusion in each voxel. In the current work. we emnployed an angular threshold of ±35' to define