HAL Id: inserm-00459003
https://www.hal.inserm.fr/inserm-00459003
Submitted on 23 Feb 2010HAL is a multi-disciplinary open access archive for the deposit and dissemination of sci-entific research documents, whether they are pub-lished or not. The documents may come from teaching and research institutions in France or abroad, or from public or private research centers.
L’archive ouverte pluridisciplinaire HAL, est destinée au dépôt et à la diffusion de documents scientifiques de niveau recherche, publiés ou non, émanant des établissements d’enseignement et de recherche français ou étrangers, des laboratoires publics ou privés.
Bruno Louis, Karl Leroux, Maud Boucherie, Daniel Isabey, Véronique
Grillier-Lanoir, Brigitte Fauroux, Frédéric Lofaso
To cite this version:
Bruno Louis, Karl Leroux, Maud Boucherie, Daniel Isabey, Véronique Grillier-Lanoir, et al.. Pressure stability with CPAP devices: A bench evaluation.. Sleep Medicine, Elsevier, 2010, 11 (1), pp.96-9. �10.1016/j.sleep.2009.02.011�. �inserm-00459003�
Brief communication
Pressure Stability with CPAP Devices: a Bench Evaluation Bruno Louisa; Karl Lerouxb, Maud Boucheriec, Daniel Isabeya,
Véronique Grillier-Lanoirb, Brigitte Faurouxd,e , PhD; and Frédéric Lofaso, a,f,*
a INSERM, Unit 841, and Université Paris 12, Faculté de Médecine, Créteil, F94010, France bADEP Assistance, Puteaux, Paris
cRespiratory division, Covidien, Elancourt, France
dAP-HP, Hôpital Armand Trousseau, Pediatric Pulmonary Department
Paris, France
eUniversité Pierre et Marie Curie-Paris6, INSERM UMR S-893, équipe 12, Paris, France fAP-HP, Raymond Poincaré Teaching Hospital, Université Versailles-St Quentin en
Yvelines, Physiology – Functional Testing, and Technological Innovations Centre, 92380 Garches, France
Correspondence
Prof. F. LOFASO, Service de Physiologie-Explorations Fonctionnelles, Hôpital Raymond Poincaré, 92380 GARCHES, FRANCE
Tel: (+33) 147 107 941; Fax: (+33) 147 107 943; E-mail: [email protected]
Word count, abstract: 182
Word count,body of text: 1750
Conflicts of interest: Maud Boucherie and Véronique Grillier-Lanoir are employed by
Covidien Inc., which supported this study (Covidien paid INSERM 15 000 euros for this
ABSTRACT
Background: Continuous positive airway pressure (CPAP) maintains a constant pressure to
reduce the patient’s work of breathing (WOB). The aim of this study was to measure the additional WOB imposed by four current CPAP devices during simulation of a difficult, but commonly encountered, clinical situation.
Method: A flow contour of a patient under CPAP and its respiratory mechanic were
simulated. The devices were tested at a CPAP of 15 cm H2O, with a heated humidifier and a
nasal pillow, which increased circuitry resistance, and with and without a simulated unintentional leak.
Results: With no leak, PEEP at the interface varied across devices from 14.0 to 15.3 cm H2O.
With a leak of 1 L/sec, PEEP varied from 11.5 to 17.1 cm H2O. Imposed inspiratory WOB
ranged from less than 0.1 J/min to 0.45 J/min with no leak, and the range broadened with leaking. Findings were similar for the imposed expiratory WOB.
Conclusion: The performances of CPAP devices are variable. The device that calibrated for
the pressure loss in the circuitry under dynamic conditions and made appropriate pressure adjustments outperformed the other devices.
Key words: continuous positive airway pressure, obstructive sleep apnoea, work of breathing,
Continuous positive airway pressure (CPAP) devices for treating obstructive sleep apnoea syndrome (OSA) at home generally use turbine motors. Since the 1980s, the turbines are servo-controlled to reduce the impedance of the respiratory system [1], thereby avoiding inspiratory and expiratory loads, which interact additively to generate respiratory discomfort [2]. Servo-controlled CPAP devices have been improved over the years. In parallel, the conditions of CPAP use have changed. The circuitry resistance has been increased by the standard practice of using a heated humidifier, as recommended by the American Academy of Sleep Medicine [3], and by the growing use of nasal pillows as a first-line interface [4, 5]. High CPAP levels may be required in patients with severe obstruction, and manufacturers claim that their CPAP devices compensate for major unintentional leaks.
The aims of this study were to assess the ability of four current CPAP devices to maintain constant airway pressure during a simulated respiratory cycle with the above-described circuitry and to maintain the set pressure when leaks occur.
MATERIAL AND METHOD CPAP devices tested
We tested the Sandman® (Covidien, Elancourt, France; Boulder, CO), the Spirit 8 V1® and Spirit 8 V2® (ResMed, Saint Priest, France; North Ryde, Australia), and the Remstar Mseries Auto Aflex® (Respironics, Nantes, France; Murrysville, PA). The interface was the Mirage SwiftTMII (ResMed) nasal pillow, because only ResMed recommended using their own masks. All the tested CPAPs had an integrated heated humidifier. The resistances of these humidifiers were similar and were nearly twice higher than the resistance of the circuit (length 1.80 meter). For example, the resistances of the circuit, the Sandman humidifier, the Spirit 8 humidifier and the Remstar humidifier, were respectively 0.33, 0.73, 0.68 and 0.62 cmH2O/L/sec at 1 L/sec. When the intentional leak was occluded, the nasal pillow pressure
Experimental set-up
The experimental set-up has been described elsewhere [6, 7]. Briefly, the auto-CPAP device was connected via a standard circuit to a two-chamber Michigan test lung. To simulate breathing cycles, the second chamber of the Michigan test lung (driving chamber) was connected to a flow-rate generator that could produce various waveforms previously stored in a microcomputer. This breath waveform simulator was developed in our laboratory. It relies on pressurized air, flow-rate measurement, and a servo-valve. The simulator continuously adjusts the servo-valve via a microcomputer to produce the desired flow rate. To mimic the mechanical characteristics of an overweight patient, the compliance of the testing chamber was adjusted to 60 ml/cm H2O. A parabolic resistance (Rp5, Pneuflo®, Michigan Instruments,
Grand Rapids, MI) of 2.7 cm H2/L/sec at 1 L/sec was added at the entrance of the testing
chamber. A small metal component allowed the driving chamber to displace air into the testing chamber, but not the opposite. Flow rate and pressure were measured between the extremity of the nasal pillow and the parabolic resistance. Flow rate was inferred using a pneumotachograph (Fleisch #2, Lausanne, Switzerland) connected to a differential pressure transducer (Validyne MP 45, Northridge, CA; ± 3 cm H2O), and pressure was inferred using a
pressure transducer (Validyne MP 45; ±35 cm H2O). Pressure and flow rate signal outputs
were digitised at 200 Hz (MP100, Biopac Systems, Goleta, CA) and recorded in a microcomputer for further analysis.
Protocol
We simulated a rounded inspiratory flow contour with a frequency of 15 cycles·min-1 for 2 minutes. The inspiratory flow contour was from a patient with obstructive sleep apnoea successfully treated with CPAP, as published by Condos et al. [8] (Figure 5, first cycle). Tidal volume was 420 ml, maximal inspiratory flow 520 ml/sec, and inspiratory time 1.15 sec.
Expiratory time was adjusted to obtain an adequate respiratory frequency. Measurements were made at a CPAP of 15 cm H2O. A leak valve was added to simulate leaking through the
mouth during CPAP. Three leak levels were tested (0 L/sec, 0.5 L/sec, and 1 L/sec). For each condition, at least 20 stable cycles were analysed.
Analysis
A pressure-volume loop was used to quantify the imposed WOB, as previously described [1]. The loop was split by a line passing through the values corresponding to zero-flow points. Imposed inspiratory WOB corresponded to the area between this line and the inspiratory pressure curve below it, and imposed expiratory WOB to the area between this line and the expiratory pressure curve above it. We measured mean inspiratory and expiratory pressures, positive end-expiratory pressure (PEEP), pressure variation during inspiration (ΔP), and time delay from inspiration onset to the minimal airway-pressure value (ΔT) (Figure 1).
RESULTS
Figure 2 shows the pressure-volume curves obtained with the four devices with and without leaks. Considerable differences were observed across devices. PEEP, mean inspiratory and expiratory pressures, and the effects of leaks differed between the Sandman and the other devices (Figure 2, Table 1). With and without leaks, mean inspiratory pressure exceeded mean expiratory pressure with the Sandman device, whereas the opposite occurred with the three other devices (Figure 2, Table 1).
With no leak, PEEP ranged from 15.3 cm H2O with the Sandman device to 14.0 cm
H2O with the Remstar device (Table 1). Between the best and worst device, imposed WOB
during inspiration and expiration increased 5-fold and 10-fold, respectively (Table 1).
Leaks increased the differences across devices (Figure 2, Table 1). PEEP decreased
1 L/sec, PEEP ranged from 17.1 cm H2O with the Sandman device to 11.5 cm H2O with the
Remstar device (Table 1). Imposed WOB, ΔP, and ΔT increased with the size of the leak (Figure 2, Table 1).
DISCUSSION
The devices tested in this study failed to maintain the desired PEEP and to keep the airway pressure constant throughout the respiratory cycle. The pressure instability generated additional WOB. Pressure variation and imposed WOB differed across devices, and these differences increased when leaks occurred. With three devices, increased WOB during leaks was associated with decreased PEEP; in contrast, PEEP increased substantially with the Sandman device.
Previous studies demonstrated differences among servo-controlled CPAP devices for maintaining a constant pressure with CPAP devices when simulating breathing [1, 9, 10]. Our study confirmed these previous studies [1, 9, 10], extended the observation on the last generation of CPAP devices and when simulating a real sleep apnoea syndrome breathing pattern treated by a CPAP device previously published in the literature [8], and demonstrated that this pressure fluctuation was aggravated by leak. In addition, we observed that PEEP and mean pressure were not maintained in some devices when leak occurred.
The breathing pattern chosen for this study [8] did not correspond to a high ventilatory demand. Our circuits included heated humidifiers and a nasal pillow which are more and more frequently used [11]. However, we acknowledge that although the high pressure level used in the study might occur in clinical practice, it is rarely prescribed. In fact the characteristics of our set-up (pressure level, heated humidifier, nasal pillow, and leaks) were chosen to test the performances of the CPAP devices in the worst but possible conditions. Thus, a high level of CPAP is generally more difficult to maintain than a lower one[1], and
increased resistance of the circuitry may promote pressure variations .We evaluated the effects of leaks, which are common when using high pressure levels and can affect CPAP device performance by increasing the delivered flow [1, 9]. The imposed WOB was smallest with the Sandman device. Like the other devices, the Sandman device monitors pressure inside the machine in order to control a blower motor and regulate the pressure. In contrast with the other devices, the Sandman device includes an auto calibration based upon the pressure drop flow relationship of the patient circuit when the patient is disconnected of the CPAP. allowing the Sandman device to compensate for the pneumatic variances and pressure drops resulting from the unique configuration of the patient circuit and mask.
With the Sandman device, mean inspiratory pressure was consistently greater than mean expiratory pressure and PEEP increased with the size of the leak, suggesting slight overcorrection of the deleterious effects of the circuitry impedance. This slight pressure overcorrection during inspiration is akin to a minimal inspiratory pressure-support level, which may avoid the deleterious effects of the circuitry [12]. With the three other devices, the additional WOB was higher, and PEEP decreased as leak size increased.
Total imposed WOB, obtained by summing the imposed inspiratory and expiratory WOB values, ranged from 0.01 to 0.086 J/cycle with no leak. Under similar conditions, but with less circuitry resistance than in our study, total WOB imposed by first-generation servo-controlled CPAP devices ranged from 0.030 to 0.180 J/cycle [1]. Thus, CPAP devices have improved substantially over the last 15 year. However, the WOB imposed by some devices remains high: with no leak, imposed inspiratory WOB values of up to 0.45 J/min, i.e., about 13% of the total inspiratory WOB during quiet breathing [1], were found in our study. In addition, leaks were associated with large increases in both inspiratory and expiratory WOB with some devices (>1 J/min when leak = 0.5 L/sec).
Although imposed WOB may not generate respiratory muscle fatigue in patients without respiratory insufficiency, it may cause discomfort. For example, the levels of imposed WOB seen with some of the devices tested here were associated with major increases in respiratory discomfort in tracheostomized patients [13]. However, data from these patients with severe chronic respiratory failure may not apply to patients with OSA, whose daytime respiratory function is often normal. In healthy adults, normal nasal resistance after decongestant was 1.60.6 cm H2O/L/sec and artificially increasing the nasal resistance to 40% (about 0.65 cm
H2O/L/sec) led to breathing difficulty being reported by 13% of individuals [14] With the
maximal inspiratory flow of 530 ml/sec in our study, a comparable resistance increase would decrease the inspiratory pressure to 0.35 cm H2O, which is far less than observed in our study.
Therefore, we are confident that the differences found across CPAP devices would have clinical consequences in terms of respiratory sensation.In conclusion, 15 years after the introduction of CPAP devices with servo-controlled turbines to minimize pressure variations during spontaneous breathing and during leaks, some CPAP devices still fail to maintain the desired pressure in the upper airway. A device that measures the pressure loss in the circuitry and uses the result to adjust the pressure under dynamic conditions outperformed the other devices.
REFERENCES
[1] Lofaso F, Heyer L, Leroy A, Lorino H, Harf A, Isabey D. Do turbines with servo-controlled speed improve continuous positive airway pressure generation? Eur Respir J 1994;7:2077-81.
[2] Nishino T, Isono S, Ishikawa T, Shinozuka N. An additive interaction between different qualities of dyspnea produced in normal human subjects. Respir Physiol Neurobiol 2007;155:14-21.
[3] Kushida CA, Littner MR, Hirshkowitz M, Morgenthaler TI, Alessi CA, Bailey D, Boehlecke B, Brown TM, Coleman J, Jr., Friedman L, Kapen S, Kapur VK, Kramer M, Lee-Chiong T, Owens J, Pancer JP, Swick TJ, Wise MS. Practice parameters for the use of continuous and bilevel positive airway pressure devices to treat adult patients with sleep-related breathing disorders. Sleep 2006;29:375-80.
[4] Chai CL, Pathinathan A, Smith B. Continuous positive airway pressure delivery interfaces for obstructive sleep apnoea. Cochrane Database Syst Rev 2006:CD005308.
[5] Massie CA, Hart RW. Clinical outcomes related to interface type in patients with obstructive sleep apnea/hypopnea syndrome who are using continuous positive airway pressure. Chest 2003;123:1112-8.
[6] Fauroux B, Leroux K, Desmarais G, Isabey D, Clement A, Lofaso F, Louis B. Performance of ventilators for noninvasive positive pressure ventilation in children. Eur Respir J 2008;31:1-8.
[7] Lofaso F, Desmarais G, Leroux K, Zalc V, Fodil R, Isabey D, Louis B. Bench evaluation of flow limitation detection by automated continuous positive airway pressure devices. Chest 2006;130:343-9.
[8] Condos R, Norman RG, Krishnasamy I, Peduzzi N, Goldring RM, Rapoport DM. Flow limitation as a noninvasive assessment of residual upper-airway resistance during continuous positive airway pressure therapy of obstructive sleep apnea. Am J Respir Crit Care Med 1994;150:475-80.
[9] Bacon JP, Farney RJ, Jensen RL, Walker JM, Cloward TV. Nasal continuous positive airway pressure devices do not maintain the set pressure dynamically when tested under simulated clinical conditions. Chest 2000;118:1441-9.
[10] Schäfer T, Vogelsang H. Pressure stability of nasal CPAP and bilevel devices. Somnologie 2002;6:79-84.
[11] Kakkar RK, Berry RB. Positive airway pressure treatment for obstructive sleep apnea. Chest 2007;132:1057-72.
[12] Beydon L, Chasse M, Harf A, Lemaire F. Inspiratory work of breathing during spontaneous ventilation using demand valves and continuous flow systems. Am Rev Respir Dis 1988;138:300-4.
[13] Prigent H, Orlikowski D, Blumen MB, Leroux K, Legrand L, Lejaille M, Falaize L, Ruquet M, Raphael JC, Lofaso F. Characteristics of tracheostomy phonation valves. Eur Respir J 2006;27:992-6.
[14] Warren DW, Mayo R, Zajac DJ, Rochet AH. Dyspnea following experimentally induced increased nasal airway resistance. Cleft Palate Craniofac J 1996;33:231-5.
Figure Legends
Figure 1: Graphic measurement of positive end-expiratory pressure (PEEP), mean inspiratory
pressure (Mean ins P), mean expiratory pressure (Mean exp P), pressure variation from PEEP to the minimal value during inspiration (ΔP), and time from inspiration onset to the minimal airway-pressure value (ΔT).
Figure 2: Pressure-volumes curves for each of the CPAP devices set at a pressure of 15 cm
H2O, with the three leak sizes tested (0 L/sec, 0.5 L/sec, and 1 L/sec). The solid lines
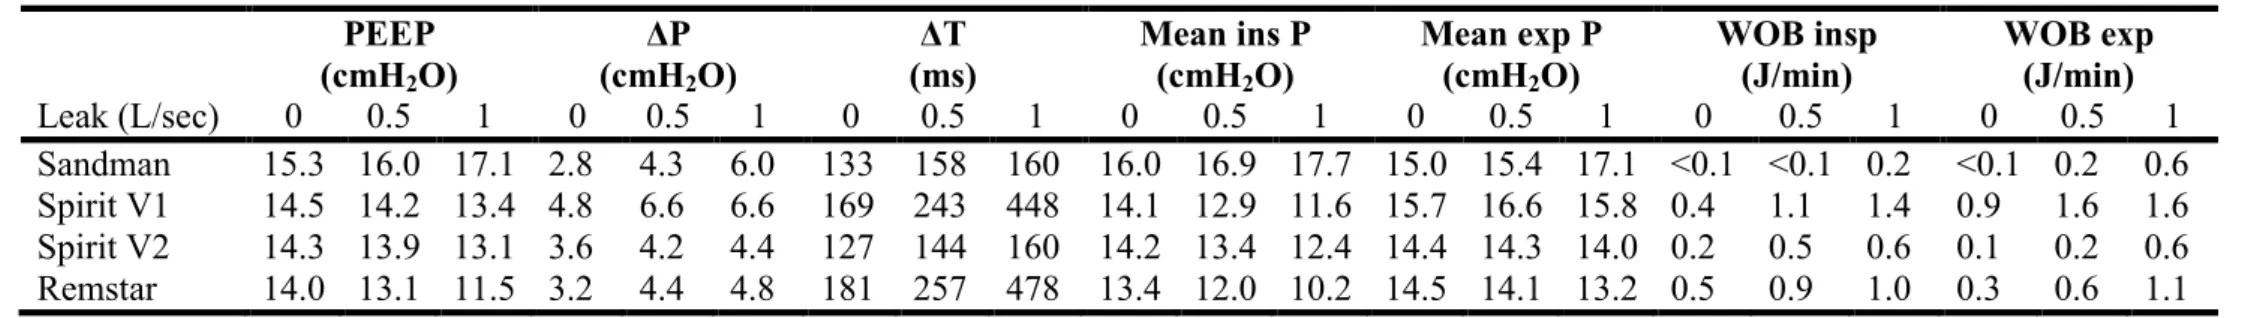
Table 1: Performance of the CPAP devices PEEP (cmH2O) ΔP (cmH2O) ΔT (ms) Mean ins P (cmH2O) Mean exp P (cmH2O) WOB insp (J/min) WOB exp (J/min) Leak (L/sec) 0 0.5 1 0 0.5 1 0 0.5 1 0 0.5 1 0 0.5 1 0 0.5 1 0 0.5 1 Sandman 15.3 16.0 17.1 2.8 4.3 6.0 133 158 160 16.0 16.9 17.7 15.0 15.4 17.1 <0.1 <0.1 0.2 <0.1 0.2 0.6 Spirit V1 14.5 14.2 13.4 4.8 6.6 6.6 169 243 448 14.1 12.9 11.6 15.7 16.6 15.8 0.4 1.1 1.4 0.9 1.6 1.6 Spirit V2 14.3 13.9 13.1 3.6 4.2 4.4 127 144 160 14.2 13.4 12.4 14.4 14.3 14.0 0.2 0.5 0.6 0.1 0.2 0.6 Remstar 14.0 13.1 11.5 3.2 4.4 4.8 181 257 478 13.4 12.0 10.2 14.5 14.1 13.2 0.5 0.9 1.0 0.3 0.6 1.1 PEEP: positive end-expiratory pressure; ΔP: pressure variation from PEEP to the minimal value during inspiration; ΔT: time from inspiration onset to the minimal airway-pressure value; Mean ins P: mean inspiratory pressure; Mean exp P: mean expiratory pressure; WOB insp: inspiratory work of breathing imposed on the patient; WOB exp: expiratory work of breathing imposed on the patient.