Design, Manufacture, and Application of DNA
Microarrays to Study Gene Expression Phenotypes of
Lysine-Producing Corynebacterium glutamicum
by
Christopher Roberge
B.S. in Chemical Engineering (1993)
Massachusetts Institute of Technology. Cambridge, MA
Submitted to the Department of Chemical Engineering in partial fulfillment of the requirements for the degree of
Doctor of Philosophy in Chemical Engineering
at the OFCNO
MASSACHUSETTS INSTITUTE OF TECHNOLOGY JUN 0 12005
June 2005 LIBRARIES
C 2005 Massachusetts Institute of Technology. All rights reserved.
Signature of the Author...
Department of Chemical Engineering March 14, 2005
Certified by
C~u""by-····~77--.;I;I....
..." -
ji7
...
...
oytpaoo '
K7' '~ . Gregory Stephanopoulos.. Bayer Professor of Chemical Engineering Thesis Supervisor
r 7
Accepted
by
. ...-...
. ...
' . .. ...
Daniel BlankschteinProfessor of Chemical Engineering Chairman, Committee for Graduate Students
Abstract
Corynebacterium glutamicum partial genome DNA microarrays were constructed that
were capable of assaying the transcriptional profile of the genes of pathways involved in
central carbon metabolism and lysine biosynthesis. It was found that to ensure arrays of
high quality, protocols applying the arrays should include DNase treatment of RNA samples. additional RNA filtration purification steps, and the use of gene specific primers
in the formation of labeled cDNA through reverse transcription. After implementing these procedures, the accuracy and reproducibility of the array data were validated. The
microarrays were used to explore the effects of the over-expression of the key anaplerotic
enzyme pyruvate carboxylase and the use of different medium carbon source
compositions, both of which have been shown to influence the yields of biomass on carbon and of lysine on biomass. Three different strains of C. glutamicum that were grown on six different minimal medium formulations that varied in their balance of glucose and lactate were assayed by isolating total mRNA samples from cultures in three
different phases of growth and lysine production. Genes associated with glycolysis and the pentose phosphate pathway showed decreased transcript concentrations as the
available carbon source was shifted from glucose to lactate, while those associated with the TCA cycle and the glyoxylate bypass demonstrated increased transcription. As the
cultures stopped generating biomass and began generating lysine, mRNA of genes associated with lysine synthesis and export was measured at elevated concentrations.
Reduced gene expression trends seen for aspartokinase and aspartate semialdehyde
dehydrogenase suggest that the enzymes are bottlenecks to lysine production, particularly
when pyruvate carboxylase is over-expressed and lactate is the available carbon source. This over-expressing strain also had higher transcription levels of the genes of biotin
synthesis. and lower transcription levels of the acyl-coA carboxylases dtsRl, dtsR2, accC, and accD. Other results implied that malic enzyme is co-expressed with pyruvate
carboxylase to better allow cultures grown on lactate to produce NADPH in the absence of significant pentose phosphate pathway flux. Also, the transcriptional and flux profiles
isotopically labeled glucose and lactate were determined simultaneously from the same set of actively growing and lysine-producing cultures. Flux maps for each of the four combinations of strain and medium were constructed using calculations derived from metabolite balances and GC-MS measurements of the isotopic distributions within biomass hydrolysates of the pseudo-steady-state cultures. Comparisons of the two sets of data showed that 19 of 28 pairs of flux and transcription measurements had trends with good agreement with one another. Different pathways of the metabolic network were
found to be controlled via transcription in varying degrees. On average, the Embden-Meyerhof-Parnas pathway was shown to be less likely to be regulated though
transcription than the pathways of the tricarboxylic acid cycle and central carbon anaplerosis. In the split pathway available to the cells for producing lysine, the succinylation branch showed an increase in flux for only the case of a pyruvate carboxylase over-expressing strain that was grown on lactate, while the alternate dehydrogenation branch showed a complementary decrease in flux. These flux changes were matched by changes in transcription that only occurred for the same culture and growth medium. Through these findings we have demonstrated the application of C.
glutamicum DNA microarrays to the determination of how the cells regulate their
responses at the transcriptional level to changes in both gene over-expression and
Acknowledgements
The work of this thesis benefited enormously from the direct and indirect contributions
of many people, whose influence helped to shape and support my research. I'll always be
grateful for what they allowed me to accomplish.
Firstly, I need to thank my advisor, Greg Stephanopoulos, for treating me with the perfect balance of patience and prodding. He gave me the freedom to find my own
solutions to the problems that I encountered, but also pointed me in the best directions to get help and advice when I most needed it. He and the other members of my thesis
committee-Charles Cooney, Alan Grossman, Kristala Prather, Anthony Sinskey, and George Stephanopoulos-gave so much of their time and advice. Their recommendations and the discussions that I had with them were incredibly valuable in streamlining my work and giving it focus. I especially want to thank Profs. Cooney and Prather for assisting me by joining my committee later in the process and for being such insightful and encouraging committee members.
In the Stephanopoulos lab group I was most fortunate to be able to work with Mattheos Koffas and Kohei Miyaouko. Mattheos gave me a great introduction into the lab, helped me to learn many of the techniques that I would need again and again, and acted as my
resident C. glutamicum expert. Kohei was an invaluable coworker who helped me design
and carry out all of the flux analyses work, even once I was hundreds of miles away. When I say that I couldn't have finished the thesis the way it is now without him, I
couldn't be more literal.
Many thanks go to Merck & Co., Inc., for the extremely generous financial and career development support without which I could not have pursued this degree. I will always
be grateful to Michel Chartrain and Barry Buckland, my mentors and bosses at Merck, who championed my return to MIT and made this opportunity a reality for me. I also
want to thank Jeffrey Moore, Ali Shafiee and David Robinson of MRL, who steadfastly
and patiently supported my completion of my graduate work since my return to Merck in
helped me on different Merck projects when I needed to take time off to carry out the last
of my experiments.
Finally, my growing family has been the steadiest source of inspiration and support that
I have. Throughout my time at MIT they have been some of my most valuable advocates and teachers. I want to thank my parents, Kenneth and Barbara who have always been more sure of what I am capable of than I often am. So much of what I achieved was the
result of trying things I might not have without having them as my constant cheerleaders.
I want to thank my parents-in-law, Dr. Daniel and Sarah Park for keeping me in their
prayers, and for even enlisting the patronage of the Roman Catholic Church of St. John
Nam to aid in the cause. The depths of their thoughtfulness continue to mean so much to me. I want to thank Lauren, for wishing me "Good Luck, Daddy!" on my way to my defense, and for so often providing a good tickling session to keep everything in perspective. And most of all I want to thank my best friend and wife, Keum, for always being so loving and immensely giving. Knowing her has been an absolute blessing, and being able to share so much with her has brought me more joy than anything else. There
is no companion that I would rather have with me on the journeys of my life, and this thesis was certainly a major one. With her beside me, I look forward to starting down the next path.
Table of Contents
A BSTRA^CT ... 2 ACKNOWL DGEMENTS ... 4 TABLE O CONT NTS ... 6 LIST O F F IG RIS ... 9 LIST OF TABL ES ... ... 12 CHAPTER 1: INTRODUCTION ... 14 1. I MoTIVATION ... 14 1.2 ECTI S ... 16 1.3 A PP OAC ... ...16 1.4 DESCRIPTION OF THESIS ... 18 CHAPTER 2: BACKGROUND ... 19 2.1 CORYNIEBACTERIUM GLUTAMICUM ... ... 19 2. 1. O erview ... /9 2. 1.2 Biochemisry ... 212. 1.2.1 [ m bden-M eyerhof-Pamas Pathway ... ... 21
2.1.2.2 Pentose Phosphate Pathway ... 23
2.1.2.3 'I'ricarboxylic Acid Cycle ... 24
2.1.2.4 Anaplerotic Pathways ... 26
2.1.1.4.1 Overview ... 26
2.1.2.4.2 Pyruvate Carboxylase and PEP Carboxylase ... 27
2.1.2.4.3 Malic Enzyme ... 28
2.1.2.4.4 Phosphoenolpyruvate Carboxykinase ... 28
2.1.2.4.5 G lyoxylate Bypass ... 29
2. 1.2.5 ,ysine Synthesis Pathway ... ... 30
2.1.2.6 Other Pathways ... ... 32
2. 1.3 Effects of Carbon Source ... 34
2. 1.4 Effects of Over-expression of Aspartokinase and Pyruvate Carboxylase ... 3 7 2.2 DNA MICROARRAYS ... 40
CHAPTER 3: DEVELOPMENT OF C. GLUTAMICUM DNA MICROARRAYS AND RELATED
PROTOCOLS
...
44
3.1 SEL.CTI)N AN) AMPLIFICATION OF DNA SEQUENCES ... 44
3. . 1 Use of Mycobacterium tuberculosis Gene Sequences ... 45
3.1.3 Polymerase Chain Reaction Protocol ... 55
3.2 AMPIIFIFD DNA PURIFICATION AND PRINTING ... 58
3.2. 1 PCR Product Isolation ... 58
3.2.2 Printing Pattern and Intraslide Replicates ... 60
3.3 RNA ISOLATION ... 62
3.3. 1 Initial RNA Isolation and Purification Protocol ... ... 62
3.3.2 EJ.[cts of Growth Phase on RNA Yield ... 63
3.3.3 Identification and Reduction of Genomic DNA Contamination ... 64
3.3.4 Identification and Reduction of RNA Degradation ... 66
3.3.5 Final RNA Isolation and Purification Protocol ... 68
3.4 CREATIN F LABEIED CDNA AND HYBRIDIZATION ... 70
3.4. 1 Effects of Fluorescent Label and cDNA Purification Protocol on Signal Properties ... 70
3.4.2 Application of Gene-Specific Primers ... 73
3.4.3 Final Reverse Transcription and Hybridization Protocols ... 75
3.5 DATA FILTERING AND NORMALIZATION ... 76
3.5. 1 Use of Alien DNA Sequences as Controls ... 76
3.5.2 Data Filtering and Normalization Protocols ... 79
CHAPTER 4: VALIDATION OF DNA MICROARRAYS AND EFFECTS OF CARBON SOURCE ON GENE TRANSCRIPTION ... 80
4.1 EXPE RIMI-'NTAIL DESIGN ... 80
4.2 REPRODIUCIBILITY STUDY ... 82
4.3 BIOLOGICAL CONSISTENCY STUDY ... 87
4.4 EFFECTS (F SPOTTEI) DNA SEQUENCE SIZE ... 91
4.5 EFFECTS OF SPOTTED DNA ORIGIN SPECIES ... 93
4.6 OTHER TRANSCRIPIONAL EFFECTS OF CARBON SOURCE ... 95
4. 6. 1 Overview ... 95
4. 6.2 Pentose Phosphate Pathw ay... ... 97
4. 6.3 Tricarboxylic Acid Cycle ... 98
4. 6. 4 Glyoxnylate Bypass ... ... ... 99
4.6.5 Malic Enzyme and Phosphoenolpyruvate Carboxykinase ... 1...00
4.6.6 Lysine Synthesis Pathw ay ... 101
4.6. 7 Biotin Synthesis Pathway ... ... 102
CHAPTER 5: EFFECTS OF GENE OVER-EXPRESSION AND MIXED CARBON SOURCES ON TRANSCRIPTIONAL PROFILES ... 103
5. 1 EXPERIMENTAI D-.ESIGN ... 103
5.2. 1 Yield of Biomass on Carbon ... 105
5.2.2 Yield of Lysine on Biomass ... 107
5.3 CARBON CONSUMPTION KINETICS ... 109
5.4 TRANSCRIPI()NA TREN S ... 115
5.4. 1 Overview ... 115
5.4.2 Embden-M eyerhof-Parnas Pathway ... ... 116
5.4.3 Pentose Phosphate Pathway ... 121
5.4. 4 Tricarboxylic Acid Cycle ... 122
5.4.5 Glvoxylate Bypass ... 126
5.4.6 Oaloacetate/P yruvate Node ... 128
5.4.6.1 Pyruvate Carboxylase and Malic Enzyme ... 128
5.4.6.2 I'hosphoenolpyruvate Carboxykinase ... ... ... 1311... 5.4.6.3 I'yruvate Dehydrogenase ... 132
5.4. 7 Lysine Synthesis Pathway ... 133
CHAPTER 6: EFFECTS OF GENE OVER-EXPRESSION AND CULTURE PHASE ON TRANSCRIPTIONAL PROFILE ... 137
6. 1 EXPERIMIENTAL DESIGN ... 137
6.2 BIOMASS ANI) LYSINE YIELDS ... 138
6.3 TRANSCRIPTIONAL. TRENDS ... 140
6.3. 1 Genes Up-Regulated With Pyruvate Carboxylase ... 140
6.3. 1.1 Pyruvate Carboxylase and Malic Enzyme ... ... 14()
6.3.1.2 ricarboxylic A cid Cycle ... 142
6.3.1.3 3iotin Synthesis Pathw ay ... 144
6.3.2 Genes Up-Regulated in Parental Strain ... 146
6.3.2.1 Iysine Synthesis Pathway ... 146
6.3.2.2 Other Carboxylases ... 147
CHAPTER 7: SIMULTANEOUS MEASUREMENT OF TRANSCRIPTIONAL AND FLUX PROFILES ... 150
7.1 OVERVIIW ... ... 150
7.2 FiuX ANALYSES BACKGROUND ... 152
7.3 EXPERIMF NTAAI DESIGN (IN COLLABORATION WITH DR. KOHEI MIYAOKU) ... 154
7.4 EXTRAC LLJIAR MEASUREMENTS ... ... 157
7.4.1 Biom ass M easurem ents ... ... 157
7. 4.2 Carbon Consumption Kinetics ... 158
7. 4. 3 Extracellular Amino Acid Measurements ... ...160
7.5 IENTIFICATION OF ISOTOPIC STEADY SATE ... 163
7.6. 1 Flux Observability and Variability ... 167
7.6.2 Flux Maps ... 170
7.7 COMPARISON OF FLUX AND TRANSCRIPTIONAL CHANGES ... 172
7.7.. Definition of Comparison Metric ... 172
7.7.2 Genes with Weak Correlation between Flux and Transcript Concentration ... 175
7.7.3 Embden-Meyerhof-Parnas Genes ... ... 178
7.7.4 Penlose Phosphate Pathway Genes ... 181
7.7.5 Tricarboxylic Acid Cycle and Glyoxylate Bypass Genes ... 182
7. 7.6 Pyruvate/Oxaloacetate Node Genes ... ...182
7. 7. 7 Lysine Biosynthesis G enes ... 184
7. 7. 8 Implications fbr Transcriptional Control... 187
CHAPTER 8: CONCLUSIONS AND RECOMMENDATIONS ... 189
8.1 SUMMARY ... 189 8.2 CONCI.USIONS ... 192 8.3 RCOMMI1NDATIONS ... 194 CHAPTER 9: REFERENCES ... 197 A PPEN D IX ... 214 A: ABBREVIATIONS ... 214
B: METABOLIC NETWORK ANALYSIS REACTIONS ... 218
List of Figures
Figure 3-1: Gel electrophoresis analysis of PCR reactions used to amplify DNA sequences for creating microarray printing stocks ... 55Figure 3-2: Example of DNA microarray spot printing pattern with replicates ... 60
Figure 3-3: Effect of culture growth phase on yield of RNA isolated from culture samples ... 63
Figure 3-4: Electrophoretic assay of isolated RNA quality ... 66
Figure 3-5: Effects of cDNA fluorescent label and purification on microarray signal qualities ... 72
Figure 3-6: Comparison of microarray signal normalization techniques ... 77
Figure 4-1: Reproducibility tests of DNA microarrays ... 84
Figure 4-2: Effects of spotted sequence size on DNA microarray results ... 91
Figure 4-3: Effects of spotted sequence origin species on DNA microarray results ... 93
Figure 5-1: Yields of biomass on carbon source ... 106
Figure 5-2: Yields of lysine on biomass ... 107
Figure 5-3: Glucose and lactate consumption by 21253 in the case of 100% glucose and 100% lactate carbon source . . ... ... ... 109
Figure 5-4: Typical growth and lysine production trends ... 110
Figure 5-5: Glucose and lactate consumption by 21253(pKD7) in the case of 100% glucose and 100% lactate carbon source . . ... 111
Figure 5-6: Glucose and lactate consumption by 21253 and 21253(pKD7) in the case of 40% lactate carbon source ... . ... 112
Figure 5-7: Total carbon source consumption by 21253 and 21253(pKD7) in the cases of 0%, 20%, and 40% lactate carbon source ... 113
Figure 5-8: Transcriptional trends relative to compositions of mixed carbon sources and pyc over-expression for glycolytic genes I ... 116
Figure 5-9: Transcriptional trends relative to compositions of mixed carbon sources and pyc over-expression for glycolytic genes II ... 118
Figure 5-10: Transcriptional trends relative to compositions of mixed carbon sources and pyc over-expression for glycolytic genes III ... ... 119
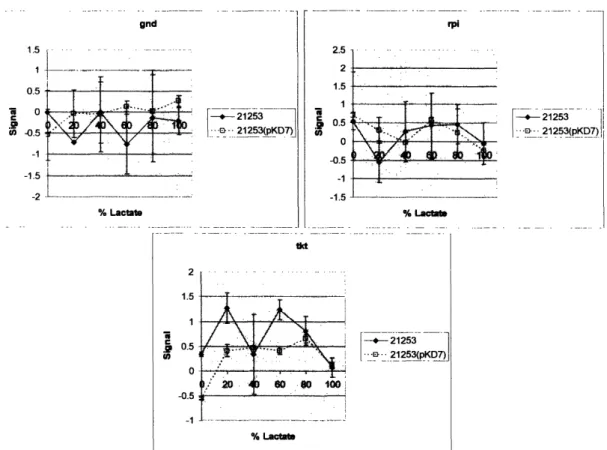
Figure 5-11: Transcriptional trends relative to compositions of mixed carbon sources and pyc over-expression for PPP genes ... 120
Figure 5-12: Transcriptional trends relative to compositions of mixed carbon sources and pyc over-expression for TCA cycle genes I ... 122
Figure 5-14: Transcriptional trends relative to compositions of mixed carbon sources and pyc over-expression for glyoxylate bypass genes ... 125
Figure 5-15: Transcriptional trends relative to compositions of mixed carbon sources and pyc over-expression for pyc and malE ... 128
Figure 5-16: Transcriptional trends relative to compositions of mixed carbon sources and
pyc over-expression for pck ... ... 130
Figure 5-17: Transcriptional trends relative to compositions of mixed carbon sources and pyc over-expression for pdh ... 131
Figure 5-18: Transcriptional trends relative to compositions of mixed carbon sources and pyc over-expression for lysine biosynthesis genes I ... 133
Figure 5-19: Transcriptional trends relative to compositions of mixed carbon sources and pyc over-expression for lysine biosynthesis genes II ... 135
Figure 5-20: Transcriptional trends relative to compositions of mixed carbon sources and pyc over-expression for lysine biosynthesis genes III ... ... 136
Figure 6-1: Growth and lysine production of 21253 and 21253(pKD7) grown on minimal medium containing 20 g/l lactate ... ... 138
Figure 6-2: Transcriptional trends relative to culture phase and pyc over-expression for pyc and malE ... 139
Figure 6-3: Transcriptional trends relative to culture phase and pyc over-expression for citA and sucA ... 141
Figure 6-4: Transcriptional trends relative to culture phase and pyc over-expression for bioA, bioD, and bioB ... ... ... ... ... 143
Figure 6-5: Transcriptional trends relative to culture phase and pyc over-expression for dapA, dapD, and lysE ... 145
Figure 6-5: Transcriptional trends relative to culture phase and pyc over-expression for dtsR , dtsR2, accC, and accD ... ... .. 147
Figure 7-1: Growth trends ... 156
Figure 7-2: Glucose and lactate consumption ... ... 158
Figure 7-3: Extracellular amino acid concentrations for 21253 cultures ... 60
Figure 7-5: Time-dependence of isotopic labeling distribution of proteinogenic amino acids fragments in a pseudo-steady-state culture ... 163
Figure 7-6: Flux maps ... 170
Figure 7-8: Comparison of all measured flux/mRNA pairs ... 1...74
Figure 7-9: Weak correlations between transcriptional and flux responses I...175
Figure 7-10: Weak correlations between transcriptional and flux responses II ... 176
Figure 7-11: Weak correlations between transcriptional and flux responses III ... 177
Figure 7-12: Correlations between transcriptional and flux responses for the Embden-Meyerhof-Pamas pathway ... 178
Figure 7-13: Correlations between transcriptional and flux responses for the pentose phosphate pathway ... 180
Figure 7-14: Correlations between transcriptional and flux responses for the tricarboxylic acid cycle and glyoxylate bypass pathway ... 181
Figure 7-15: Correlations between transcriptional and flux responses for the pyruvate/oxaloacetate node ... 182
Figure 7-16: Correlations between transcriptional and flux responses for the lysine biosynthesis pathway ... 184
Figure 7-17: Comparison of flux/mRNA pairs with good correlation to one another.... 186
List of Tables
Table 2-1: Glycolytic reactions of the Embden-Meyerhof-Pamas pathway and the pyruvate dehydrogenase coupling reaction ... ... 20Table 2-2: Gluconeogenic reactions of the Embden-Meyerhof-Pamas pathway ... 21
Table 2-3: Reactions of the pentose phosphate pathway ... ... ...22
Table 2-4: Reactions of the tricarboxylic acid cycle ... 23
Table 2-5: Reactions of the anaplerotic pathways ... ...26
Table 2-6: Reactions of the lysine biosynthetic pathways ... 29
Table 2-8: Reactions of biotin biosynthesis ... 31
Table 2-9: Reactions of the trehalose biosynthesis pathway ... 32
Table 2-10: Reactions of the acetate biosynthesis pathway ... 32
Table 2-1 1: Reaction of alanine biosynthesis ... 33
Table 2-12: Reaction of glutamine biosynthesis ... 33
Table 2-13: Reactions of the valine biosynthesis pathway ... 33
Table 2-14: Reactions of the phenylalanine biosynthesis pathway ... 34
Table 2-15: Effect of over-expression of pyruvate carboxylase on growth and lysine production by C. glutamicum strains ... 38
Table 3-1: Microarray spots composed of DNA sequences derived from Corynebacterium
glutamicum
...
..
... .. ... .. ... 45
45...
Table 3-2: Microarray spots composed of DNA sequences derived from Mycobacteriumtuberculosis
...
...
48
Table 3-3: Homologies between gene sequences from M. tuberculosis and C. glulamicum ... 51
Table 3-4: Microarray spots composed of full open reading frame DNA sequences derived from Corynebacterium glutamicum .... ... 53
Table 3-5: PCR amplification of sequences found on cDNA formed by reverse
transcription
... .. ... 65
Table 4-1: Composition and preparation of C. glutamicum minimal medium ... 81
Table 4-2: Relative transcriptional levels of EMP pathway genes for E12 grown on glucose and lactate ... ... ... ... 88
Table 4-3: Significant changes in gene transcript concentrations for E12 grown on glucose and lactate ... .. .. ... ... 95
Table 7-1: Effect of carbon source on growth and lysine production by C. glutamicum strains ... ... 156
Table 7-2: Pseudo-steady-state mass isotopomer fractions of proteinogenic amino acid fragm ents ... ... ... 165
Chapter 1: Introduction
1.1 Motivation
The majority of the worldwide supply of the amino acid L-lysine is produced through the batch fermentation of lysine-producing strains of the bacteria Corynebaceria
glutamicum. The original techniques used to develop these strains and improve the
usefulness of C glutamicum in industrial processes involved repeated cycles of mutagenesis and selection. Although these methodologies did bring about enhancements to the properties of the bacteria, many of the fundamental explanations for these adjustments remained unknown. Later, with the introduction of more advanced genetic engineering tools, specific genes and regulatory elements within the microbe could be added, deleted, or altered [Katsumata el al., 1984; Ozaki et al., 1984; and Santamaria et
al.. 1984]. Some of the targets of this genetic engineering have included the removal of
feedback inhibition from regulatory strategies used by the wild type strain [Morbach et
al., 1996], the deletion of enzymes for the purpose of redirecting the flow of metabolites
towards specific pathways [Marx et al., 2003], and the over-expression of enzymes in attempts to amplify desired fluxes [Jetten et al., 1995; de Graaf et al., 2001; and
Hartmann, 2003]. In this way investigators have attempted to gain an accurate sense of
the metabolic networks that operate in the cells, the flux of metabolites through the pathways that make up these networks, and the regulatory and energetic mechanisms that in part determine the quantities of these fluxes.
Additional means of solving these problems were developed in the 1990s in the form of metabolic flux analysis and metabolic control analysis. These were methods used for quantifying the flow of metabolites through pathways, as well as the changes that occur to fluxes in response to genetic and environmental perturbations [Stephanopoulos and Vallino, 1991]. To accurately measure the in vivo fluxes that are present under various circumstances, several studies employed increasingly sophisticated experimental procedures involving isotopic tracers and mass- and
nuclear-magnetic-resonance-spectroscopy [Vallino and Stephanopoulos, 1993; Sonntag et al., 1995; Park et al., 1997; Marx et al., 1997; and Petersen et al., 2000].
As the study of C. glutamicum has evolved, it has become increasingly apparent that it is necessary to examine strain improvement strategies in ways that recognize the network-wide ramifications of flux alterations. As the flow of material through the metabolic pathways of the organism is altered, the requirements for energy and reducing equivalents may be affected, and metabolites that fuel one set of pathways may be diverted to serve as substrates for another. This is particularly true for the compounds phosphoenolpyruvate, pyruvate, oxaloacetate, and malate, that are positioned at the intersections of pathways involving glycolysis, gluconeogenesis, the tricarboxylic acid
cycle, the glyoxylate bypass, and anabolic pathways leading to the formation of, for
example, amino acids such as lysine. Although several strains have been produced by
targeting the nodes involving these four metabolites for the purposes of up- or
down-regulating fluxes, the overall network behavior in these strains is poorly understood and represents a prime candidate for further study with newer tools.
It is essential to the success of metabolic engineering that these tools provide as much detailed information about the inner workings of cellular metabolism as is possible. For this reason, the quantitative assessment of the concentrations of intracellular and extracellular metabolites, the fluxes through the interconnected pathways, and the transcription of genes catalyzing and regulating individual reactions, is of vital importance. This allows for a better determination of both how the cells are currently operating, and where the areas of strain and process improvement with the most promise
lie.
Recent advances in the knowledge of the genomics of C. glutamicum, including the complete sequencing of the DNA of the species [Kalinowski et al., 2003], have provided an excellent opportunity to probe the workings of the cells on a more comprehensive genetic level. New genome-based approaches to the study of C. glutamicum should lead to an increasingly broad, yet more targeted, view of those aspects of the physiology of the organism that are most promising for strain improvement through metabolic engineering.
One of the key techniques to be applied for this purpose is that of DNA microarrays,
found within an organism. Through the data provided by DNA microarrays, valuable insight can be gained into the gene expression phenotypes associated with desired culture properties, as well as the transcriptional responses to various process demands or environmental stresses of interest.
1.2 Objectives
The general goal of the research work of this thesis was to create and apply partial genome DNA microarrays specific for Corynebacterium glutamicum to the study of various strains and fermentation conditions known to affect the production of lysine by the organism. In accomplishing this, the following specific objectives were set:
(1) Design, construct, and validate C. glutamicum DNA microarrays, determining which parameters of the protocols used to manufacture and apply the arrays significantly impact the robustness of the technique, and quantifying the reliability of the generated data.
(2) Apply the DNA microarrays to the measurement of gene expression phenotypes of different genetically engineered strains in response to internal and external perturbations.
(3) Evaluate the relationship between transcriptional profiles and flux profiles as descriptors of metabolic network function, describing the correlation between the two types of data sets.
1.3 Approach
To achieve the first of the objectives listed in the previous section, partial genome C.
glutamricum DNA microarrays were produced that were capable of measuring the mRNA
abundances of genes directly involved in the pathways converting glucose and lactate into lysine. These interconnected pathways included the reactions of glycolysis, gluconeogenesis, the pentose phosphate pathway, the tricarboxylic acid cycle, the
glyoxylate bypass, central carbon anaplerosis, and lysine and biotin biosynthesis. Also included in the arrays were spots used to test the effects of printing sequences of different length as well as sequences originating from different species. The protocols that were optimized to reduce nonspecific results and data variability included those of the polymerase chain reaction used to amplify the DNA sequences printed onto the array surface, the printing pattern and use of replicates among spots comprising the array, the isolation and purification of total RNA samples from cultures being studied, the creation of labeled cDNA through reverse transcription with fluorescent nucleotide analogs, the hybridization of the cDNA to the spots of the array surface, and the filtering and normalization associated with microarray data analysis. The microarrays were validated through the use of several types of replicates and the testing of the ability of arrays to accurately describe known biological behaviors.
To achieve the second of the objectives, the DNA microarrays were applied to the study of three different strains grown on six different media compositions and sampled during three different phases of the fermentation process. The tested C. glutamicum strains included one (ATCC 21253) that had been designed for lysine over-production through the deletion of genes providing access to competing amino acid synthesis pathways, and another (ATCC 21253[pKD7]) that had been given the trait of over-expressing the key anaplerotic enzyme pyruvate carboxylase. In this way, the arrays could be used to test the effects of over-expression of a single important gene on the behavior of the entire gene population associated with the metabolic network. Also studied were media that differed in their composition of glucose and lactate as available carbon sources. Lactate had been previously shown to influence the activities of some genes within the network and the productivity of lysine achieved by cell cultures.
To achieve the third objective, measurements of metabolite balances and mass isotopomer distribution patterns within cells that had been cultivated on isotopically labeled substrates were used in metabolic network analyses to calculate the flux rates associated with the reactions of the network. These flux values were then compared to transcript concentration values from DNA microarray assays of the same set of culture samples.
1.4 Description of Thesis
The remainder of the thesis is divided into eight additional chapters, covering background information, experimental results related to the approaches described in the previous section, conclusions, references, and supplemental material. Chapter 2 presents background material for both C. glutamicum and DNA microarrays. The reactions involved in the metabolic network, and some of the strategies that the cells use to regulate them, are discussed. Also, the previously published effects of various carbon source
substrates as well as the over-expression of the genes aspartokinase and pyruvate
carboxylase are described. Chapter 3 involves the work done in developing and manufacturing the DNA microarrays used in all experiments of the thesis work. The many procedures involved in the microarray printing and use are detailed, and the results of investigations into improving these procedures are presented. Chapter 4 deals with the experimental validation of the arrays through different types of replicates and by using the arrays to describe the transcriptional profiles of C. glutamicum cultivated with either
glucose or lactate as the only available carbon source. Glucose and lactate are again
studied in the experiment discussed in Chapter 5, along with the effects of pyruvate carboxylase over-expression. Here, several different media are used, with various mixtures of the two carbon source substrates. In the experiment of Chapter 6, RNA samples for DNA microarray analysis were taken at three different time points so that changes in gene transcription related to the phase of the culture could be revealed. Chapter 7 describes the work done in comparing the transcriptional profile and flux profile of a set of four different cultures. This allowed for a measure of the degree to which flux and mRNA levels correlate with one another, and a discussion of the ability of DNA microarray data to accurately reflect the behavior of metabolic flux. Chapter 8 gives a summary of the experimental results from the previous five chapters, lists the primary conclusions of the thesis, and suggests promising areas for future work. Chapter 9 is comprised of a list of references and appendices giving the abbreviations used throughout this text and the list of reactions used in the metabolic network analysis model of Chapter 7.
Chapter 2: Background
2.1 Corynebacterium glutamicum
2.1.1 Overview
Corynebacterium glutamicum is a gram-positive, non-sporulating, non-pathogenic
bacterium that was first noted for its ability to produce and excrete high concentrations of the amino acid, glutamate [Kinoshita et al., 1957]. Today the organism is being utilized industrially for the production of several amino acids, such as L-lysine which is used
predominantly as a feed additive. Lysine is typically added to agricultural feed stocks
such as barley, corn, and wheat that are naturally lacking in the nutritionally required amino acid. A consequence of supplementing these stocks with lysine is that manure generated from domesticated livestock contains significantly less nitrogen, and thus, has
a diminished environmental impact. The demand for lysine has increased by a factor of 20 worldwide since the 1980s to a level on the order of 106 tons per year, with the current rate of annual market growth near 10% [Hermann, 2003].
Along with Mycobacterium, Streptomyces, Nocardia, Propionibacterium, and
Arthrobacter, Corynebacteria belong to the actinomycetes family. Typical characteristics
of actinomycetes such as Corynebacteria include a relatively high GC content in their genomic DNA, morphology similar to a small and slightly curved rod, facultatively anaerobic to aerobic growth, cell walls composed primarily of arabinose and galactose, and the presence of mycolic acids [Collins and Cummings, 1986]. Corynebacteria have been isolated from a wide variety of sources including soil, water, and plant and animal material. and they can be cultivated without significant difficulty provided that the growth medium is supplemented with biotin [Abe et al., 1967]. In addition to its industrial significance, another factor that had made the organism a very attractive target for research was its apparent lesser metabolic complexity relative to that found in other species. Until only recently, it was believed that the cells contained relatively few
isozymes, simplifying the task of understanding and influencing the control strategies at work in regulating the operation of metabolic reactions. With the entire genome sequence of the species now available, however, and the assigning of functions to previously unknown open reading frames underway, this belief has received new scrutiny
[Kalinowski et al., 2003].
A large body of research has been compiled dealing with the species, resulting in improvements both to the genetic makeup of microbial strains and the operating protocols of fermentation processes used to grow the cultures and generate products such as lysine, glutamate, and threonine [Ikeda, 2003; Kimura, 2003; Pfefferle et al., 2003; and Debabov, 2003]. It has been found that the production of lysine is very dependent on the intracellular supplies of pyruvate, oxaloacetate, and NADPH reducing equivalents to fuel the reactions and pathways associated with biosynthesis of the amino acid. Classical strain improvement techniques, such as those of random mutagenesis and selection, have targeted these key areas and yielded producers of lysine that have been very successfully
integrated into commercial processes. Still, there is a great potential for further advances
using the newer techniques for improving strains that have arisen in the past decade with more advanced tools of genetic engineering, metabolic engineering, and bioinformatics.
This chapter will present background material concerning the reactions of several of the major reaction pathways that constitute the primary metabolism of the cells and are necessary for the support of both biomass and lysine production. As a great deal of the focus of the experiments of this thesis lies with the ways in which the cells control enzyme activity, especially at the level of gene transcription, special mention will be made of some other modes known to be utilized by the cells for enzyme regulation. The
effects of various carbon sources on the functioning of the metabolic network, as well as
the results of over-expressing a pair of key enzymes, will also be discussed, as they factor strongly in the studies and results detailed in later chapters. Finally, some additional background is given in the area of DNA microarrays and their applicability in probing the expression of genes whose protein products are responsible for catalyzing the reactions just described.
Table 2-1: Glycolytic reactions of the Embden-Meyerhof-Parnas pathway and the pyruvate dehydrogenase coupling reaction. Enzyme
catalysts are glucokinase (glk), phosphoglucoisomerase (gpi), phosphofructokinase (pfk), fructose bisphosphate aldolase (fba), triosephosphate isomerase (tpi), glyceraldehyde 3-phosphate dehydrogenase (gap), phosphoglycerate kinase (pgk), phosphoglycerate mutase (gpm), enolase (eno), pyruvate kinase (pyk), and pyruvate dehydrogenase (pdh).
Reaction Catalyst
Glucose - ATP - Glucose 6-phosphate + ADP glk
Glucose 6-phosphate - Fructose 6-phosphate gpi
Fructose 6-phosphate + ATP -- Fructose- ,6-bisphosphate +ADP pfk
Fructose-I ,6-bisphosphate - Glyceraldehyde 3-phosphate + Dihydroxyacetone phosphate fba
Dihydroxyacetone phosphate - Glyceraldehyde 3-phosphate tpi
Glyceraldehyde 3-phosphate + NAD -* Bisphosphoglycerate + NADH gap
Bisphosphoglycerate + ADP - 3-Phosphoglycerate + ATP pgk
3-Phosphogycerate + 2-Phosphoglycerate gpm
2-Phosphoglycerate ~ Phosphoenolpyruvate eno
Phosphoenolpyruvate + ADP -- Pyruvate + ATP pyk
Pyruvate + CoA +NADP -, Acetyl-CoA + CO2+ NADPH pdh
Overall: Glucose + 2 ADP + 2 Pi + 2 NAD + CoA + NADP -, 2 Acetyl-CoA + 2 ATP + 2 NADH + 2 CO2+ 2 NADPH + 2 H+ 2 H20
2.1.2 Biochemistry
2.1.2.1 Embden-Meyerhof-Parnas Pathway
The Embden-Meyerhof-Parnas pathway is composed of the series of reactions used by the cells to convert glucose to two molecules of pyruvate while producing energy in the
form of ATP. The steps of the pathway, as well as the enzymes used in their catalysis, are given in Table 2-1. It is also possible for the cells to operate a slightly modified form of
the pathway in the opposite direction, with glucose as the final product rather than the starting material. This gluconeogenic operation, the reactions of which are given in Table
2-2, is used when cells are grown on carbon sources other than glucose. Some
metabolites of the glycolytic pathway and the related pentose phosphate pathway described in section 2.1.2.2 are required for cellular growth and maintenance. Because glycolysis is inaccessible for substrates other than glucose, when glucose is unavailable the cells must use this pathway in its energetically unfavorable direction to produce these
Table 2-2: Gluconeogenic reactions of the Embden-Meyerhof-Parnas pathway. Enzyme catalysts are enolase (eno), phosphoglycerate mutase
(gpm), phosphoglycerate kinase (pgk), glyceraldehyde 3-phosphate dehydrogenase (gap), triosephosphate isomerase (tpi), fructose bisphosphate aldolase (fba), fructose bisphosphatase (fbpc), phosphoglucoisomerase (gpi), glucose phosphatase (gpc).
Reaction Catalyst
Phosphoenolpyruvate - 2-Phosphoglycerate eno
2-Phosphoglycerate - 3-Phosphoglycerate gpm
3-Phosphoglycerate + ATP - Bisphosphoglycerate + ADP pgk
Bisphosphoglycerate + NADH - Glyceraldehyde 3-phosphate +NAD gap
Glyceraldehyde 3-phosphate , Dihydroxyacetone phosphate tpi
Glyceraldehyde 3-phosphate + Dihydroxyacetone phosphate - Fructose-1,6-bisphosphate fba
Fructose-I ,6-bisphosphate + H20 -- Fructose 6-phosphate + Pi fbpc
Fructose 6-phosphate - Glucose 6-phosphate gpi
Glucose 6-phosphate + H20 - Glucose + Pi gpc
Overall: 2 Phosphoenolpyruvate + 2 ATP + 2 NADH + 2 H20 - Glucose + 2 ADP + 2 NAD + 2 Pi
intermediates. The three most energetically irreversible reactions of glycolysis-those that involve the actions of glucokinase, phosphofructokinase, and pyruvate kinase--do not function in gluconeogenesis, and the reverse reactions are catalyzed instead by glucose phosphatase, fructose bisphosphatase, and phosphoenolpyruvate carboxykinase, discussed in section 2.1.2.4.4.
As was stated in section 2.1.1, the concentration of pyruvate and its use as a substrate
for other reaction pathways are important in determining lysine productivities. For example, a mutant strain engineered to possess reduced activity of the pyruvate dehydrogenase complex was found to have a greatly enhanced productivity of lysine [Shiio et al., 1984]. The activity of pyruvate kinase is positively influenced by high concentrations of AMP and phosphoenolpyruvate and negatively influenced by ATP [Jetten et al., 1994]. This influence of ATP amounts to a type of feedback inhibition on glycolysis as a whole, as ATP is one of the major products of the functioning of the pathway.
Table 2-3: Reactions of the pentose phosphate pathway. Enzyme
catalysts are glucose 6-phosphate dehydrogenase (zwf), phosphogluconolactonase (pgl), phosphogluconate dehydrogenase (gnd), ribulose phosphate epimerase (rpe), ribulose phosphate isomerase (rpi),
transketolase (tkt), and transaldolase (tal).
Reaction Catalyst
Glucose 6-phosphate + NADP - 6-Phosphogluconolactone zwf
6-Phosphogluconolactone + H20 -- 6-Phosphogluconate + H+ pgl
6-Phosphogluconolactonate + NADP - Ribulose 5-phosphate + NADPH + CO2 gnd
Ribulose 5-phosphate , Xylulose 5-phosphate rpe
Ribulose 5-phosphate - Ribose 5-phosphate rpi
Xylulose 5-phosphate + Ribose 5-phosphate - Glyceraldehyde 3-phosphate + tkt Sedoheptulose 7-phosphate
Glyceraldehyde 3-phosphate + Sedoheptulose 7-phosphate * Erythrose 4-phosphate + tal Fructose 6-phosphate
Erythrose 4-phosphate + Xylulose 5-phosphate - Glyceraldehyde 4-phoshate + Fructose tkt
_6-.pph osphate
Overall: 3 Glucose 6-phosphate + 6 NADP + 3 H20 -- 2 Fructose 6-phosphate + Glyceraldehyde
3-phosphate + 6 NADPH + 6 H* + 3 CO2
2.1.2.2 Pentose Phosphate Pathway
The pentose phosphate pathway is used by the cells for two primary purposes-the generation of reducing equivalents in the form of NADPH necessary for reductive biosynthesis reactions, and the formation of ribose-5-phosphate, an essential component of nucleotides and nucleic acids. The pathway, the reactions of which are given in Table 2-3, has been shown by flux analysis to be one of the dominant pathways of cultures producing lysine from glucose carbon substrates [Marx et al., 1996]. Accordingly, it is the primary source of NADPH in C. glutamicum during growth and lysine production on glucose. Evidence for this includes the low fluxes that have been measured for the reactions of malic enzyme and isocitrate dehydrogenase, the other two enzymes of central carbon metabolism that catalyze the formation of the reducing equivalent [Park et al.,
1997].
Although the pentose phosphate pathway is dispensable for lysine formation, another work found that by deleting the phosphoglucoisomerase gene, thereby blocking the entry of glucose into glycolysis and redirecting flow into the pentose phosphate pathway, a subsequent increase in lysine yields was realized [Marx et al., 2003]. In general the
partitioning of central carbon flux between the pentose phosphate pathway and the glycolytic reactions of the Embden-Meyerhof-Parnas pathway has been shown to be very influential on the growth and product formation realized by Corynebacteria, with strains
of C. glutamicum designed for lysine production and C. ammoniagenes designed for
inosine production that have each been engineered for enhanced pentose phosphate pathway activity exhibiting greater productivities but reduced growth rates [Marx et al.,
2003 and Kamada et al., 2001]. The ability of the pathway to generate reducing
equivalents can help determine not only whether a culture is better suited for generating product or biomass, but also which product is the one most easily generated. For
example, lower pathway activity has been linked with glutamate production, while elevated pathway activity has been shown to promote lysine production [Sahm el al., 2000]. A likely explanation for this is that while glutamate synthesis requires one mol of NADPIH per mol product, lysine synthesis requires a much greater four mol of NADPH per mol product.
Glucose-6-phosphate dehydrogenase, which catalyzes the first step of the pentose phosphate pathway, is regulated at least in part through feedback inhibition by the primary product of the pathway, NADPH [Moritz et al., 2000]. The enzyme is also
inhibited by elevated oxaloacetate concentrations, and induced by increased glucose
[Sugimoto and Shiio, 1987]. Transketolase has been found to be inducible by the carbon sources acetate, fructose, and citrate [Sugimoto and Shiio, 1989].
2.1.2.3 Tricarboxylic Acid Cycle
The tricarboxylic acid cycle, described in Table 2-4, is used by the cells to oxidize
acetyl-CoA completely to CO2, while generating the reducing equivalents NADH and FADH2. Acetyl-CoA is derived from pyruvate of the Embden-Meyerhof-Pamas pathway
through the pyruvate dehydrogenase coupling reaction detailed in Table 2-1. Several intermediates of the tricarboxylic acid cycle also have significant roles as precursors for
biosynthetic pathways.
Table 2-4: Reactions of the tricarboxylic acid cycle. Enzyme catalysts
are citrate synthase (citA), aconitase (aco), isocitrate dehydrogenase (icd), a-ketoglutarate dehydrogenase (sucA), succinyl-coA synthase (sucC), succinate dehydrogenase (sdhABCD), fumarase (fum), and malate dehydrogenase (mdh).
Reaction Catalyst
Acetyl-CoA + Oxaloacetate -, Citrate + CoA citA
Citrate - Isocitrate aco
Isocitrate + NAD -- a-Ketoglutarate + NADH + CO2 icd
a-Ketoglutarate + NAD + CoA - Succinyl-CoA + NADH + CO2 sucA
Succinyl-CoA + GDP -- Succinate + GTP + CoA sucC
Succinate + FAD - Fumarate + FADH2 sdhABCD
Fumarate t- H,20 Malate fum
Malate + NAD - Oxaloacetate + NADH mdh
Overall: Acetyl-CoA + 3 NAD + FAD + GDP + H20 -- 3 NADH + FADH2+GTP + 2 CO2
that is encoded by the four genes sdhA, sdhB, sdhC, and sdhD [Kalinowski et al., 2003].
The activity of citrate synthase, located at the entry point of the tricarboxylic acid cycle, is inhibited by high concentrations of ATP, aconitate [Eikmanns et al., 1994], isocitrate
[Shiio e al., 1977], and glutamate [Shiio and Ujigawa, 1979]. Isocitrate dehydrogenase,
located at the branch point between the tricarboxylic acid cycle and the glyoxylate bypass pathway, has been demonstrated to be synergistically inhibited by glyoxylate and
oxaloacetate [Shiio and Ozaki, 1968].
The activity of a-ketoglutarate dehydrogenase, located at the metabolic branch point between the anabolic pathways of glutamate synthesis and the catabolic pathways of the TCA cycle, is lowered when cultures are grown under conditions of biotin limitation
[Shingu and Terui, 1971]. A similar repression of the dehydrogenase activity is seen in
response to the addition of penicillin or detergents to the culture medium [Kawahara et
al., 1997]. This is particularly significant for amino acid synthesis because of the three
reactions sharing a-ketoglutarate as a substrate or product. The activity of a-ketoglutarate
dehydrogenase was found to have a strong effect on the synthesis of glutamate by C.
glutamicum cultures [Shimizu e al., 2003]. It has been shown that by attenuating the
activity of this enzyme the flux through the downstream tricarboxylic acid cycle reactions
is decreased, and the production of glutamate is increased. The dehydrogenase is
if glutamate concentrations become excessive, the metabolism of the cells shifts to divert ct-ketoglutarate away from further glutamate synthesis and towards the remaining reactions of the tricarboxylic acid cycle.
2.1.2.4 Anaplerotic Pathways
2.1.1.4.1 Overview
Because all carbon skeletons that complete the tricarboxylic acid cycle are converted to carbon dioxide, there is no associated net production of any of the constituent metabolites. Since several of these metabolites are substrates for other anabolic pathways, such as those of amino acid synthesis, anaplerotic reactions must be used to replenish pools of, in particular, malate and oxaloacetate.
A pair of enzymes-phosphoenolpyruvate carboxylase and pyruvate carboxylase-is available to the cells for use in generating oxaloacetate from intermediates of the glycolytic pathway. Conversely, oxaloacetate may be converted to phosphoenolpyruvate or pyruvate through reactions catalyzed by phosphoenolpyruvate carboxykinase and oxaloacetate decarboxylase, respectively. Another route for synthesizing pyruvate from a tricarboxylic acid cycle intermediate is through the action of the NAD+-dependent or NADP+-dependent malic enzyme. Previous studies have shown that C. glutamicum is unique, in that it is possible for all three of these types of reactions to operate
simultaneously [Marx et al., 1997 and 1999].
Another pair of anaplerotic reactions converts isocitrate to malate in a two-step route, rather than the five-step route used by the tricarboxylic acid cycle. Details of these two reactions, as well as of the five reactions linking pyruvate and phosphoenolpyruvate to
Table 2-5: Reactions of the anaplerotic pathways. Enzyme catalysts are
pyruvate carboxylase (pyc), phosphoenolpyruvate carboxylase (ppc), oxaloacetate decarboxylase (oad), malic enzyme (malE), pyruvate carboxykinase (pck), isocitrate lyase (aceA), and malate synthase (aceB).
Reaction Catalyst
Pyruvate + CO2 + ATP -- Oxaloacetate + ADP + Pi pyc
Phosphoenolpyruvate + CO2+ H20 - Oxaloacetate + Pi ppc
Oxaloacetate -- Pyruvate + CO2 oad
Malate + NADP --, Pyruvate + CO2+ NADPH malE
Oxaloacetate - ATP -- Phosphoenolpyruvate + ADP + CO2 pck
Isocitrate -, Succinate + Glyoxylate aceA
Glyoxylate + Acetyl-CoA + H20 - Malate + CoA aceB
2.1.2.4.2 Pyruvate Carboxylase and PEP Carboxylase
Pyruvate carboxylase activity in C. glutamicum was first theorized by Tosaka et al in 1979, although 18 years passed before this activity was eventually confirmed [Peters-Wendisch et al., 1997] and the gene encoding the enzyme was identified [Koffas et al., 1998 and Peters-Wendisch et al., 1998]. Pyruvate carboxylase is the primary anaplerotic means for the cells to regenerate intracellular oxaloacetate pools that have been depleted through flow into either the TCA cycle or biosynthetic pathways such as that of lysine production [Park et al., 1997; Peters-Wendisch et al., 1997]. Measurements of the in vivo metabolic fluxes of pyruvate and PEP carboxylase present in C. glutamicum growing on glucose found the contribution of pyruvate carboxylase to oxaloacetate formation to be at least 3-fold greater than that of PEP carboxylase [Petersen et al., 2000]. This is despite in
vitro data suggesting that PEP carboxylase is the more active of the two enzymes
[Peters-Wendisch, 1993 and 1997]. The same study also concluded that catalysis by pyruvate carboxylase accounted for >80% of all anaplerotic activity within the network. Also, the deletion of PEP carboxylase was shown to inhibit growth or lysine production only under
conditions of biotin limitation [Peters-Wendisch et al., 1993 and Gubler et al., 1994]. Relative to pyruvate carboxylase, PEP carboxylase appears to play a less significant role in the metabolic flux within C. glutamicum, but the very different responses of the two enzymes to changes in concentrations of other intracellular compounds suggests that the cells uses them in tandem in implementing a regulatory strategy. For example,
pyruvate carboxylase is inhibited by elevated levels of ADP, AMP, and acetyl-CoA [Peters-Wendisch et al., 1997] while PEP carboxylase is conversely activated by the presence of acetyl-CoA as well as fructose-1,6-bisphosphate and inhibited by malate, succinate, a-ketoglutarate, aspartate [Mori and Shiio, 1985; Peters-Wendisch, 1996], and glutamate [Delaunay et al., 2004]. Also, there is evidence that PEP carboxylase is actually the dominant anaplerotic enzyme of the microorganism under conditions of oxygen depravation [Inui et al., 2004]. When both of these carboxylases are deleted from the genome of C. glutamicum, the organism is no longer capable of growth on glucose, indicating that together they are the only two required anaplerotic enzymes on this carbon
source [Eggeling and Sahm, 1999].
2.1.2.4.3 Malic Enzyme
Malic enzyme catalyzes the decarboxylation reaction linking malate of the tricarboxylic acid cycle with pyruvate of the Embden-Meyerhof-Pamas pathway. Activity of the enzyme, which shows slight inhibition by oxaloacetate and glutamate, is associated with the generation of the reducing equivalent NADPH [Gourdon et al., 2000].
2.1.2.4.4 Phosphoenolpyruvate Carboxykinase
Phosphoenolpyruvate carboxykinase catalyzes the conversion of oxaloacetate to phosphoenolpyruvate in a reaction that is assumed to not operate in the reverse direction
due to strong inhibition by ATP [Jetten and Sinskey, 1993]. An isotopomer analysis and
metabolite balancing study of C. glutamicum grown on glucose showed that phosphoenolpyruvate carboxykinase was the primary reverse anaplerotic component of the metabolic network, accounting for >90% of the flow of metabolites from the
tricarboxylic acid cycle to either phosphoenolpyruvate or pyruvate as measured in an in
vivo analysis of fluxes during growth on glucose [Petersen et al., 2000]. That work described the carboxykinase flux as one component of a futile cycle along with that of pyruvate kinase and pyruvate carboxylase when glucose is the medium carbon source,
consuming one molecule of ATP for each circuit from phosphoenolpyruvate to pyruvate, oxaloacetate, and then again to phosphoenolpyruvate. For growth on substrates that require gluconeogenesis, though, the activity of phosphoenolpyruvate carboxykinase has
been found to be essential [Reidel et al., 2001].
2.1.2.4.5 Glyoxylate Bypass
The two enzymes catalyzing the glyoxylate bypass pathway-isocitrate lyase and malate synthase-have been isolated and characterized, with the lyase being shown to be allosterically inhibited by several intermediates of the Embden-Meyerhof-Pamas pathway, such as 3-phosphoglycerate, 6-phosphogluconate, phosphoenolpyruvate, and fructose-1,6-bisphosphate [Reinscheid et al., 1994a and 1994b]. The genes for isocitrate lyase and malate synthesis are located in close proximity to one another in the C.
glutamicum genome, and they are believed to share a regulatory sequence, from which
they are controlled together at the transcriptional level [Wendish et al., 1997].
A novel gene, whose product, glxR, appears to have a regulatory role in controlling the
transcriptional promotion of malate synthesis, was recently discovered and characterized [Kim et al., 2004]. The sequence of this putative regulator was found to have a motif with strong resemblance to that of known cAMP-binding domains of other proteins. When lysine-producing cultures grown on acetate were exposed to both cAMP and glxR. the activities of both the isocitrate lyase and malate synthesis enzymes decreased by
approximately 90%. Although it is very common for cAMP to be involved in various
regulatory strategies functioning in many different species, in most cases the concentration of the molecule is associated with conditions in which a key substrate, such
as glucose, has limited availability. In contrast, in Corynebacteria, cAMP is found to be
at its highest concentration during exponential growth on glucose, when the carbon source is present in abundance [Lynch et al., 1975; Peters et al., 1991; and Kim et al., 2004]. This also coincides with the condition for which C. glutamicum has been shown to have its lowest glyoxylate bypass activity [Sonntag et al., 1995].
Table 2-6: Reactions of the lysine biosynthetic pathways. Enzyme
catalysts are glutamate dehydrogenase (gdh), aspartate aminotransferase (aat), aspartokinase (ask), aspartate semialdehyde dehydrogenase (asd), dihydropicolinate synthase (dapA), dihydropicolinate reductase (dapB), tetrahydropicolinate succinylase (dapD), succinyldiaminopimelate aminotransferase (dapC), diaminopimelate epimerase (dapF), diaminopimelate dehydrogenase (ddh), and diaminopimelate decarboxylase (lysA).
Reaction Catalyst
a-Ketoglutarate + Ammonia + NADPH - Glutamate + NADP + H20 gdh
Glutamate+ Oxaloacetate - Aspartate + a-Ketoglutarate aat
Aspartate + ATP - Aspartyl phosphate ask
Aspartyl phosphate + NADPH - Aspartate semialdehyde + Pi + NADP asd
Aspartate semialdehyde + Pyruvate --, Dihydropicolinate + 2 H20 dapA
Dihydropicolinate + NADPH + H - Tetrahydropicolinate + NADP dapB
Tetrahydropicolinate + Succinyl-CoA + H20 -, Succinyl-amino-oxopimelate +CoA dapD
Succinyl-amino-oxopimelate + Glutamate -- Succinyl-diaminopimelate + a-Ketoglutarate dapC
Diaminopimelate - Meso-diaminopimelate dapF
Tetrahydropicolinate + Ammonia + NADPH + H' - Meso-diaminopimelate + NADP + H20 ddh
Meso-diaminopimelate --- Lysine + CO2 lysA Overall for succinylation route: Oxaloacetate + Pyruvate + Glutamate +Ammonia + ATP +
3 NADPH + NAD --, Lysine + Succinate + ADP + 3 NADP + NADH + Pi + 2 CO2+ H20
Overall for dehydrogenation route: Oxaloacetate + Pyruvate + 2 Ammonia + ATP + 4 NADPH + H' - Lysine + ADP + 4 NADP + + Pi + CO2+ 4 H20
2.1.2.5 Lysine Synthesis Pathway
C. glutamicum utilizes a split pathway in the synthesis of lysine, by allowing the
tetrahydropicolinate lysine precursor to be converted to diaminopimelate by either a one-step dehydrogenation reaction catalyzed by meso-diaminopimelate dehydrogenase (ddh), or by a four-step succinylation branch catalyzed by tetrahydrodipicolinate succinylase (dapD), succinyldiaminopimelate aminotransferase (dapC), succinyldiaminopimelate desuccinylase (dapD), and diaminopimelate epimerase (dapF) [Schrumph et al., 1991]. The reactions involved in each of these routes, as well as those for steps upstream and downstream of the split portion of the pathway, are described in detail in Table 2-6. Flux analyses of the branched pathway found that both options are utilized by the cells in parallel with individual contributions typically ranging from 30-70% of the combined flux [Sonntag et al., 1993]. Cultivation time and the availability of ammonium ions required by the ammonium-incorporating dehydrogenase were shown to be two of the
greatest factors in influencing which of the two branches is the preferred route [Wehrmann et al., 1998]. Of the two pathways, the dehydrogenase route is the less costly from an energetics viewpoint and is the preferred route when ammonium is present in excess. The existence of the alternative succinylation route greatly increases the metabolic flexibility that the organism can use in adapting to different growth
environments, and helps ensure that not only lysine but also the lysine precursor
diaminopimelate, itself an important component of cell wall synthesis, are generated in sufficient quantities under a wide range of conditions.
Many of the genes for enzymes catalyzing the reactions of the lysine biosynthetic pathway are present in clusters within the C glutamicum genome, increasing the probability that their expression levels are regulated simultaneously by the cells. Examples of these clusters include one containing the genes for aspartokinase and aspartate semialdehyde dehydrogenase [Cremer et al., 1991 and Follettie el al., 1993] and another containing the genes for dihydropicolinate synthase and reductase [Patek et al.,
1997].
The results of several experiments have led to the conclusion that three of the enzymes
in the lysine biosynthetic pathway-aspartokinase, dihydropicolinate synthase, and the lysine exporter-are responsible for catalyzing steps likely to be rate limiting [Cremer et al., 1991; Jetten et al., 1995; and Malumbres and Martin, 1996]. In particular, aspartokinase is one of the most heavily regulated enzymes catalyzing the anabolic pathway, displaying susceptibility to feedback inhibition by the downstream products
lysine and threonine [Shiio and Miyajima, 1969 and Kalinowski et al., 1991]. A key
strategy implemented in the course of improving strains for lysine over-production was the replacement of the native aspartokinase enzyme with a mutated form selected for its resistance to this feedback inhibition [Shiio et al., 1970; Tosaka et al., 1978; and Follettie
et al., 1993]. This selection was based on resistance to S-(2-aminoethyl) L-cysteine, a
Table 2-7: Reaction of lactate consumption. Enzyme catalyst is lactate
dehydrogenase (ldh).
Reaction Catalyst
Lactate + NAD - Pyruvate + NADH + H Idh
Table 2-8: Reactions of biotin biosynthesis. Enzyme catalysts are
7,8-diaminopelargonic acid aminotransferase (bioA), dethiobiotin synthase (bioD), and biotin synthase (bioB).
Reaction Catalyst
Adenosylmethionine 8-Amino-7-oxononanoate - Adenosyl-4-methylthio-2- bioA oxobutanoate + 7,8-Diaminononanoate
7,8-Diaminononanoate + ATP + CO2 - Dethiobiotin + ADP + Pi bioD
Dethiobiotin + Sulfur - Biotin bioB
2.1.2.6 Other Pathways
The previous several sections describe the reactions directly involved in the pathways
used by the cells to convert glucose substrate to biomass and lysine products. There are other reactions and pathways that are also significant to the work done in this thesis, and they are described in this section. The first of these is the dehydrogenation of lactate in a
NAD-dependent reaction that allows lactate substrate to enter central carbon metabolism
at the point of pyruvate. The reaction is shown in Table 2-7.
Biotin is a cofactor required by carboxylation enzymes, such as the pyruvate
carboxylase and phosphoenolpyruvate carboxylase described in section 2.1.2.4.2. A
portion of the pathway for synthesizing biotin is given in Table 2-8. The pathway is
incomplete because C. glutamicum is incapable of generating the
8-amino-7-oxononanoate that is a substrate for the first reaction listed. This is why the organism
requires biotin supplementation in its growth medium, as was described in section 2.1 .1.
Table 2-9 lists the reactions used by the microorganism to produce trehalose, a disaccharide that is typically used by cells as a glucose storage compound. In fermentations operated to produce glutamate and lysine, however, trehalose has been
Table 2-9: Reactions of the trehalose biosynthesis pathway. Enzyme
catalysts are phosphoglycerate mutase (gpm), UDP glucose pyrophosphorylase (galU), trehalose phosphate synthase (otsA), and trehalose phosphatase (otsB).
Reaction Catalyst
Glucose 6-phosphate - Glucose -phosphate gpm
Glucose -phosphate + UTP - UDP-glucose + PPi galU
Glucose 6-phosphate + UDP-glucose - Trehalose 6-phosphate + UDP otsA
Trehalose 6-phosphate + H20 - Trehalose + Pi otsB
Overall: 2 Glucose 6-phosphate + UTP + H20 - Trehalose + UDP + Pi + PPj
Table 2-10: Reactions of the acetate biosynthesis pathway. Enzyme
catalysts are phosphate acetyltransferase (pta) and acetate kinase (ack).
Reaction Catalyst
Acetyl-CoA + Pi - Acetyl phosphate + CoA pta
_Acetyl phosphate + ADP - Acetate + ATP ack
Overall: Acetyl-CoA + ADP + Pi - Acetate + CoA + ATP
Measurements of trehalose, as well as of acetate, alanine, glutamine, valine, and
phenylalanine which are all described below, were important for this work in the metabolite balancing of the flux analysis experiment of Chapter 7.
Acetate production in C. glutamicum was determined to take place through the actions of a phosphate acetyltransferase and an acetate kinase, as is shown in Table 2-10 [Shiio et al., 1969].
The route of biosynthesis of alanine in the cells is given in Table 2-11. Of the potential
routes of alanine dehydrogenation, aspartate decarboxylation, and pyruvate
transamination. the latter was found to be in effect in C. glutamicum for generating the
amino acid [Tosaka et al., 1978].
Glutamine is synthesized in the energy-dependent reaction of Table 2-12 through the addition of ammonia to glutamate.
A four-step process, shown in Table 2-13, is used to generate valine from pyruvate and