HAL Id: inserm-00496624
https://www.hal.inserm.fr/inserm-00496624
Submitted on 3 Oct 2010HAL is a multi-disciplinary open access archive for the deposit and dissemination of sci-entific research documents, whether they are pub-lished or not. The documents may come from teaching and research institutions in France or abroad, or from public or private research centers.
L’archive ouverte pluridisciplinaire HAL, est destinée au dépôt et à la diffusion de documents scientifiques de niveau recherche, publiés ou non, émanant des établissements d’enseignement et de recherche français ou étrangers, des laboratoires publics ou privés.
Raman spectroscopy: a novel experimental approach to
evaluating renal tumours.
Karim Bensalah, Julien Fleureau, Denis Rolland, Olivier Lavastre, Nathalie
Rioux-Leclercq, François Guillé, Jean-Jacques Patard, Lotfi Senhadji, Renaud
de Crevoisier
To cite this version:
Karim Bensalah, Julien Fleureau, Denis Rolland, Olivier Lavastre, Nathalie Rioux-Leclercq, et al.. Raman spectroscopy: a novel experimental approach to evaluating renal tumours.. European Urology, Elsevier, 2010, 58 (4), pp.602-8. �10.1016/j.eururo.2010.06.002�. �inserm-00496624�
Raman Spectroscopy: A Novel Experimental Approach to Evaluating Renal
Tumours
Karim Bensalah a,b,c,*, Julien Fleureau a,b, Denis Rolland d, Olivier Lavastre d, Nathalie Rioux-Leclercq e, François Guillé c, Jean-Jacques Patard b,c, Lotfi Senhadji
b,c, Renaud de Crevoisier b,c,f
a Inserm, U642, Rennes, F-35000, France
b Université de Rennes1, LTSI, Rennes, F-35000, France
c Department of Urology, CHU Rennes, Rennes, F-35000, France
d Université de Rennes1, Institute of Chemistry, UMR CNRS 6226, ProCaDec,
Rennes, F-35000, France
e Department of Pathology, CHU Rennes, Rennes, F-35000, France
f Department of Radiotherapy, CRLCC Eugène Marquis, Rennes, F-35000, France
Key words: Raman spectroscopy, renal cell carcinoma, diagnosis, spectrum
analysis
Corresponding author:
Karim Bensalah
Department of urology
CHU Rennes, Hopital Pontchaillou 2, rue Henri Le Guillou
35000 Rennes France
33 1 2 99 28 42 67 Fax:
Abstract
Background: New optical techniques of spectroscopy have shown promising results
in the evaluation of solid tumours.
Objective: To evaluate the potential of Raman spectroscopy (RS) to assess renal
tumours at surgery.
Design, setting, and participants: Over a 5 months period, Raman optical spectra
were prospectively acquired on surgical renal specimen removed due to suspicion of cancer.
Measurements: Raman measures were normalized to ensure comparison between
spectra. A lower resolution signal was computed using a wavelet decomposition procedure to diminish the size of the signal and exploit the complete spectrum. A support vector machine (SVM) with a linear kernel and a sequential minimal optimization solver was applied. A leave-one-out cross validation technique was used to train and test the SVM.
Results and limitations: There were 36 patients with 34 malignant (27 clear cell, 6
papillary and one chromophobe) and two benign (one oncocytoma and one metanephric cyst) tumours. A total of 241 analyzable Raman spectra were obtained. The SVM was able to classify tumoural and normal tissue with an accuracy of 84% (sensitivity 82%, specificity 87%). High grade and low grade tumours were differentiated with a precision of 82% (sensitivity 84%, specificity 80%). Histologic subtype could be categorized with an accuracy of 93% (sensitivity 96%, specificity 87%). SVM could not be applied to classify benign and malignant tumours because of the restricted number of benign spectra.
Conclusions: RS can accurately differentiate normal and tumoural renal tissue, low
grade and high grade renal tumours, as well as histologic subtype of RCC. Larger prospective studies are needed to confirm these preliminary data.
Introduction
The natural course of cancer is hardly predictable. This is particularly true for renal cell carcinoma (RCC) where 40% of affected individuals will die from their disease [1]. A better understanding of molecular pathways has led to the development of multiple targeted therapies with significant clinical benefits [2]. However, response to treatment is only seen in a minority of patients and side effects are frequent and cumbersome. In an effort to better appraise the evolution of RCC in a specific patient, a prognostic role has been suggested for various biomarkers, mostly genes and proteins [3]. Some of these biomarkers have been integrated to predictive models but since they hold many imperfections, they are not used in clinical practice. There is therefore a clear need for new predictive tools and/or different conceptual approaches to address RCC, and more generally cancer [4, 5].
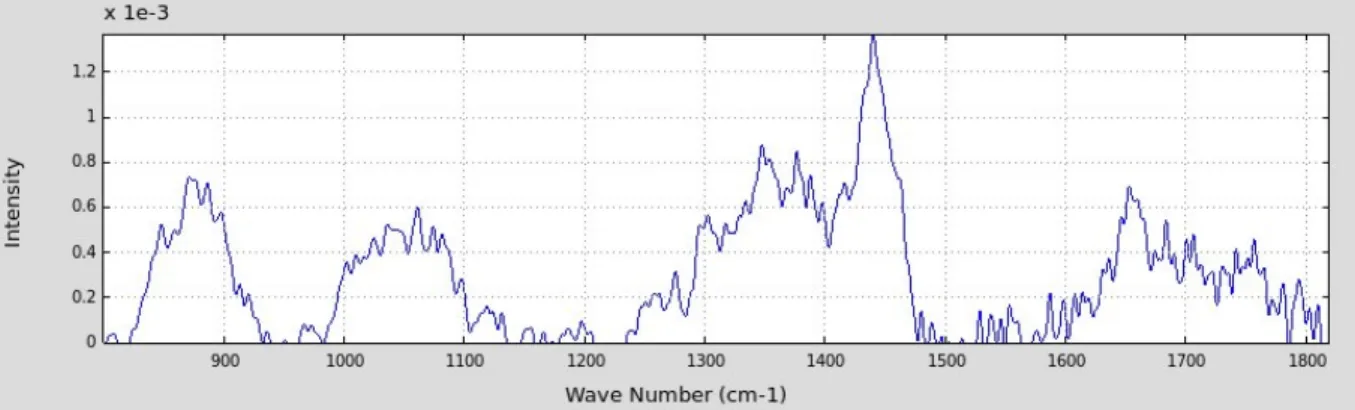
Raman spectroscopy (RS) is based on molecular inelastic scattering of light [6]: when photons interact with a molecule, the transmission of their energy raises the molecule’s vibrational state. When the molecule returns to its background level, a photon is emitted at a different wavelength from the incident light. This change in wavelength is known as the Raman effect or Raman shift. All Raman shifts generated by the interaction of light with tissue provide a Raman spectrum (figure 1) that is directly related to the molecular composition of the tissue. Promising results have been reported with RS for in vitro and ex vivo assessment of various solid tumours [7-9]. In this study, we investigated the potential of RS to evaluate normal and tumoural renal tissue on surgically removed specimen.
Materials and methods
Instrumentation
A Raman spectroscopic system was used to acquire immediate Raman spectra from kidney specimen removed at surgery. The system comprised three components: 1) a high-powered near-infrared laser (Invictus NIR laser 785 nm, 500 mW, Kaiser Optical Systems, Ann Arbor, Michigan, USA) that minimizes fluorescence, 2) a fiber optics MR probe with a 10x non-contact objective, and 3) a RXN1 Raman analyzer (Kaiser Optical Systems, Ann Arbor, Michigan, USA) including a CCD Camera (Chip 1024x128 EEV MMP type, pixel size 26 µm) to receive reflected and scattered light.
Specimens
After approval by our institutional review board, we prospectively collected Raman spectra in consecutive kidney specimen removed due to suspicion of cancer. Between June and November 2009, 43 operations were performed, including 31 radical nephrectomies and 12 partial nephrectomies. The surgery was completed through an open access in 22 patients and laparoscopically in 21 patients. Seven patients were excluded from the study based on final histology results: four with urothelial carcinoma, one with liposarcoma, one with a multicystic non malignant lesion and one with inflammatory cyst. Immediately after extraction, the specimen were stored on ice and transferred to the pathology department. Raman spectra were acquired within 15 minutes after extraction.
Raman measurements
After longitudinal section of the specimen, Raman spectra were acquired by placing the MR probe at several standardized locations on the surface and on the section of normal and tumoural tissue. No pre-treatment was performed prior to spectral acquisition. Four Raman measures were made, including 2 inside the tumour section and 2 on the normal parenchyma section. Two spectra were recorded on each spot. The laser beam was set at a power of 50 mW and, and focused on a 500 µm spot on the surface of the sample. The acquisition period for Raman spectra was 30s, with a 4 cm-1 spectral resolution over a 150-3400 cm-1 Raman shift range. A wavelength of 785 nm was chosen to avoid background fluorescence.
Statistical analysis
The Raman spectrum is a plot of the intensity of the scattered light as a function of the difference of energy between incident and scattered light, measured in wave numbers (cm-1). Every peak in the spectrum corresponds to a specific
molecular vibration. In this study, each Raman spectrum comprised 11769 points with Raman shift wave numbers ranging from 100 to 3444 cm-1.
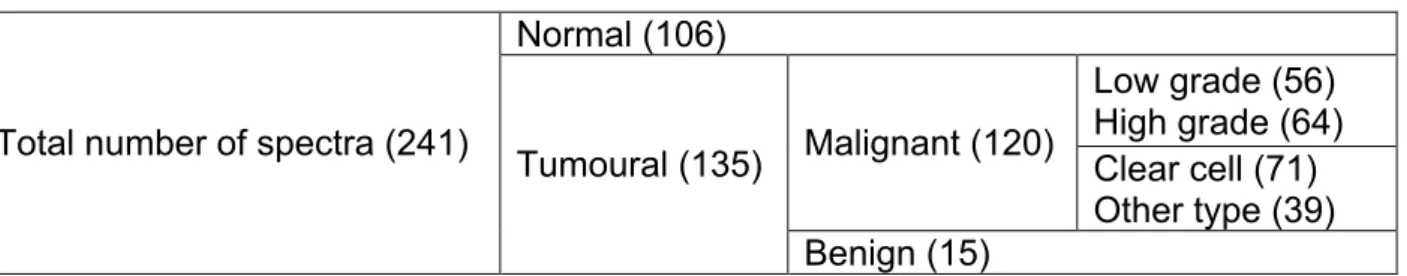
To ensure all spectra were comparable, a normalization step was performed by dividing every spectral point by the area of the total intensity of the spectrum [10]. After outliers were removed, we obtained a total of 241 spectra (106 normal, 135 tumour, Table 1).
The autofluorescence background can be removed to visualize the only Raman spectrum. However, in our study the autofluorescence was not removed so the whole signal content (including autofluorescence and Raman scattering) could remain intact for further steps of the analysis. This unusual approach offers two
advantages: 1) it avoids any approximation error related to background removal and 2) a potentially significant background information is preserved and incorporated to further steps of the analysis. All normalized spectra (normal parenchyma and tumour) are shown in Figure 2.
Because of the huge size of the normalized signal (11769 points), a lower resolution signal was computed using a wavelet decomposition procedure. A discrete wavelet transformation (Daubechies three mirrors conjugate filter) [11] was applied to each spectrum, and the 6th level approximation (188 points) was retained to replace the original spectrum. This procedure removes high frequency components (particularly noise) in order to study the entire spectrum instead of restricted areas.
Our objective was to generate a Raman classification of : 1) normal and tumoural renal tissue, 2) benign and malignant renal tumours, 3) high grade (Fuhrman 3-4) and low grade (Fuhrman 1-2) tumours and 4) clear cell, papillary and chromophobe tumours. For that purpose, a support vector machine (SVM) with a linear kernel and a sequential minimal optimization solver was applied to available Raman spectra [12]. A leave-one-out cross validation technique was used to train and test the SVM. For every classification, all spectra but one were used to train the SVM and the remaining spectrum was set aside for final testing. The process was repeated with alternation of the testing spectrum. At the end of the procedure, a cross-validation score that represents the ability of a single Raman spectrum to classify the assessed biological sample was obtained.
Results
Clinical and pathological characteristics of the population are depicted in table 2.
Histology was malignant in 34 cases (27 clear cell carcinomas, six papillary tumours, and one chromophobe carcinoma), and benign in two cases (one oncocytoma and one metanephric adenoma).
Figure 2 displays processed tumoural and normal parenchyma Raman spectra. The SVM could identify normal and tumoural optical signals with an accuracy of 84% (sensitivity and specificity of 82 and 87% respectively).
Low grade (Furhman 1-2) and high grade (Furhman 3-4) tumours could be recognized with an accuracy of 82% (sensibility and specificity of 84 and 80%, respectively, Figure 3).
Histologic subtype (classified as clear cell carcinoma vs. papillary or chromophobe) was distinguished with an accuracy of 93% (sensibility and specificity of 96 and 87%, respectively, Figure 4).
The SVM could not be applied to classify benign and malignant tumours because the number of benign spectra was too small to train the model.
Discussion
Despite all the progresses made over the last decades, cancer remains a leading cause of death and its natural course is difficult to predict in a single patient. The disparity in the evolution of tumours with identical clinical and pathological presentations is certainly related to molecular differences that we are still unable to detect. This is remarkably true about RCC. It is the most lethal urological tumour and its evolution can be quite unpredictable with 30 to 40% of patients who will develop metastases during follow-up although they were classified M0 at the time of surgery.
New targeted therapies can impact tumour growth in up to 40% of metastatic RCC patients [2]. However, these drugs have a high toxicity, high cost and there is no tool that can predict response to treatment. Oncological research has focused on molecular biomarkers that could determine the prognosis or foretell response to treatment. Concerning RCC, a prognostic role has been suggested for numerous markers, including adhesion molecules (cadherin-6, e-cadherin, ICAM-1), receptors of growth factors (VEGFR-3, TGFBR-2), hypoxia inducible molecules (CA9, VEGF, IGF-1) or proliferation markers (Ki-67, PCNA) [3]. Still, many limitations restrict their use in clinical practice. For this reason, many experts in cancer research expect conceptual changes in the approach of cancer.
RS is an optical technique based on inelastic scattering (the so-called Raman effect) of monochromatic light (usually emitted by a laser in the visible or near infrared range) interacting with a biological sample. When light is targeted on tissue molecules, a small fraction of the scattered light undergoes shifts in its frequency. The amplitude of these Raman shifts corresponds to vibrations of intramolecular bonds. Every molecule has a unique vibrational energy state to which corresponds a specific Raman shift. As such, the Raman spectrum is a direct function of the molecular composition of the tissue and functional and structural changes may be evidenced by a change in Raman optical signature. Promising results have been reported with RS in the evaluation of urological tumours. RS has been shown to identify in vitro malignant changes in the urothelium [8] and prostate biopsy cores [9]. In another study, RS could recognize with high accuracy benign prostatic tissue (benign prostatic hyperplasia and prostatitis) from prostate cancer with an accuracy of 86% [13].
In the current study, we showed that RS could accurately differentiate normal and tumoural renal tissue, high grade and low grade RCC, as well as histologic subtypes of RCC. We obtained sensitivity rates ranging from 82 to 95% and specificity rates ranging from 80 to 87%. We believe these results give reasons to expect that RS could become a valuable diagnostic method to evaluate RCC. RS has many advantages: 1) it gives immediate results, 2) it is an objective method using robust algorithms that does not need human interpretation 3) it is non-invasive and 4) It is non toxic and can easily be transferred to human care.
To our knowledge, our study is the first one that specifically reports the use of RS to evaluate kidney cancer. Several publications have recently presented other techniques of optical spectroscopy to assess renal tumours. Parekh et al used a combination of reflective and fluorescent spectroscopy, and noted that optical characteristics could differentiate benign and malignant renal tissues [14]. The team from the University of Texas Southwestern University successively showed that optical reflectance spectroscopy could accurately discriminate normal and tumoural renal tissue [15] and benign and malignant renal tumours at surgery [16]. Raman spectroscopy has the advantage that its spectrum contains very rich information that might be more adequate to identify molecular changes in a sample compared to reflectance or fluorescence spectroscopy. RS provides important biochemical information because each molecule has its own pattern of vibration that can serve as a “Raman biomarker”. Furthermore, these vibrations are usually sensitive to the structure of the molecular environment and can therefore reflect structural changes besides biochemical changes.
RS can be pictured as an “optical biopsy tool” that has several possible applications in clinical urology. Given that RS can accurately distinguish normal and
cancerous renal tissue, it could be used to assess the margin status of tumour resection in real time during partial nephrectomy as it has already been demonstrated with reflectance spectroscopy [15]. It could represent an alternative to frozen section analysis that lacks specificity [17]. RS could also help the pathologist improve diagnostic accuracy. It is well known for example that the establishment of Furhman grade is affected by intra and interobserver variability [18]. Finally, RS could be viewed as an optical biomarker of RCC. For that purpose, larger studies need to be undertaken to correlate optical profiles to the outcome of RCC.
Our study has several limitations. First, it was done on ex-vivo specimen, and the impact of blood flow might have been underestimated. Haemoglobin is the preponderant chromophore and has a high ability to absorb light. For this reason, there is a need for in vivo studies. For that purpose, the equipment must be refined to be used in the sterile environment of the operating room. Second, our population of benign lesions was too limited to demonstrate any difference between benign and malignant renal tumours. We believe that with more benign cases, we would have been able to recognize malignant from benign because: 1) such differences have been demonstrated for solid urological tumours assessed by RS [8, 13], 2) benign and malignant renal tumours can be differentiated by the means of optical reflectance spectroscopy [16], and 3) the fact that tumour grade is accurately classified suggests that ultrastructural differences related to the malignant state of a cell or a tissue can be detected by RS.
Conclusion
In conclusion, our preliminary study showed that RS could accurately differentiate RCC from normal renal tissue. RS can also be used to classify RCC as
low or high grade and differentiate clear cell type versus papillary or chromophobe tumours. Therefore, RS could have the potential to be used as a diagnostic tool to assist the pathologist, and as a surgical assistance during partial nephrectomy. These promising results need to be confirmed by larger in-vivo studies.
References
1. Chow WH, Devesa SS: Contemporary epidemiology of renal cell cancer.
Cancer J 14:288-301, 2008
2. Ravaud A, Wallerand H, Culine S, et al: Update on the medical treatment of
metastatic renal cell carcinoma. Eur Urol 54:315-325, 2008
3. Lam JS, Leppert JT, Figlin RA, et al: Role of molecular markers in the diagnosis and therapy of renal cell carcinoma. Urology 66:1-9, 2005
4. Gupta GP, Massague J: Cancer metastasis: building a framework. Cell
127:679-695, 2006
5. Hanahan D, Weinberg RA: The hallmarks of cancer. Cell 100:57-70, 2000
6. Stone N, Hart Prieto MC, Crow P, et al: The use of Raman spectroscopy to provide an estimation of the gross biochemistry associated with urological pathologies. Analytical and bioanalytical chemistry 387:1657-1668, 2007
7. Lovat L, Bown S: Elastic scattering spectroscopy for detection of dysplasia in Barrett's esophagus. Gastrointestinal endoscopy clinics of North America 14:507-517, ix, 2004
8. Crow P, Uff JS, Farmer JA, et al: The use of Raman spectroscopy to identify
and characterize transitional cell carcinoma in vitro. BJU international 93:1232-1236, 2004
9. Crow P, Stone N, Kendall CA, et al: The use of Raman spectroscopy to identify and grade prostatic adenocarcinoma in vitro. British journal of cancer 89:106-108, 2003
10. Bum Kim S, Temiyasathit C, Bensalah K, et al: An effective classification procedure for diagnosis of prostate cancer in near infrare spectra. Expert Systems with Applications 37:3863-3869, 2010
11. Mallat S: A Wavelet Tour of Signal Processing, Academic press, 2008
12. Platt J: Fast training of support vector machines using sequential minimal optimization in advances of in Kernel methods: support vector learning. MIT press:185-208, 1999
13. Crow P, Molckovsky A, Stone N, et al: Assessment of fiberoptic near-infrared raman spectroscopy for diagnosis of bladder and prostate cancer. Urology 65:1126-1130, 2005
14. Parekh DJ, Lin WC, Herrell SD: Optical spectroscopy characteristics can differentiate benign and malignant renal tissues: a potentially useful modality. The Journal of urology 174:1754-1758, 2005
15. Bensalah K, Tuncel A, Peshwani D, et al: Optical reflectance spectroscopy to differentiate renal tumor from normal parenchyma. The Journal of urology 179:2010-2013, 2008
16. Bensalah K, Peswani D, Tuncel A, et al: Optical reflectance spectroscopy to differentiate benign from malignant renal tumors at surgery. Urology 73:178-181, 2009
17. Bensalah K, Pantuck AJ, Rioux-Leclercq N, et al: Positive surgical margin appears to have negligible impact on survival of renal cell carcinomas treated by nephron-sparing surgery. Eur Urol 57:466-471
18. Lang H, Lindner V, de Fromont M, et al: Multicenter determination of optimal interobserver agreement using the Fuhrman grading system for renal cell carcinoma: Assessment of 241 patients with > 15-year follow-up. Cancer 103:625-629, 2005
Table 1. Distribution of Raman spectra. Normal (106) Low grade (56) High grade (64) Malignant (120) Clear cell (71) Other type (39) Total number of spectra (241)
Tumoural (135)
Benign (15)
Table 2. Patient and tumours characteristics.
Number of specimen 36
Mean patient age (years) 59 (35-82)
Mean tumour size (cm) 6 (2-12)
Type of surgery:
Open radical nephrectomy
Laparoscopic radical nephrectomy Open partial nephrectomy
Laparoscopic partial nephrectomy
12 13 8 3 Pathology: Benign Malignant 2 34 Histologic subtype of malignant tumours (n=34):
Clear cell carcinoma Papillary Chromophobe 27 6 1 Tumour stage: pT1 pT2 pT3 19 3 11 Nodal invasion: N0 N1 33 1 Distant metastases: M0 M1 32 2 Tumour grade: 1-2 3-4 16 18
Figure 1. A Raman spectrum acquired on a section of a clear-cell carcinoma. The background fluorescence has been removed so Raman peaks and valleys can be visualised.
Figure 2. Experimental setting showing the Raman spectrophotometer, the Raman probe applied on a renal specimen, and the laptop computer on which optical graphs are displayed.
Figure 3. Raman spectra of normal (orange) and tumoural (blue) renal tissue. For clarity, two samples of 10 tumoural and normal spectra are represented in the 900–1800 region of the spectrum.
Figure 4. Raman spectra of high-grade (orange) and low-grade (blue) RCC. For clarity, 10 samples of low- and high-grade tumours are displayed.
Figure 5. Raman spectra of clear-cell (orange) and papillary and chromophobe (blue) tumours. For clarity, only 10 samples from each histologic subtype are represented.