Including information about co-morbidity in
estimates of disease burden: results from the World
Health Organization World Mental Health Surveys
J. Alonso1,2, G. Vilagut1,2, S. Chatterji3, S. Heeringa4
, M. Schoenbaum5
, T. Bedirhan U¨ stu¨n6 , S. Rojas-Farreras1, M. Angermeyer7, E. Bromet8, R. Bruffaerts9, G. de Girolamo10, O. Gureje11, J. M. Haro12, A. N. Karam13, V. Kovess14, D. Levinson15, Z. Liu16, M. E. Medina-Mora17, J. Ormel18, J. Posada-Villa19, H. Uda20and R. C. Kessler21*
1Health Services Research Unit, Institut Municipal d’Investigacio´ Me`dica (IMIM-Hospital del Mar), Barcelona, Spain ;2CIBER en Epidemiologı´a y Salud Pu´blica (CIBERESP), Barcelona, Spain ;3World Health Organization, Geneva, Switzerland ;4University of Michigan, Institute for Social Research, Ann Arbor, MI, USA ;5National Institute of Mental Health, Bethesda, MD, USA ;6World Health Organization, EIP/HFS, Geneva, Switzerland ;7Centre for Public Mental Health, Go¨sing am Wagram, Austria ;8State University of New York, Stony Brook, New York, USA ; 9University Hospital Gasthuisberg, Leuven, Belgium ;10IRCCS Centro S. Giovanni di Dio Fatebenefratelli, Brescia, Italy ;11University College Hospital, Ibadan, Nigeria ;12Sant Joan de De´u-SSM, CIBERSAM, Barcelona, Spain ;13Department of Psychiatry and Clinical Psychology, Saint George Hospital University Medical Center, Department of Psychiatry and Clinical Psychology, Faculty of Medicine, Balamand University Medical School, and the Institute for Development, Research, Advocacy and Applied Care (IDRAAC), Beirut, Lebanon ;14EA4069 Universite´ Paris Descartes, Paris, France ;15Research & Planning, Mental Health Services Ministry of Health, Jerusalem, Israel ;16Institute of Mental Health, Peking University, Beijing, People’s Republic of China ;17National Institute of Psychiatry Ramon de la Fuente, Mexico City, Mexico ; 18Interdisciplinary Center for Psychiatric Epidemiology, University Medical Center Groningen, The Netherlands ;19Colegio Mayor
de Cundinamarca University, Bogota, Colombia ;20Health, Social Welfare, and Environmental Department, Osumi Regional Promotion Bureau, Kagoshima Prefecture, Japan ;21Department of Health Care Policy, Harvard Medical School, Boston, MA, USA
Background. The methodology commonly used to estimate disease burden, featuring ratings of severity of individual conditions, has been criticized for ignoring co-morbidity. A methodology that addresses this problem is proposed and illustrated here with data from the World Health Organization World Mental Health Surveys. Although the analysis is based on self-reports about one’s own conditions in a community survey, the logic applies equally well to analysis of hypothetical vignettes describing co-morbid condition profiles.
Method. Face-to-face interviews in 13 countries (six developing, nine developed ; n=31 067 ; response rate=69.6 %) assessed 10 classes of chronic physical and nine of mental conditions. A visual analog scale (VAS) was used to assess overall perceived health. Multiple regression analysis with interactions for co-morbidity was used to estimate associ-ations of conditions with VAS. Simulation was used to estimate condition-specific effects.
Results. The best-fitting model included condition main effects and interactions of types by numbers of conditions. Neurological conditions, insomnia and major depression were rated most severe. Adjustment for co-morbidity re-duced condition-specific estimates with substantial between-condition variation (0.24–0.70 ratios of condition-specific estimates with and without adjustment for co-morbidity). The societal-level burden rankings were quite different from the individual-level rankings, with the highest societal-level rankings associated with conditions having high prevalence rather than high individual-level severity.
Conclusions. Plausible estimates of disorder-specific effects on VAS can be obtained using methods that adjust for co-morbidity. These adjustments substantially influence condition-specific ratings.
Received 17 November 2009 ; Revised 5 May 2010 ; Accepted 5 May 2010 ; First published online 16 June 2010 Key words: Co-morbidity, epidemiology, global burden of disease, mental health, visual analog scale.
Introduction
It is becoming increasingly clear that no country can afford to provide universal healthcare coverage for all illnesses to all citizens. Triage rules are needed to
allocate available healthcare resources to deal with the inevitable shortfall between resources and need. Among the several kinds of information used to help develop these rules, comparative illness burden esti-mates have been especially valuable as a reference standard for government health policy planners (Murray & Lopez, 1996 ; Murray et al. 2001 ; Lopez & Mathers, 2007). A central component of these estimates is the condition-specific severity weight, a * Address for correspondence : R. C. Kessler, Ph.D., Department of
Health Care Policy, Harvard Medical School, 180 Longwood Avenue, Boston, MA 02115, USA.
statistic obtained by having expert raters evaluate the relative burdens of different conditions using the per-son trade-off method (Murray & Lopez, 1996 ; Murray et al. 2001 ; WHO, 2004). An important limitation of this approach is that the vignettes represent single conditions rather than more realistic cases where an individual suffers from a number of different con-ditions (Fortin et al. 2007). This is an important limi-tation because methodological research has shown that condition-specific severity weights vary as a func-tion of the presence of co-morbidity (Moussavi et al. 2007).
Previous attempts to take co-morbidity into con-sideration in estimating condition-specific illness burden have been limited by the fact that simplistic models were used to estimate effects (Verbrugge et al. 1989 ; Maddigan et al. 2005). The current report pres-ents the results of an analysis aimed at generating condition-specific estimates of disease burden in a more realistic way. The method is illustrated in an analysis of data collected in general population sur-veys on the joint associations of health conditions re-ported by respondents and overall respondent ratings of perceived health, although the same logic could be applied to the analysis of complex vignettes describing co-morbid condition profiles.
Method The sample
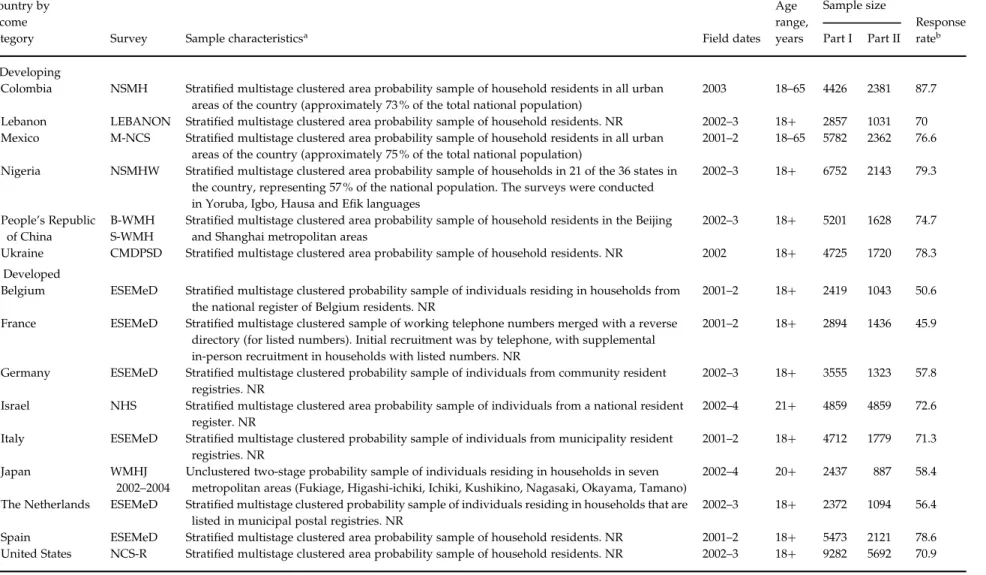
Data come from surveys carried out in 15 countries by the World Health Organization (WHO) World Mental Health (WMH) Survey Initiative (Kessler & U¨ stu¨n, 2008). Of the countries, six are classified by the World Bank as developing (Colombia, Lebanon, Nigeria, Mexico, People’s Republic of China, Ukraine) and nine as developed (Belgium, France, Germany, Italy, Israel, Japan, The Netherlands, Spain, and United States of America) (Table 1). Country-specific response rates ranged from 45.9 % (France) to 87.7 % (Colombia), with a weighted (by sample size) average response rate across surveys of 69.6 %. All surveys were based on probability samples of the adult household popu-lations in the participating countries or regions within the countries. Respondents were aged 18+ years other than in Israel, where the minimum age was 21 years. The upper end of the age range was unbounded in all countries other than Colombia, Mexico and the People’s Republic of China, where the upper bound was 65 years. More details about WMH sampling and eligibility are reported elsewhere (Heeringa et al. 2008).
All WMH interviews were conducted face-to-face by trained lay interviewers. Standardized interviewer
training and quality-control procedures were used (Pennell et al. 2008). Informed consent was obtained before beginning interviews. Each interview had two parts. All respondents completed part I, which con-tained assessments of core mental disorders. The part II interview, which assessed physical disorders and correlates, was administered to 100 % of respondents who met lifetime criteria for any of part I mental dis-order plus a probability subsample of other part I re-spondents. A part II weight equal to the inverse of the respondent’s probability of selection into part II was used to adjust for differential selection into part II.
Measures
Chronic physical conditions
Physical conditions were assessed with a chronic conditions checklist based on the US National Health Interview Survey list (Schoenborn et al. 2003 ; Center for Disease Control and Prevention, 2004). Respon-dents were asked to report whether they ever had a series of symptom-based conditions (e.g. chronic headaches) and whether a health professional ever told them they had a series of silent conditions (e.g. cancer). Information was obtained whether epi-sodic conditions were still present in the previous 12 months. Checklists like this yield more accurate reports than estimates derived from responses to open-ended questions (Baker et al. 2001 ; Knight et al. 2001). These reports were grouped into ten categories to maximize comparability with previous studies (Murray et al. 2001). The categories include arthritis, cancer, cardiovascular disorders (heart attack, heart disease, hypertension, stroke), chronic pain conditions (chronic back or neck pain, other chronic pain con-ditions), diabetes, frequent or severe headaches or migraines, chronic insomnia, neurological disorders (multiple sclerosis, Parkinson’s, epilepsy, seizure dis-orders), digestive disorders (stomach or intestinal ulcer, irritable bowel disorder) and respiratory dis-orders (seasonal allergies, asthma, chronic obstructive pulmonary disease, emphysema).
Mental disorders
Mental disorders were assessed with the WHO Composite International Diagnostic Interview, version 3.0 (CIDI), a fully structured lay-administered inter-view designed to generate diagnoses of common mental disorders according to the definitions and criteria of both the International Classification of Diseases, 10th revision (ICD-10) and Diagnostic and Statistical Manual of Mental Disorders, 4th edition (DSM-IV) systems (Kessler & U¨ stu¨n, 2004, 2008). DSM-IV criteria are used here. The nine mental 874 J. Alonso et al.
https:/www.cambridge.org/core/terms. https://doi.org/10.1017/S0033291710001212
disorders include major depressive episode, bipolar disorder I–II, panic–agoraphobia (panic disorder or agoraphobia without a history of panic disorder), specific phobia, social phobia, generalized anxiety disorder, post-traumatic stress disorder, alcohol abuse with or without dependence, and drug abuse with or without dependence. WMH clinical reappraisal studies have shown that the diagnoses of these dis-orders based on the CIDI have generally good concordance with diagnoses based on blinded clinician-administered reappraisal interviews (Haro et al. 2006). As with physical conditions, we focus on mental conditions present at some time in the 12 months before interview.
Health valuation
Respondents were asked to make a health valuation after all physical and mental conditions had been as-sessed. We used a 0–100 visual analog scale (VAS) where 0 represents ‘ the worst possible health a person can have ’ and 100 represents ‘ perfect health ’ to describe their own overall physical and mental health during the previous 30 days taking into consideration all the physical and mental conditions reviewed in the sur-vey. The recall period for the VAS (30 days) is different from that for the conditions (12 months) because we wanted to include effects not only of active conditions but also of recent conditions that, although not active, might still have an important effect on health valu-ations (e.g. a heart attack that occurred several months before the interview). The decision to anchor the low end of the scale as defining ‘ the worst possible health ’ rather than ‘ death ’ is consistent with the approach taken in the widely-used EQ-5DTM self-report ques-tionnaire (http://www.euroqol.org) and was taken in the WMH surveys based on the finding in previous research that some health states are valued lower than death (Macran & Kind, 2001). While the decision regarding which of these alternative lower-bound anchors to use probably had little effect on the esti-mates of relative disease burden reported here, it is noteworthy that an explicit valuation of death would be needed if we wanted to use the data to calculate years of life lived in less than perfect health.
Analysis methods
A series of multiple regression models was used to estimate joint predictive associations of conditions with VAS scores controlling age, sex and country. As the sample size was too small to allow each of the 524 288 (219
) logically possible multivariate condition profiles to be a separate predictor, the models necess-arily made simplifying assumptions about effects of
co-morbidity. The first multivariate model (M1) as-sumed additivity ; that is, a separate predictor for each condition without interactions. M2 included a series of predictors for number of conditions (e.g. one predictor for having exactly one condition, another for exactly two, etc) without information about type of condition. M3 included 19 predictors for type and number of conditions. The number-of-conditions dummies in this model represent aggregate patterns of co-morbidity assumed independent of types. M4 allowed for the effects of type to be a linear function of number of other conditions. More complex models allowed for interactions of type with number using weighted counts based on type coefficients, but these results are not reported because the models did not fit the data as well as the simpler models.
The skewed distribution of the VAS scores made ordinary least-squares (OLS) regression analysis both biased and inefficient. This problem was addressed in two ways. First, a two-part modeling approach (Duan et al. 1984) was used where a part I logistic regression equation (Hosmer & Lemeshow, 2001) predicted having a VAS score of 100 v.<100 in the total sample and a part II linear regression equation predicted scores in the 0–99 range. Individual-level predicted scores were estimated by multiplying predicted values based on the two equations. A problem with this approach is that non-random variance in prediction errors can lead to bias even when sophisticated trans-formation methods are used (Manning, 1998). A second approach, generalized linear models (GLM), was used to address that problem by pre-specifying non-linear associations and non-random error struc-tures in one-part models. Such models can sometimes fit highly skewed data better than two-part models (McCullagh & Nelder, 1989 ; Mullahy, 1998 ; Manning & Mullahy, 2001). We used a number of different two-part model specifications and a number of standard GLM specifications and then selected the best specifi-cation using standard empirical model comparison procedures (Buntin & Zaslavsky, 2004). All models were estimated separately in developed and develop-ing countries in an effort to obtain a rough indication of variation in results by development, but no attempt was made to estimate country-specific models.
M4, which allowed the effects of co-morbidity to vary by type of condition as a linear function of num-ber of other conditions, was the best-fitting model. This is a model of intermediate complexity in that it allows interactions to vary across conditions but not across particular pairs or higher numbers of disorders. Although this is unlikely to be the optimal interaction model, the fact that it provides the best fit across the range of models considered suggests that it is a use-ful first approximation. But a complication, as in any
Table 1.Sample characteristics of the WMH Surveys Country by
income
category Survey Sample characteristicsa Field dates
Age range, years Sample size Response rateb Part I Part II I. Developing
Colombia NSMH Stratified multistage clustered area probability sample of household residents in all urban areas of the country (approximately 73 % of the total national population)
2003 18–65 4426 2381 87.7
Lebanon LEBANON Stratified multistage clustered area probability sample of household residents. NR 2002–3 18+ 2857 1031 70
Mexico M-NCS Stratified multistage clustered area probability sample of household residents in all urban areas of the country (approximately 75 % of the total national population)
2001–2 18–65 5782 2362 76.6
Nigeria NSMHW Stratified multistage clustered area probability sample of households in 21 of the 36 states in the country, representing 57 % of the national population. The surveys were conducted in Yoruba, Igbo, Hausa and Efik languages
2002–3 18+ 6752 2143 79.3
People’s Republic of China
B-WMH Stratified multistage clustered area probability sample of household residents in the Beijing and Shanghai metropolitan areas
2002–3 18+ 5201 1628 74.7
S-WMH
Ukraine CMDPSD Stratified multistage clustered area probability sample of household residents. NR 2002 18+ 4725 1720 78.3
II. Developed
Belgium ESEMeD Stratified multistage clustered probability sample of individuals residing in households from the national register of Belgium residents. NR
2001–2 18+ 2419 1043 50.6
France ESEMeD Stratified multistage clustered sample of working telephone numbers merged with a reverse directory (for listed numbers). Initial recruitment was by telephone, with supplemental in-person recruitment in households with listed numbers. NR
2001–2 18+ 2894 1436 45.9
Germany ESEMeD Stratified multistage clustered probability sample of individuals from community resident registries. NR
2002–3 18+ 3555 1323 57.8
Israel NHS Stratified multistage clustered area probability sample of individuals from a national resident register. NR
2002–4 21+ 4859 4859 72.6
Italy ESEMeD Stratified multistage clustered probability sample of individuals from municipality resident registries. NR
2001–2 18+ 4712 1779 71.3
Japan WMHJ
2002–2004
Unclustered two-stage probability sample of individuals residing in households in seven metropolitan areas (Fukiage, Higashi-ichiki, Ichiki, Kushikino, Nagasaki, Okayama, Tamano)
2002–4 20+ 2437 887 58.4
The Netherlands ESEMeD Stratified multistage clustered probability sample of individuals residing in households that are listed in municipal postal registries. NR
2002–3 18+ 2372 1094 56.4
Spain ESEMeD Stratified multistage clustered area probability sample of household residents. NR 2001–2 18+ 5473 2121 78.6
United States NCS-R Stratified multistage clustered area probability sample of household residents. NR 2002–3 18+ 9282 5692 70.9
WMH, World Mental Health ; NSMH, The Colombian National Study of Mental Health ; LEBANON, Lebanese Evaluation of the Burden of Ailments and Needs of the Nation ; NR, nationally representative ; M-NCS, The Mexico National Comorbidity Survey ; NSMHW, The Nigerian Survey of Mental Health and Wellbeing ; B-WMH, The Beijing World Mental Health Survey ; S-WMH, The Shanghai World Mental Health Survey ; CMDPSD, Comorbid Mental Disorders during Periods of Social Disruption ; ESEMeD, The European Study of the
876 J. Alonso et al. https:/www.cambridge.org/core/terms . https://doi.org/10.1017/S0033291710001212 Downloaded from https:/www.cambridge.org/core
. University of Basel Library
, on
11 Jul 2017 at 10:11:14
interaction model, is that the coefficients have no intuitive interpretation. We addressed this problem by using individual-level simulation to transform coef-ficients to a scale of average decrement in VAS scores associated with each condition. This was done by generating two estimates of predicted VAS scores for each respondent from each simulation. The first esti-mate was based on the model parameters in M4, while the second estimate was based on a revision of this model that assumed none of the respondents had one particular focal condition. The first estimate was then subtracted from the second and the sum across re-spondents was divided by the number of rere-spondents with the focal condition to estimate the average indi-vidual-level decrease in VAS scores associated with that condition taking co-morbidity into consideration. This estimate was then projected to the societal level (i.e. the effect on the mean VAS score) by multiplying it by condition prevalence.
It is noteworthy that the simulation approach, by virtue of the fact that it works with mean VAS scores, treats the VAS as an interval scale. This assumption has been called into question in some previous studies (Krabbe et al. 2006 ; Parkin & Devlin, 2006) and non-linear monotonic transformations have been proposed to approximate interval scale properties (Krabbe, 2008). However, strong linear associations have been found between health state values based on VAS scores and ordinal (Craig et al. 2009) or partially metric (Krabbe et al. 2007) scaling methods. As a result, and given that we explored a number of different non-linear transformations of the VAS in the GLM models, we treated the VAS as an interval scale in the current analysis.
Because the WMH sample design featured weight-ing and clusterweight-ing, all multiple regression analyses used the Taylor series linearization method (Wolter, 1985) implemented in the SUDAAN software system (2002 ; Research Triangle Institute, USA). Standard errors of simulation estimates were obtained using the method of Jackknife repeated replications (Wolter, 1985) implemented with a SAS macro (SAS/STAT1
software, version 9.1 for Unix, SAS Institute, Inc., USA). Statistical significance was consistently evalu-ated using two-sided 0.05 level tests.
Results
Condition prevalence estimates
More than half of all respondents reported having one or more conditions in the 12 months before interview (Table 2). Of those with any conditions, 54.6 % had more than one and 51 % of those with more than one had more than two conditions. The majority of
Epidemiology of Mental Disorders ; NHS, Israel National Health Survey ; W MHJ 2002–2004, World Mental Health Japan Survey ; NCS-R, The US National Como rbidity Survey Replication. aMost WMH Surveys are based on stratified multistage clustered area probability household samples in which samples of areas equivalent to counties or m unicipalities in the USA were selected in the first stage followed by one or more subsequent stages of geographic sampling (e.g. towns within counties, blocks within towns, hou seholds within blocks) to arrive at a sample of households, in each of which a listing of household members was created and one or two people were selected from this listing to be interviewe d. No substitution was allowed when the originally sampled household resident could not be interviewed. These household samples were selected from Census area data in all countrie s other than France (where telephone directories were used to select households) and The Netherlands (where postal registries were used to select households). Several WMH sur veys (Belgium, Germany, Italy) used municipal resident registries to select respondents without listing households. The Japanese sample is the only totally unclustered sample, w ith households randomly selected in each of the four sample areas and one random respondent selected in each sample household. Of the 15 surveys, 10 are based on nationally representative household samples, while two others are based on nationally representative household samples in urbanized areas (Colombia, Mexico). bThe response rate is calculated as the ratio of the number of households in which an interview was completed to the number of households originally samp led, excluding from the denominator households those known not to be eligible either because of being vacant at the time of initial contact or because the residents were unabl e to speak the designated languages of the survey. The weighted average response rate is 73 %.
conditions were reported to be more prevalent in developed than developing countries.
Distribution of VAS scores
VAS scores are distributed quite similarly in devel-oping and developed countries. Fewer than 10 % of respondents in either set of countries have scores below 50, while 20.8 % have scores of 100 and an additional 7.4 % have scores in the range 91–100. The median among respondents with scores less than 100 is 80 [interquartile range (IQR)=70–90] in both developing and developed countries.
Selecting a functional form and error structure for the models
We estimated seven one-part GLM models and seven two-part models. We evaluated comparative model fit by plotting associations between predicted mean VAS scores and observed mean scores for each decile
of predicted VAS scores and using a number of other model-fitting tests that have been proposed in the econometrics literature (Buntin & Zaslavsky, 2004) (detailed results are available on request). The GLM model with a square root functional form and inde-pendent error structure and the one-part OLS model were found to be the best-fitting models in terms of all the tests we considered. Based on this result and the simpler interpretation of the OLS model than the GLM model, we chose the OLS model.
The individual-level predictive associations of conditions with VAS scores
The coefficients in M1 are significant as a set and show each condition to have a negative predictive associ-ation with VAS scores (Table 3). (Only a single illustra-tive fit statistic is shown in Table 3. More detailed results for each model are available on request.) The coefficients in M2 are also significant as a set and show that VAS scores decrease monotonically with Table 2.Twelve-month prevalence estimates of chronic physical conditions and mental conditions separately in WMH Surveys in developing and developed countries
Developing countries (n=10 836) Developed countries (n=20 231) All countries (n=31 067)
I. Chronic physical conditions 47.1 (0.8) 56.1 (0.6) 52.9 (0.5)
Arthritis 11.5 (0.4) 15.6 (0.4) 14.2 (0.3)
Cancer 0.5 (0.1) 3.2 (0.2) 2.2 (0.1)
Cardiovascular disorders 14.3 (0.5) 18.9 (0.3) 17.3 (0.3)
Chronic pain conditions 22.5 (0.6) 22.7 (0.4) 22.6 (0.3)
Diabetes 2.7 (0.2) 5.3 (0.2) 4.3 (0.1) Digestive disorders 5.0 (0.3) 2.7 (0.1) 3.5 (0.1) Headaches or migraines 14.5 (0.5) 11.4 (0.3) 12.5 (0.3) Insomnia 3.2 (0.2) 5.1 (0.2) 4.4 (0.2) Neurological disorders 1.0 (0.1) 1.1 (0.1) 1.0 (0.1) Respiratory disorders 12.0 (0.5) 19.8 (0.5) 17.1 (0.4)
II. Mental conditions 12.7 (0.4) 15.1 (0.4) 14.2 (0.3)
Alcohol abuse 2.4 (0.2) 1.5 (0.1) 1.8 (0.1)
Bipolar disordera 1.0 (0.1) 2.1 (0.2) 1.6 (0.1)
Drug abuseb 0.3 (0.1) 0.8 (0.1) 0.6 (0.1)
Generalized anxiety disorder 0.5 (0.1) 1.6 (0.1) 1.2 (0.1)
Major depressive episode 4.9 (0.2) 6.4 (0.2) 5.8 (0.1)
Panic disorder 1.2 (0.1) 1.8 (0.1) 1.6 (0.1)
Post-traumatic stress disorder 0.8 (0.1) 1.7 (0.1) 1.4 (0.1)
Social phobiac 1.5 (0.1) 3.5 (0.2) 2.7 (0.1)
Specific phobiad 5.4 (0.3) 6.6 (0.3) 6.2 (0.2)
III. Any condition 52.0 (0.8) 60.3 (0.6) 57.3 (0.5)
WMH, World Mental Health.
Values are given as percentage (standard error).
aBipolar disorder was not assessed in Belgium, France, Germany, Israel, Italy, The Netherlands, Nigeria, Spain and Ukraine. bDrug abuse was not assessed in Belgium, France, Germany, Italy, The Netherlands and Spain.
cSocial phobia was not assessed in Israel.
dSpecific phobia was not assessed in Israel and Ukraine. 878 J. Alonso et al.
https:/www.cambridge.org/core/terms. https://doi.org/10.1017/S0033291710001212
number of conditions. The M3 results show that the individual conditions continue to have generally negative coefficients when controlling for number of conditions and that the coefficients vary significantly across conditions. The coefficients associated with number of conditions in M3 are significantly negative. This indicates sub-additive interactions : that the joint adverse associations of co-morbid condition clusters with VAS scores are less than the sum of the associ-ations of the individual pure conditions in the clusters taken one at a time. M4 shows that these non-additive associations vary significantly across conditions.
Simulated individual-level estimates
Transformation of the M4 coefficients using simulation shows that the condition-specific individual-level esti-mates are consistently negative (Table 4). Coefficients for only two conditions (digestive disorders and speci-fic phobia) differ signispeci-ficantly between developing and developed countries (both higher in developed). Magnitude of estimates is also quite similar in devel-oping versus developed countries, with median values on the 0–100 VAS of 5.4 (IQR=3.2–5.8) in develop-ing and 4.9 (IQR=3.1–7.1) in developed countries. Differences in coefficients across conditions are statistically significant in the total sample and fairly consistent in developing versus developed coun-tries. The Spearman rank-order correlation among
condition estimates between developed and develop-ing countries is 0.54. The most notable exception is drug abuse, ranked 1st in developing countries and 14th in developed countries.
Coefficients based on the bivariate model (i.e. con-sidering only one condition at a time in predicting VAS) are consistently higher than those in the multi-variate model, with the condition-specific ratio of the latter to former in the range 0.24–0.70 and a median ratio of 0.42 (IQR=0.31–0.51) (Table 5) Very similar results are found in developing [0.53 (IQR=0.35–0.62)] and developed [0.41 (IQR=0.27–0.51)] countries. The influence of co-morbidity can be seen in the fact that the correlation across conditions between mean number of co-morbid conditions (last column, Table 5) and the ratio of the coefficient based on the bivariate model to the coefficient based on the multivariate model (penultimate column, Table 5) is a statistically significantx0.46.
Simulated societal-level predictive associations of conditions with mean VAS scores
Societal-level associations are a joint function of prevalence and severity. We derived these estimates by multiplying individual-level estimates by the condition prevalence estimates to arrive at estimated associations of conditions with changes in mean VAS scores in the population (Table 6). Of the coefficients, Table 3.Model comparisons for the multivariate associations of conditions on VAS scores
separately in WMH Surveys in developing and developed countries
Model AICa Developing countries Developed countries All countries M1.Types of disordersb 95788.4 176722.1 272549.3 M2. Number of disordersc 95874.6 177062.4 273024.7
M3. Types and number of disordersd 95757.2 176703.4 272527.5
M4. M3+interactions between types and number of disorderse
95751.10f 176628.86f 272468.16f
VAS, Visual analog scale ; WMH, World Mental Health ; AIC, Akaike’s Information Criterion.
aOnly one illustrative test statistic, AIC, is reported in this table, but model comparison was based on a number of different tests. For a description, see the text.
bA separate dummy variable predictor for each of the 19 conditions.
cA separate dummy variable predictor for having exactly one of the 19 disorders, exactly two of the 19 disorders, etc.
dThe predictors in M1 and M2 with the exception that the dummy predictor for having exactly one disorder is omitted.
eThe predictors in M3 plus interactions between each of the dummy predictors for type of disorders and a continuous variable for number of disorders.
eight differ significantly between developing and de-veloped countries, all but one higher in dede-veloped countries. The median value of the coefficients is quite similar in developing [0.09 (IQR=0.03–0.23)] and developed [0.14 (IQR=0.07–0.40)] countries.
While most societal-level coefficients do not differ significantly by development, 74.8 % of the 171 (19r 18/2) differences between pairs of the 19 coefficients are statistically significant at the 0.05 level in the total sample. The Spearman rank-order correlation among these conditions between sets of countries is 0.80. The top five conditions are the same in developing and developed countries, although the rankings differ somewhat. These top conditions are dominated by high-prevalence conditions with intermediate magni-tudes of individual-level effects (6th–13th ranks), with only chronic pain conditions major depression being in the top five in terms of magnitude of individual-level effects.
Discussion
A number of limitations must be considered in inter-preting these results. First, only a restricted set of common conditions was included in the analysis and some were pooled to form larger disorder groups. A number of burdensome conditions, such as dementia and psychosis, were not included. Expansion and disaggregation is clearly needed in future research. Second, diagnoses of chronic physical conditions were based on self-reports that could have been biased. Such bias might account for the generally higher prevalence estimates of these conditions in developed than developing countries. Third, we focused on 12-month prevalence of conditions but 30-day health valuations, as these were the time-frames included in the WMH surveys. This difference in recall periods would be expected to lead to an underestimate of the severity of the active phases of episodic conditions Table 4.Simulated individual-level condition-specific severity estimates based on the best-fitting regression model separately in WMH Surveys in developing and developed countries
Developing countries Developed countries All countries
Estimate (S.E.) Rank Estimate (S.E.) Rank Estimate (S.E.) Rank
I. Chronic physical conditions
Arthritis x4.6 (0.7)* 13 x4.8 (0.5)* 11 x4.9 (0.4)* 10
Cancer x3.2 (4.1) 14 x0.6 (0.9) 19 x0.8 (0.9) 19
Cardiovascular disorders x5.3 (0.7)* 8 x5.0 (0.5)* 9 x4.9 (0.4)* 9
Chronic pain conditions x5.8 (0.7)* 6 x7.1 (0.4)* 6 x6.8 (0.4)* 4
Diabetes x6.1 (1.7)* 5 x6.0 (0.9)* 7 x6.1 (0.8)* 6 Digestive disorders x0.5 (0.9) 19 x7.2 (1.2)* 5 x4.1 (0.8)*# 14 Headaches or migraines x5.1 (0.7)* 9 x4.1 (0.5)* 13 x4.5 (0.4)* 13 Insomnia x7.2 (1.5)* 4 x7.9 (0.7)* 3 x7.9 (0.7)* 2 Neurological disorders x9.4 (2.3)* 2 x13.1 (1.6)* 1 x12.0 (1.4)* 1 Respiratory disorders x1.6 (0.7)* 16 x1.1 (0.4)* 18 x1.4 (0.4)* 18
II. Mental conditions
Alcohol abuse x4.6 (2.1)* 12 x2.1 (0.9)* 17 x3.2 (1.1)* 15
Bipolar disorder x4.9 (2.6) 11 x5.1 (1.8)* 8 x5.3 (1.5)* 7
Drug abuse x11.7 (4.3)* 1 x3.1 (1.7) 14 x5.2 (1.7)* 8
Generalized anxiety disorder x1.1 (2.3) 17 x4.9 (1.3)* 10 x4.5 (1.1)* 12
Major depressive episode x7.3 (0.9)* 3 x7.9 (0.7)* 2 x7.6 (0.5)* 3
Panic disorder x5.4 (2.0)* 7 x7.4 (1.2)* 4 x6.7 (1.0)* 5
Post-traumatic stress disorder x5.0 (2.2)* 10 x4.3 (1.0)* 12 x4.7 (0.9)* 11
Social phobia x2.2 (1.3) 15 x2.6 (1.0)* 16 x2.6 (0.9)* 16
Specific phobia x0.6 (0.9) 18 x3.0 (0.8)* 15 x2.3 (0.6)*# 17
III. Any condition
Physical disorders x9.3 (0.5)* x8.2 (0.3)* x8.6 (0.3)*
Mental disorders x6.1 (0.5)* x8.2 (0.4)* x7.4 (0.3)*#
Any disorder x10.3 (0.5)* x9.9 (0.3)* x10.1 (0.3)*
WMH, World Mental Health ;S.E., standard error. * p<0.05(two-sided test).
#Significant difference between developing and developed countries (p<0.05 ; two-sided test). 880 J. Alonso et al.
https:/www.cambridge.org/core/terms. https://doi.org/10.1017/S0033291710001212
(e.g. migraine), although it should yield an accurate estimate of the average severity of conditions in a typical month (30 days) of the year (12 months). A re-lated limitation is that even a 12-month time-frame is relatively short compared with the time-frames used in some other health valuation studies (e.g. 10 years or lifetime).
Another limitation is that the highly skewed dis-tribution of VAS scores and non-additive effects of co-morbid conditions might have led to instability of results. Even though we explored use of GLM rather than OLS and examined a number of different model specifications to capture effects of co-morbidity, it is possible that future research will discover better specifications either of functional form or of joint associations of co-morbid conditions with health valuations. In particular, the use of data mining tech-niques such as regression tree analysis (Breiman et al. 1984 ; Friedman, 1991 ; Breiman, 2001, 2009) might provide useful insights into better specification of interaction effects. A related limitation is that we assumed that the VAS is an interval scale. As noted above in the section on Analysis methods, this
assumption has been called into question in some previous studies (Krabbe et al. 2006 ; Parkin & Devlin, 2006). Non-linear monotonic transformations have been proposed to approximate interval scale proper-ties (Krabbe, 2008 ; Craig et al. 2009). It would be very useful in future methodological research to explore the extent to which these different methods influence results.
Another limitation is that our estimates were based only on the overall adult population in developed and developing countries. The ratings of conditions might be quite different in different population segments (e.g. elderly, women, poor) or in different countries. Future research is needed to investigate these specifi-cations. The use of anchoring vignettes has been shown to help address this problem (Salomon et al. 2004). In addition, a number of statistical methods exist to improve the accuracy of comparisons across subsamples and populations that could profitably be used in future applications (Tandon et al. 2002).
Another limitation is that our results are based on VAS scores assigned by respondents to their own health states rather than to health states based on Table 5.Individual-level condition-specific estimates based on bivariate and the best-fitting multivariate model in the total sample
Bivariatea Multivariate Multivariate/ bivariateb estimate Mean co-morbidityc I. Chronic physical conditions
Arthritis x9.5 (0.5) x4.9 (0.4) 0.51 2.0
Cancer x2.6 (1.1) x0.8 (0.9) 0.31 2.1
Cardiovascular disorders x8.4 (0.4) x4.9 (0.4) 0.59 1.8
Chronic pain conditions x10.9 (0.4) x6.8 (0.4) 0.63 1.8
Diabetes x8.8 (1.0) x6.1 (0.8) 0.70 2.0 Digestive disorders x9.9 (0.9) x4.1 (0.8) 0.41 2.3 Headaches or migraines x9.9 (0.4) x4.5 (0.4) 0.45 2.0 Insomnia x16.0 (0.7) x7.9 (0.7) 0.50 2.9 Neurological disorders x17.8 (1.7) x12.0 (1.4) 0.67 2.6 Respiratory disorders x4.3 (0.4) x1.4 (0.4) 0.31 1.6
II. Mental conditions
Alcohol abuse x7.3 (1.1) x3.2 (1.1) 0.44 1.8
Bipolar disorder x17.8 (1.4) x5.3 (1.5) 0.30 3.9
Drug abuse x12.4 (1.8) x5.2 (1.7) 0.42 2.6
Generalized anxiety disorder x13.4 (1.1) x4.5 (1.1) 0.34 3.0
Major depressive episode x14.8 (0.5) x7.6 (0.5) 0.52 2.5
Panic disorder x16.6 (1.0) x6.7 (1.0) 0.40 3.4
Post-traumatic stress disorder x15.3 (1.1) x4.7 (0.9) 0.31 3.5
Social phobia x11.2 (0.8) x2.6 (0.9) 0.24 2.9
Specific phobia x8.1 (0.6) x2.3 (0.6) 0.29 2.2
Values are given as estimate (standard error).
aNineteen models with one condition at a time adjusted by demographic controls.
bThe ratio of the estimate based on the best-fitting model to the estimate based on the bivariate model.
hypothetical vignettes. While there is general agree-ment that perceptions of people in the general popu-lation should be taken into consideration in making health valuations (Gudex et al. 1996), concerns have been raised that bias exists in the perceptual ratings of community respondents based on their own illness experiences (Stiggelbout & de Vogel-Voogt, 2008) and their familiarity with the experiences of people close to them (Krabbe et al. 2006), resulting in a general preference for health valuations made by experts (Marquie et al. 2003). Furthermore, bias in self-reports in the WMH data might have been greater for mental than physical conditions because so many questions were asked in the survey about mental conditions and the VAS was administered only at the end of the survey. It would be useful to inves-tigate this potential bias in future applications by randomizing the order of presentation of the VAS question in the survey. Methods have been developed
to integrate VAS responses with responses based on other valuation methods (e.g. time trade-off, will-ingness to pay) that might also profitably be used in future studies to evaluate these biases (Salomon & Murray, 2004).
A less obvious limitation, finally, is that the simu-lation method evaluated marginal effects of individual conditions. This method can be faulted because it im-plicitly assumes that the presence versus absence of a single condition can be changed while holding con-stant all other conditions. This assumption would be plausible if all co-morbid conditions were either causes or risk markers (Kraemer et al. 1997) of focal conditions. However, in cases where the co-morbid condition is a consequence of the focal condition or where two or more conditions are reciprocally related, the simulation method used here will underestimate the effect of the focal condition (assuming that co-morbidity is positive) by controlling for one or Table 6.Societal-level condition-specific estimates of effects on mean visual analog scale scores based on the best-fitting multivariate model for developed and developing countries
Developing countries Developed countries All countries
Estimate (S.E.) Rank Estimate (S.E.) Rank Estimate (S.E.) Rank
I. Chronic physical conditions
Arthritis x0.5 (0.1)* 4 x0.8 (0.1)* 3 x0.7 (0.1)* 3
Cancer x0.0 (0.0) 18 x0.0 (0.0) 19 x0.0 (0.0) 19
Cardiovascular disorders x0.8 (0.1)* 2 x0.9 (0.1)* 2 x0.8 (0.1)* 2
Chronic pain conditions x1.3 (0.2)* 1 x1.6 (0.1)* 1 x1.6 (0.1)* 1
Diabetes x0.2 (0.0)* 8 x0.3 (0.0)* 7 x0.3 (0.0)*# 7 Digestive disorders x0.0 (0.0) 15 x0.2 (0.0)* 9 x0.1 (0.0)*# 9 Headaches or migraines x0.7 (0.1)* 3 x0.5 (0.1)* 5 x0.6 (0.0)*# 4 Insomnia x0.2 (0.0)* 6 x0.4 (0.0)* 6 x0.4 (0.0)*# 6 Neurological disorders x0.1 (0.0)* 10 x0.1 (0.0)* 11 x0.1 (0.0)* 10 Respiratory disorders x0.2 (0.1)* 7 x0.2 (0.1)* 8 x0.2 (0.1)* 8
II. Mental conditions
Alcohol abuse x0.1 (0.0)* 9 x0.0 (0.0)* 17 x0.1 (0.0)* 15
Bipolar disorder x0.0 (0.0) 16 x0.0 (0.0)* 16 x0.0 (0.0)* 17
Drug abuse x0.0 (0.0) 13 x0.0 (0.0)* 18 x0.0 (0.0)* 18
Generalized anxiety disorder x0.0 (0.0) 19 x0.1 (0.0)* 13 x0.0 (0.0)*# 16
Major depressive episode x0.4 (0.0)* 5 x0.5 (0.0)* 4 x0.4 (0.0)*# 5
Panic disorder x0.1 (0.0)* 11 x0.1 (0.0)* 12 x0.1 (0.0)*# 12
Post-traumatic stress disorder x0.0 (0.0) 12 x0.1 (0.0)* 14 x0.1* (0.0)* 13
Social phobia x0.0 (0.0) 14 x0.1 (0.0)* 15 x0.1 (0.0)* 14
Specific phobia x0.0 (0.0) 17 x0.2 (0.0)* 10 x0.1 (0.0)*# 11
III. Any condition
Physical x4.4 (0.2)* x4.6 (0.2)* x4.6 (0.2)*
Mental x0.8 (0.1)* x1.2 (0.1)* x1.1 (0.0)*#
Any x5.4 (0.3)* x5.9 (0.2)* x5.8 (0.2)*
S.E., Standard error. * p<0.05(two-sided test).
#Significant difference between developing and developed countries (p<0.05 ; two-sided test). 882 J. Alonso et al.
https:/www.cambridge.org/core/terms. https://doi.org/10.1017/S0033291710001212
more of the intervening pathways through which that condition influences VAS scores.
This underestimation could be removed by deleting controls for all conditions that are thought to mediate the total effect of the focal condition. However, in the case where these co-morbid conditions are recipro-cally related to the focal condition, exclusion of the co-morbid conditions from the prediction equation will lead to overestimation of the effect of the focal condition. The only plausible way to address that issue is to develop a methodology of partial control : that is, to control for the subset of co-morbid con-ditions that has causal effects on the focal concon-ditions but not for the subset that occurs as a consequence of the focal condition. An innovative methodology known as g-estimation has been developed to do this (Young et al. 2010), but this method requires access to large-scale longitudinal epidemiological data that monitor onset and course of co-morbid conditions over time. As a result of this data requirement, use of g-estimation has been minimal (Taubman et al. 2009) and has never to our knowledge been used to study health valuation. This method is nonetheless very promising and deserves to be explored in future studies aimed at sorting out the effects of co-morbidity on health valuation.
Within the context of these limitations, our results show clearly that sensible estimates can be obtained of condition-specific effects on VAS while taking co-morbidity into consideration. As noted in the Intro-duction, a similar approach could be used to study informant ratings by using a series of hypothetical vignettes of people with co-morbid conditions rather than pure conditions. We find that the consideration of co-morbidity makes a substantial difference to ratings. In particular, condition-specific ratings are lower when co-morbidity is taken into consideration due to a general pattern of sub-additive interactions among co-morbid conditions in predicting VAS scores. This sub-additive pattern is consistent with the findings of the one other previous study we know that carried out a similar type of analysis (Verbrugge et al. 1989). Furthermore, we found substantial between-condition variation in the extent to which adjustment for co-morbidity influences estimates.
Although the substantive findings regarding effects of individual conditions on VAS should be interpreted with caution given the limitations enumerated above, it is noteworthy that neurological conditions, insomnia and major depression were estimated to be the most severe conditions at the individual level. The neuro-logical conditions we considered included epilepsy and seizure disorders, Parkinson’s disease and mul-tiple sclerosis, all of which have been shown to have high disability in previous studies (Singer et al. 1999 ;
Jacoby & Baker, 2008). The high ranking of insomnia is surprising because previous studies, although docu-menting a high societal-level burden of insomnia, have generally found this to be due to high preva-lence in conjunction with moderate individual-level burden rather than to high individual-level burden (Roth et al. 2006). The high individual-level severity of insomnia in our study probably lies in the fact that we required a greater sleep disruption (at least 2 h of either delay in sleep onset or disruption in sleep maintenance per night most nights of the week for at least 1 month in the previous year) than previous studies of insomnia (Ohayon, 2002). The high indi-vidual-level estimate we found for depression, finally, is consistent with much previous research (Donohue & Pincus, 2007 ; Wang et al. 2008 ; Gabilondo et al. 2010).
The rank-ordering of the individual-level VAS esti-mates was found to be quite similar in developing and developed countries. However, several exceptions were found. These should be investigated in future studies. Digestive conditions (stomach/intestine ulcer and irritable bowel disorder) were rated considerably more severe in developed than developing countries, possibly reflecting a different mix of cases that might explain the differences in estimated severity. The individual-level estimated severity of drug abuse, in comparison, was substantially higher in developing than developed countries. Differential willingness to admit drug problems might have been involved in this result, as reported prevalence of drug abuse was much lower in developing than developed countries, possibly indicating that the cases we learned of in developing countries were more severe than those in developed countries (Schmidt & Room, 1999).
Comparison of our individual-level condition severity estimates with estimates in an earlier WMH analysis of condition-specific role impairment (Ormel et al. 2008) finds that the conditions rated most severe in that earlier study were generally also rated among the most severe in the current investigation. However, a number of differences in relative ratings exist that could be attributed either to differences in the outcome (i.e. a global VAS score versus a measure of condition-specific role impairment) or to our previous analysis not adjusting for co-morbidity.
Our results regarding societal-level associations are less innovative because, consistent with previous studies, we merely multiplied the prevalence mates of the conditions with the individual-level esti-mates of condition severity to arrive at societal-level estimates of burden. As in previous studies that com-pared individual-level and societal-level estimates (Whiteford, 2000 ; Andlin-Sobocki et al. 2005 ; Saarni et al. 2007), the rank-ordering of conditions differs
considerably between the two, with societal-level estimates influenced importantly by variation in prevalence and the conditions estimated to be most burdensome at the societal level dominated by high-prevalence conditions.
While our results argue clearly for the importance of considering co-morbidity when estimating disease burden, the best way to do this is not obvious. The approach we took here has the advantage of con-sidering co-morbidities in their true distribution in the population rather than requiring hypothetical scen-arios to be generated that might or might not ad-equately characterize the actual distribution of complex co-morbidities in the population. However, methods also exist to allow the effects of individual conditions to be estimated using expert ratings of hy-pothetical patient scenarios that include information about complex profiles of co-morbidity (Jasso, 2006 ; Saarni et al. 2007). Indeed, the actual distributions of co-morbidity found in community surveys like the WMH surveys could be used to generate these vignettes so as to guarantee that they represent the distribution and range of patterns in the population. As many health policy researchers favor condition severity ratings made by experts rather than the ratings made by respondents in community surveys for a variety of other reasons (Insinga & Fryback, 2003 ; Marquie et al. 2003 ; Ormel et al. 2008 ; Schnadig et al. 2008), it might be that the best approach would be to build information about co-morbidity into conven-tional expert rating scenarios. However, valuations of the sort presented here based on community samples also would seem to have value in representing the perceptions of actual people with real conditions in the population. It remains a challenge for the field to develop a way of integrating data of these different sorts.
Acknowledgements
The analysis for this paper was carried out in con-junction with the WHO WMH Survey Initiative. We thank the WMH staff for assistance with instru-mentation, fieldwork and data analysis. These ac-tivities were supported by the United States National Institute of Mental Health (R01MH070884), the Mental Health Burden Study (contract number HHSN271200700030C), the John D. and Catherine T. MacArthur Foundation, the Pfizer Foundation, the US Public Health Service (R13-MH066849, R01-MH069864 and R01 DA016558), the Fogarty Inter-national Center (FIRCA R03-TW006481), the Pan American Health Organization, the Eli Lilly & Company Foundation, Ortho-McNeil Pharmaceutical, Inc., GlaxoSmithKline, Bristol-Myers Squibb and
Shire. A complete list of WMH publications can be found at http://www.hcp.med.harvard.edu/wmh/.
The Chinese WMH Survey Initiative is supported by the Pfizer Foundation. The Colombian National Study of Mental Health (NSMH) is supported by the Ministry of Social Protection. The European Study of the Epidemiology of Mental Disorders (ESEMeD) project is funded by the European Commission (contracts QLG5-1999-01042 ; SANCO 2004123), the Piedmont Region (Italy), Fondo de Investigacio´n Sanitaria, Instituto de Salud Carlos III, Spain (FIS 00/ 0028), Ministerio de Ciencia y Tecnologı´a, Spain (SAF 2000-158-CE), Departament de Salut, Generalitat de Catalunya, Spain, Instituto de Salud Carlos III (CIBER CB06/02/0046, RETICS RD06/0011 REM-TAP), and other local agencies and by an unrestricted educational grant from GlaxoSmithKline. The Israel National Health Survey is funded by the Ministry of Health with support from the Israel National Insti-tute for Health Policy and Health Services Research and the National Insurance Institute of Israel. The WMH Japan (WMHJ) Survey is supported by the Grant for Research on Psychiatric and Neurological Diseases and Mental Health (H13-SHOGAI-023, H14-TOKUBETSU-026, H16-KOKORO-013) from the Japan Ministry of Health, Labor and Welfare. The Lebanese National Mental Health Survey (Lebanese Evaluation of the Burden of Ailments and Needs of the Nation ; LEBANON) is supported by the Lebanese Ministry of Public Health, the WHO (Lebanon), Fogarty Inter-national, Act for Lebanon, anonymous private do-nations to the Institute for Development, Research, Advocacy and Applied Care (IDRAAC), Lebanon, and unrestricted grants from Janssen Cilag, Eli Lilly, GlaxoSmithKline, Roche and Novartis. The Mexican National Co-morbidity Survey (MNCS) is supported by The National Institute of Psychiatry Ramon de la Fuente (INPRFMDIES 4280) and by the National Council on Science and Technology (CONACyT-G30544-H), with supplemental support from the Pan-American Health Organization (PAHO). The Nigerian Survey of Mental Health and Wellbeing (NSMHW) is supported by the WHO (Geneva), the WHO (Nigeria) and the Federal Ministry of Health, Abuja, Nigeria. The Ukraine Comorbid Mental Disorders during Periods of Social Disruption (CMDPSD) study is funded by the US National Institute of Mental Health (RO1-MH61905). The US National Co-morbidity Survey Replication (NCS-R) is supported by the National Institute of Mental Health (NIMH ; U01-MH60220) with supplemental support from the National Institute of Drug Abuse (NIDA), the Substance Abuse and Mental Health Services Administration (SAMHSA), the Robert Wood Johnson Foundation (RWJF ; grant 044708) and the John W. Alden Trust.
884 J. Alonso et al.
https:/www.cambridge.org/core/terms. https://doi.org/10.1017/S0033291710001212
Declaration of Interest
R.C.K. has been a consultant for GlaxoSmithKline Inc., Kaiser Permanente, Pfizer Inc., Sanofi-Aventis, Shire Pharmaceuticals and Wyeth-Ayerst ; has served on advisory boards for Eli Lilly & Company and Wyeth-Ayerst ; and has had research support for his epi-demiological studies from Bristol-Myers Squibb, Eli Lilly & Company, GlaxoSmithKline, Johnson & Johnson Pharmaceuticals, Ortho-McNeil Pharma-ceuticals Inc., Pfizer Inc. and Sanofi-Aventis.
References
Andlin-Sobocki P, Jonsson B, Wittchen HU, Olesen J (2005). Cost of disorders of the brain in Europe. European Journal of Neurology 12 (Suppl. 1), 1–27.
Baker M, Stabile M, Deri C(2001). What do self-reported, objective, measures of health measure ? Journal of Human Resources 39, 1067–1093.
Breiman L(2001). Random forests. Machine Learning 45, 32. Breiman L(2009). Statistical modeling : the two cultures.
Statistical Science 16, 199–215.
Breiman L, Friedman JH, Olshen RA, Stone CJ(1984). Classification and Regression Trees. Chapman & Hall : New York, NY.
Buntin MB, Zaslavsky AM(2004). Too much ado about two-part models and transformation ? Comparing methods of modeling Medicare expenditures. Journal of Health Economics 23, 525–542.
Center for Disease Control and Prevention(2004). Health, United States, 2004. National Center for Health Statistics : Atlanta, GA.
Craig BM, Busschbach JJ, Salomon JA(2009). Modeling ranking, time trade-off, and visual analog scale values for EQ-5D health states : a review and comparison of methods. Medical Care 47, 634–641.
Donohue JM, Pincus HA(2007). Reducing the societal burden of depression : a review of economic costs, quality of care and effects of treatment. Pharmacoeconomics 25, 7–24. Duan N, Manning WG, Morris CN, Newhouse JP(1984).
Choosing between the sample-selection model and the multi-part model. Journal of Business and Economic Statistics 2, 289.
Fortin M, Soubhi H, Hudon C, Bayliss EA, van den Akker M(2007). Multimorbidity’s many challenges. British Medical Journal 334, 1016–1017.
Friedman JH(1991). Multivariate adaptive regression splines (with discussion). Annals of Statistics 19, 1.
Gabilondo A, Rojas-Farreras S, Vilagut G, Haro JM, Fernandez A, Pinto-Meza A, Alonso J(2010).
Epidemiology of major depressive episode in a southern European country : results from the ESEMeD-Spain project. Journal of Affective Disorders 120, 76–85.
Gudex C, Dolan P, Kind P, Williams A(1996). Health state valuations from the general public using the visual analogue scale. Quality of Life Research 5, 521–531. Haro JM, Arbabzadeh-Bouchez S, Brugha TS, de
Girolamo G, Guyer ME, Jin R, Lepine JP, Mazzi F,
Reneses B, Vilagut G, Sampson NA, Kessler RC(2006). Concordance of the Composite International Diagnostic Interview version 3.0 (CIDI 3.0) with standardized clinical assessments in the WHO World Mental Health surveys. International Journal of Methods in Psychiatric Research 15, 167–180.
Heeringa SG, Wells JE, Hubbard F, Mneimneh Z, Chiu WT, Sampson N, Berglund PA(2008). Sample designs and sampling procedures. In The WHO World Mental Health Surveys : Global Perspectives on the Epidemiology of Mental Disorders (ed. R. C. Kessler and T. B. U¨ stu¨n), pp. 14–32. Cambridge University Press : New York, NY.
Hosmer DW, Lemeshow S(2001). Applied Logistic Regression, 2nd edn. Wiley & Sons : New York, NY.
Insinga RP, Fryback DG(2003). Understanding differences between self-ratings and population ratings for health in the EuroQOL. Quality of Life Research 12, 611–619. Jacoby A, Baker GA(2008). Quality-of-life trajectories in
epilepsy : a review of the literature. Epilepsy Behavior 12, 557–571.
Jasso G(2006). Factorial survey methods for studying beliefs and judgments. Sociological Methods and Research 34, 334–423.
Kessler RC, U¨ stu¨n TB (2004). The World Mental Health (WMH) Survey Initiative Version of the World Health Organization (WHO) Composite International Diagnostic Interview (CIDI). International Journal of Methods in Psychiatric Research 13, 93–121.
Kessler RC, U¨ stu¨n TB (eds) (2008). The WHO World Mental Health Surveys : Global Perspectives on the Epidemiology of Mental Disorders. Cambridge University Press : New York, NY.
Knight M, Stewart-Brown S, Fletcher L(2001). Estimating health needs : the impact of a checklist of conditions and quality of life measurement on health information derived from community surveys. Journal of Public Health in Medicine 23, 179–186.
Krabbe PF(2008). Thurstone scaling as a measurement method to quantify subjective health outcomes. Medical Care 46, 357–365.
Krabbe PF, Salomon JA, Murray CJ(2007). Quantification of health states with rank-based nonmetric multidimensional scaling. Medical Decision Making 27, 395–405.
Krabbe PF, Stalmeier PF, Lamers LM, Busschbach JJ(2006). Testing the interval-level measurement property of multi-item visual analogue scales. Quality of Life Research 15, 1651–1661.
Kraemer HC, Kazdin AE, Offord DR, Kessler RC, Jensen PS, Kupfer DJ(1997). Coming to terms with the terms of risk. Archives of General Psychiatry 54, 337–343.
Lopez AD, Mathers CD(2007). Inequalities in health status : findings from the 2001 Global Burden of Disease study. In The Global Forum Update on Research for Health, vol. 4 (ed. S. Matlin), pp. 163–175. Pro-Brook Publishing Limited : London.
Macran S, Kind P(2001). ‘ Death ’ and the valuation of health-related quality of life. Medical Care 39, 217–227. Maddigan SL, Feeny DH, Johnson JA(2005). Health-related
comorbidities in a Canadian National Population Health Survey. Quality of Life Research 14, 1311–1320.
Manning SC(1998). Configuring compliance : a professional fit. Journal of American Health Information Management Association 69, 36–38.
Manning WG, Mullahy J(2001). Estimating log models : to transform or not to transform ? Journal of Health Economics 20, 461–494.
Marquie L, Raufaste E, Lauque D, Marine C, Ecoiffier M, Sorum P(2003). Pain rating by patients and physicians : evidence of systematic pain miscalibration. Pain 102, 289–296.
McCullagh P, Nelder JA(1989). Generalized Linear Models, 2nd edn. Chapman & Hall : London.
Moussavi S, Chatterji S, Verdes E, Tandon A, Patel V, Ustun B(2007). Depression, chronic diseases, and decrements in health : results from the World Health Surveys. Lancet 370, 851–858.
Mullahy J(1998). Much ado about two : reconsidering retransformation and the two-part model in health econometrics. Journal of Health Economics 17, 247–281. Murray CJ, Lopez AD(1996). Evidence-based health
policy – lessons from the Global Burden of Disease Study. Science 274, 740–743.
Murray CJL, Lopez AD, Mathers CD, Stein C(2001). The Global Burden of Disease 2000 Project : Aims, Methods and Data Sources. World Health Organization : Geneva.
Ohayon MM(2002). Epidemiology of insomnia : what we know and what we still need to learn. Sleep Medicine Review 6, 97–111.
Ormel J, Petukhova M, Chatterji S, Aguilar-Gaxiola S, Alonso J, Angermeyer MC, Bromet EJ, Burger H, Demyttenaere K, de Girolamo G, Haro JM, Hwang I, Karam E, Kawakami N, Lepine JP, Medina-Mora ME, Posada-Villa J, Sampson N, Scott K, Ustun TB,
Von Korff M, Williams DR, Zhang M, Kessler RC(2008). Disability and treatment of specific mental and physical disorders across the world. British Journal of Psychiatry 192, 368–375.
Parkin D, Devlin N(2006). Is there a case for using visual analogue scale valuations in cost–utility analysis ? Health Economics 15, 653–664.
Pennell B-E, Mneimneh Z, Bowers A, Chardoul S, Wells JE, Viana MC, Dinkelmann K, Gebler N, Florescu S, He Y, Huang Y, Tomov T, Vilagut G(2008). Implementation of the World Mental Health Surveys. In The WHO World Mental Health Surveys : Global Perspectives on the Epidemiology of Mental Disorders (ed. R. C. Kessler and T. B. U¨ stu¨n), pp. 33–57. Cambridge University Press : New York, NY.
Roth T, Jaeger S, Jin R, Kalsekar A, Stang PE, Kessler RC (2006). Sleep problems, comorbid mental disorders, and role functioning in the National Comorbidity Survey Replication. Biological Psychiatry 60, 1364–1371.
Saarni SI, Suvisaari J, Sintonen H, Pirkola S, Koskinen S, Aromaa A, Lonnqvist J(2007). Impact of psychiatric disorders on health-related quality of life : general population survey. British Journal of Psychiatry 190, 326–332.
Salomon JA, Murray CJ(2004). A multi-method approach to measuring health-state valuations. Health Economics 13, 281–290.
Salomon JA, Tandon A, Murray CJ(2004). Comparability of self rated health : cross sectional multi-country survey using anchoring vignettes. British Medical Journal 328, 258.
Schmidt L, Room R(1999). Cross-cultural applicability in international classifications and research on alcohol dependence. Journal of Studies on Alcohol 60, 448–462.
Schnadig ID, Fromme EK, Loprinzi CL, Sloan JA, Mori M, Li H, Beer TM(2008). Patient–physician disagreement regarding performance status is associated with worse survivorship in patients with advanced cancer. Cancer 113, 2205–2214.
Schoenborn CA, Adams PF, Schiller JS(2003). Summary health statistics for the U.S. population : National Health Interview Survey, 2000. Vital Health and Statistics 10, 1–83.
Singer MA, Hopman WM, MacKenzie TA(1999). Physical functioning and mental health in patients with chronic medical conditions. Quality of Life Research 8, 687–691.
Stiggelbout AM, de Vogel-Voogt E(2008). Health state utilities : a framework for studying the gap between the imagined and the real. Value Health 11, 76–87.
Tandon A, Murray CJL, Salomon JA, King G(2002). Statistical Models for Enhancing Cross-Population Comparability. Global Programme on Evidence for Health Policy Discussion Paper no. 42. World Health Organization : Geneva.
Taubman SL, Robins JM, Mittleman MA, Hernan MA (2009). Intervening on risk factors for coronary heart disease : an application of the parametric g-formula. International Journal of Epidemiology 38, 1599–1611. Verbrugge LM, Lepkowski JM, Imanaka Y(1989).
Comorbidity and its impact on disability. Milbank Quarterly 67, 450–484.
Wang PS, Simon GE, Kessler RC(2008). Making the business case for enhanced depression care : the National Institute of Mental Health-Harvard Work Outcomes Research and Cost-effectiveness Study. Journal of Occupational and Environmental Medicine 50, 468–475.
Whiteford H(2000). Unmet need : a challenge for governments. In Unmet Need in Psychiatry : Problems, Resources, Responses (ed. G. Andrews and S. Henderson), pp. 8–10. Cambridge University Press : Cambridge, UK.
WHO(2004). The Global Burden of Disease : 2004 Update. World Health Organization : Geneva.
Wolter KM(1985). Introduction to Variance Estimation. Springer-Verlag : New York, NY.
Young JG, Hernan MA, Picciotto S, Robins JM(2010). Relation between three classes of structural models for the effect of a time-varying exposure on survival. Lifetime Data Analysis 16, 71–84.
886 J. Alonso et al.
https:/www.cambridge.org/core/terms. https://doi.org/10.1017/S0033291710001212