MONITORING BONE DENSITY FROM PATIENTS UNDERGOING
TOTAL HIP ARTHROPLASTY USING COMPUTED TOMOGRAPHY
AND 3D MODELING TECHNIQUES
Paolo Gargiulo
1,2, Benedikt Helgasson
3, Benedikt Magnússon
1,2,, Throstur Pétursson
1,2, Gianluca Mario
Izzo
2,4, Gígja Magnúsdóttir
5, Grétar Halldórsson
5, Jan Tribel
6, and Halldor Jónsson Jr.
6,71Department of Science and Development, Landspitali University Hospital
2Biomedical Engineering Department,Reykjavik University
3Institute for Biomechanics, ETH-Zürich, Switzerland
4 Department of Biomedical Engineering, University Federico II of Naples, Italy
5Rehabilitation Clinic Grensás, Landspitali University Hospital
6Orthopaedic Clinic, Landspitali University Hospital
7Medical Faculty, Iceland University, Reykjavik, Iceland
[email protected]
Abstract: A clinical trial was carried out including 36
volunteer patients which underwent unilateral THA sur-gery (50% cemented, 50% uncemented). Changes in bone mineral density after the operation are monitored to as-sess the outcome of the procedure.
We found age and gender only to be a modest predictor of bone quality for our THA patients and since poor bone quality is known to be associated with a risk of revision surgery it needs to receive a higher weight in our pre-clinical assessment when choosing between cemented and uncemented THA.
Keywords: Total hip arthroplasty—Computed tomography 3D models—Bone mineral density—Cemented and uncemented implants.
Introduction
Total hip arthroplasty (THA) is performed with or with-out the use of bone cement. The benefit of the cemented procedure is a faster achievement of implant stability compared to an uncemented procedure where the primary implant stability is secured by geometrical interlocking, press fit forces and friction between bone and implant, whilst the secondary stability is additionally secured by bone ingrowths into the surface texture of the femoral component. In the first years post-operatively, uncemented stems are more frequently revised than ce-mented stems due to periprosthetic fracture. Managing these fractures may create a real challenge for the sur-geons because of the poor quality of the surrounding bone [1]. On the other hand the revision surgery for uncemented implants has a higher success rate and gener-ally results in fewer complications than revision surgeries for cemented implants [2]. Presently clinicians are faced with the lack of reliable guidelines when choosing be-tween cemented or uncemented procedures.
At our clinical center orthopedic surgeons chose between the cemented and uncemented THA based on age, sex and general health conditions, however, quantitative preopera-tive measurements of bone quality have not yet been included in current clinical guidelines. This means that in
general patients over 65 years receive cemented implants while the younger and healthy receive uncemented pros-thesis. With the aim of improving our healthcare, reduc-ing future costs and developreduc-ing more thorough clinical guidelines to aid decision making, we have launched a clinical trial at our center where patients undergoing THA are systematically monitored for this purpose [3]. In the present paper we report preliminary results from this project. The specific aims of this part of the study are:
To quantify pre operative femoral bone quality. To compare bone mineral density at two
differ-ent time points for patidiffer-ents already enrolled in the trial.
Methods
Data were obtained from 36 voluntary patients (20 fe-males and 16 fe-males) undergoing THA surgery for the first time, 18 patients received a cemented - and 18 received a cementless implant. The average age at the moment of surgery is 56 for the males and 62 for the females. The patients are scanned with a 64-slices spiral CT Philips
Brilliance three times in one year: before, immediately
after surgery and finally at 52 weeks post-surgery. The CT scanning region starts from the iliac crest and ends at the middle of the femur; slices thickness is 1mm, slice increment is 0.5mm and tube voltage was set to 120KVp. This CT dataset allows a precise 3D reconstruction of the regions of interest.
Commercial software (MIMICS www.materialise.com) was used to segment each femur from CT data. The seg-mentation was performed on the pre-surgery and post-op CT datasets and was mainly based on opportune thresh-olds of the CT-HU (Hounsfield Unit). Based on our pre-vious work [4], HU interval for cortical bone was set to 601-1988 HU while the trabecular bone set to 250-600 HU. The CT scan device was pre-calibrated with QUA-SAR phantom before the pre-operative scans and 1 year later, before the post-op scans using the same CT protocol adopted for all patients A HU to BMD relationship was based on a quadratic function, BMD [mg/cm³] = a × HU2
+ b × HU + c, where a, b, c are calibration coefficients, which were computed from the phantom CT data. The correlation coefficient for this calibration was R2 ≈ 0.99
(Fig.1).
Figure 1: Interpolation of the linear regression curves which is used to convert HU values to BMD.
To estimate the pre-op bone quality, BMD was calculated from the proximal femur volume in the region between femur head and lesser trochanter, along the intertrochan-teric line (Fig 2-A). The comparison between pre-op and 1 year post-op BMD cannot be done using the same vol-ume of interest as shown in figure 2-A due to metal arti-facts. Thus 2 bone subvolumes were select from the cor-tical within middle and proximal femur which HU values are minimally influenced by the metal implant artifacts (Fig 2-B).
Figure 2: A) The region of interest where the pre-op BMD is computed. B) Regions of interest where BMD pre-op vs. 1 year post-op are compared.
The BMD was measured on the operated femur and on contralateral side (healthy) on the cortical bone from 2 regions in the lesser trochanter area (ROI) minimally influenced by metal artefacts: 2 (indicated with a and b in Fig. 2-B). BMD on these areas is calculated 24 hours and 1 year post surgery.
Results
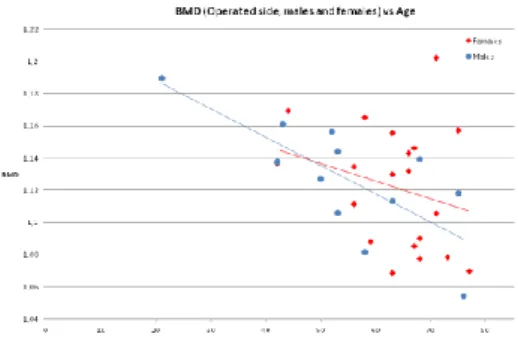
As expected BMD was generally found to decrease with age but only with a modest negative correlation but this trend was more prominent in men than women (figure 3). The preliminary results from the bone density assessment 1 year post-op are presented in table 1. The BMD varia-tion is positive if the density increases otherwise negative. The decrease in BMD on the treated side was found to range of 1-6% measured at the lesser trochanter. On the contralateral side the BMD remained basically unchanged except in one patient.
Figure 3: Pre-op bone mineral density (mg/cm3) vs. age in the
region of interest displayed in figure 2A: Comparison of female and male patients.
Discussion
Our preliminary results indicate the BMD in THA patient in the study is only modestly correlated with age and gender i.e. there is a significant overlap in bone density between age groups and between male and female. We conclude that bone quality assessment will have to be given higher weight in our future treatment protocol for THA patients.
Acknowledgement
The authors would like to thank Landspítali University Hospital research fund for providing financial support to this project.
Bibliography
[1] Venesmaa, P. K. et. al: Monitoring of Periprosthetic BMD After Uncemented Total Hip Arthroplasty with Dual-Energy X-Ray Absorptiometry—a 3-Year Fol-low-Up Study. J Bone Miner Res, 16: 1056–1061, 2001.
[2] CA Engh, AH Glassman, WL Griffin, JG Mayer Results of cementless revision for failed cemented to-tal hip arthroplasty Clin Orthop, 235, p. 91,1988 [3] Gargiulo, P et. al: Assessment of Total Hip
Arthroplasty by Means of Computed Tomography 3D Models and Fracture Risk Evaluation. Artificial Or-gans.(April 2013).
[4] Gargiulo, P et. al: Monitoring of muscle and bone recovery in spinal cord injury patients treated with electrical stimulation... Artificial Organs. (35(3):275– 281, 2011).
Table 1: BMD at different time point and relative variation Patient (Age/gender/implant) OPERATED SIDE 24h Post-Op A 24h Post-Op B 1y Post-Op A 1y Post-Op B 1y/24h A 1y/24h B 21/M/Uncem 52/M/Uncem 56/F/Uncem 56/F/Uncem 58/M/Cem 63/F/Uncem 63/M/Uncem 67/F/Cem 68/F/Uncem 77/F/Cem 1.19 1.30 1.24 1.23 1.24 1.16 1.26 1.24 1.24 1.19 1.34 1.38 1.41 1.40 1.39 1.32 1.38 1.41 1.32 1.34 1.18 1.22 1.24 1.21 1.16 1.16 1.27 1.27 1.21 1.20 1.30 1.35 1.35 1.32 1.32 1.31 1.33 1.34 1.26 1.32 -1% -5% 0% -1% -6% 0% 1% 3% -2% 1% -3% -2% -4% -6% -5% -1% -4% -5% -5% -1% HEALTHY SIDE 21/M/Uncem 52/M/Uncem 56/F/Uncem 56/F/Uncem 58/M/Cem 63/F/Uncem 63/M/Uncem 67/F/Cem 68/F/Uncem 77/F/Cem 1.22 1.26 1.22 1.23 1.22 1.12 1.21 1.16 1.15 1.12 1.36 1.39 1.39 1.36 1.34 1.39 1.35 1.36 1.27 1.28 1.22 1.26 1.23 1.24 1.24 1.12 1.23 1.18 1.15 1.12 1.38 1.39 1.38 1.34 1.36 1.31 1.35 1.36 1.28 1.28 0% 0% 1% 1% 2% -1% 1% 2% 0% 0% 2% 0% -1% -2% 1% -5% 0% 0% 1% 0%
Skin impedance measurements support ex-vivo penetration studies for topical
applied drugs
Simon Schwingenschuh
1, Martin Hajnsek
1, Hermann Scharfetter
2, Ørjan G. Martinsen
3, Katrin Tiffner
1,
Christian Dragatin
1, Reingard Raml
1, Anton Mautner
1, Manfred Bodenlenz
1, Frank Sinner
1,41
HEALTH - Institute of Biomedicine and Health Sciences,
JOANNEUM RESEARCH Forschungsgesellschaft mbH Graz, Austria
2Graz University of Technology, Institute of Medical Engineering, Graz, Austria
3University of Oslo, Department of Physics; P.O. Box 1048 Blindern, 0316 Oslo, Norway
4Department of Internal Medicine, Division of Diabetes and Metabolism, Medical University of Graz,
Graz, Austria
[email protected]
Abstract: Open flow microperfusion can be used to assess
the amount of a topically applied drug directly in the skin. Large intra- and interindividual differences in skin proper-ties can lead to biased results. In this study we propose a method based on skin impedance measurements to assess the properties of the skin barrier and thus compensate for vary-ing permeability characteristics.
Keywords: impedance, open flow microperfusion, skin
penetration, topical drugs
Introduction
Open flow microperfusion (OFM) is a method for contin-uous sampling of interstitial fluid (ISF) from various tissues of animals and humans. Subsequent analysis of the OFM samples delivers time resolved profiles of many analytes covering a wide range of molecule sizes and chemical properties (e.g. hydrophilicity, lipophilicity). OFM is based on minimally invasive probes with an ex-change area featuring macroscopic openings. During the sampling process the probes are perfused with a carrier fluid which mixes with the interstitial fluid of the target tissue. The exchange of carrier fluid and tissue fluid takes place at a certain equilibrium level that allows to measure specific substances present in the tissue by downstream analysis in the bioanalytical lab. OFM is used to investi-gate drug penetration and drug efficacy in skin in vivo: a probe is placed in the skin, and the cream containing the active ingredient is applied to the skin site directly above the probe. However, there are large individual differences in skin conditions depending on the location of the test site (e.g. forearm, abdomen thigh) and is also dependant on the subject itself (e.g. skin type, environmental condi-tions). To correct for these differences that will affect the variability of OFM derived drug profiles a large number of skin donors is necessary to reliably test topical drug penetration. In this study we aimed to investigate whether skin impedance measurements can be used to predict at least some of the skin’s permeability characteristics.
Methods
Our study is based on the hypothesis that variations in penetrating drug amounts during dermal OFM sampling can be correlated with variations of the passive electrical parameters of the skin. Fresh human skin from plastic surgery was mounted on an ex-vivo test unit (EVA-CELL, Joanneum Research, Graz) to maintain skin vitali-ty and temperature. Skin impedance of each donor skin flap was assessed by using paediatric ECG electrodes in a 3-electrode setting. The electrodes were attached in an equilateral triangle with a side length of 5 cm. The dis-tance between the electrodes was chosen to be 2.5 cm with an electrode diameter of also 2.5 cm. This symmet-rical setup allowed moving the three electrodes types (reference, counter and working electrode) simply by varying reconnection of the electrodes to the potentiostat. Impedance spectroscopy and single frequency measure-ments were used to assess stratum corneum impedance. Clobetasol-17-proprionate (CP17) was applied topically on the skin flaps characterized with the impedance meas-urements and the penetration of the drug into the dermis was continuously profiled for 24 h by using dermal OFM sampling.
Fig.1: Intradermal concentrations of CP17 in 5 donor skin flaps assessed by continuous sampling using dOFM probes.
Results
To study at what frequencies the skin layers responsible for the barrier function for skin penetration are assessed impedance spectra were recorded from 1000 to 1 Hz with 5 data points per frequency decade. We found that low frequencies below 100 Hz showed a significant correla-tion to skin penetracorrela-tion properties. The sensitivity of the measurement increases with decreasing frequency which is in good agreement with data from the literature [1]. At higher frequencies also deeper parts of the skin and the subcutaneous tissue contribute to the impedance meas-ured, therefore lower frequencies, which assess only the top layers of the skin, or the stratum corneum only in an optimal case, are more sensitive to penetration properties of the skin.
Fig. 2: at low frequencies a significant higher sensitivity to skin penetration properties is observed.
To investigate the relationship between skin impedance and penetrated quantities of CP17, the impedance was plotted against the area under the curve (AUC) of the CP17 concen-tration over 24 h, a standard measure used in pharmacokinet-ics. Regression analysis revealed a clear relationship between impedance and the penetrated CP17 amount.
Fig. 3: The electrical reactance shows good correlation with the measured AUC values of CP17 profiles (n=5).
The correlation of skin impedance and drug penetration properties of the skin can be used to normalize dermal OFM AUC values thus eliminating or minimizing the influence of intra- and interindividual differences in skin properties.
Fig. 3: skin properties variations leading to impedance measurements (n=5).
Discussion
Our results support the hypothesis that the stratum corneum is the main source of variability when testing topical drug penetration into human skin ex-vivo. We conclude that skin impedance measurements can be help-ful to characterize skin barrier properties and thus support future ex-vivo and in-vivo skin penetration studies using dOFM sampling. Skin impedance measurements can be used to screen skin properties before OFM studies were performed. Restricting the accepted penetration proper-ties of study subjects to the range representing the population average could significantly reduce the num-ber of subjects needed and thus reduce study costs.
Acknowledgement
The authors acknowledge the Styrian government for financial support via the HTI initiative.
Bibliography
[1] Ørjan G. Martinsen, Sverre Grimnes, Erlend Haug: Measuring depth depends on frequency in electrical skin impedance measurements. Skin Research and
RAPID PACING INDUCES FRACTIONATION OF THE ACTIVATION
WAVEFRONT INTO MULTIPLE WAVELETS
Hofer E
1, Sanchez-Quintana D
2, Arnold R
11
Institute of Biophysics, Medical University Graz, Austria
2
Depart. de Anatomia y Biologia Cellular, Universidad de Extremadura, Badajoz, Spain
[email protected]
Abstract: Atrial flutter and atrial fibrillation can be caused
by heterogeneities in membrane function as well as in mac-ro- and microstructure. Rapid pacing techniques combined with potential recording techniques can help to localize critical arrhythmogenic substrates within the atrium. This work describes the heterogeneity of local conduction in the cavotricuspid isthmus (CTI) during electrophysiological experiments with Rabbit hearts. By means of rapid pacing techniques it can be shown, that local blockade of excitation spread can be predicted using appropriate pacing protocols. The pre-block behaviour is characterized by a substantial increase in the degree of fractionation and in a decrease of amplitude in extracellular potentials.
Keywords: atrial flutter, rapid pacing, complex
fraction-ated atrial electrogram, electrophysiological experiment
Introduction
Atrial fibrillation and atrial flutter is often preceded by tachycardia. Hence rapid pacing can be used to study the behaviour of cardiac activation before local or global block of excitation spread arises. Increased pacing rate leads to changes in action potential duration and alters the excitation spread. The smooth wave front of depolariza-tion then may break into multiple wavelets with small delays to each other and following complex pathways. These effects are caused by discontinuities in the macro- and microstructure of cardiac tissue. We postulate that during rapid pacing, these effects would lead to increased signal fractionation and spatial heterogeneity, specifically when pacing intervals come close to the absolute refracto-ry period. In electrophysiological experiments with right atria from Rabbits we studied the region of the cavo-tricuspid isthmus (CTI). Clinical electrophysiologists see this region as one of the targets for catheter ablation to cure atrial arrhythmias [1]. Specific pacing protocols were applied to induce arrhythmogenic conditions. Spatial heterogeneity and beat-to-beat changes of local conduc-tion were analyzed by means of multisite recording tech-niques of extracellular potentials with ultra-high spatial and temporal resolution [2].
Methods
Electrophysiological experiments were carried out in accordance to the national ethic guidelines. Right atrial specimen were dissected from isolated Rabbit hearts and placed in a tissue bath with oxygenated Tyrode’s solution at 36°C. Current pulses of 1 ms duration and twice the
threshold level were applied by means of a 50 µm thick tungsten wire at given sites of the tissue. A ramp-like pacing protocol was executed i.e. subsequent stimuli were applied with decreased pacing cycle length (PCL) com-pared to the previous one until conduction block occurred. Multisite recordings of extracellular signals e(t) of the
last 6 beats before block were used to analyze the quality of local conduction of the depolarization wave. Ampli-tude of the signals as well as the fractionation index (FI), i.e. the number of negative deflections of de(t)/dt [3]
were used to describe the increasingly hampered excita-tion process. At least one of the four-electrode-sensors was placed at sites were muscle bundles merge or branch, i.e. at sites of structural discontinuities.
Results
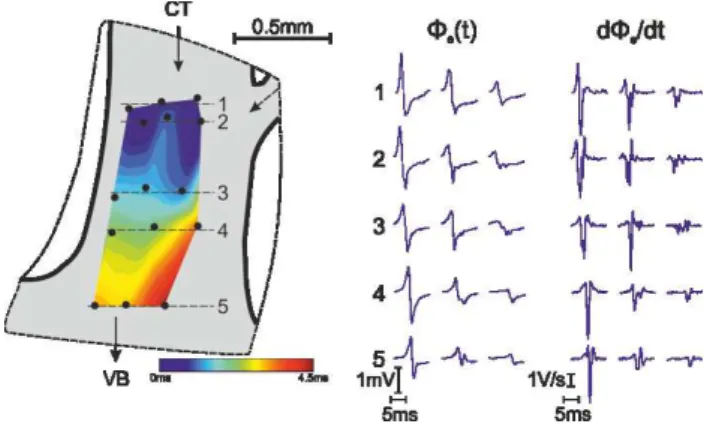
Figure 1: Spatial heterogeneity of depolarization signals within one PectM. Recordings on the right in line 2 and 3 indicate incoming wavelet from the top right branch.
Along the excitation pathway in the CTI, groups of pecti-nate muscles (PectM) connect the Crista Terminalis (CT) with the vestibule (VB). PectMs branch into two or three fibres and merge again before reaching the VB. At these sites complex signal waveforms with multiple deflections in de(t)/dt can be expected frequently, specifically
dur-ing rapid pacdur-ing close to the block interval. An example of spatial heterogeneity of local signals is depicted in Fig. 1. A map of signals in the lower part of a PectM is shown. Note the small amplitudes and the high degree of fractionation of the signals taken at the right edge of the mapping area. This indicates an electrically uncoupled wavelet entering from the small merging fibre from top right.
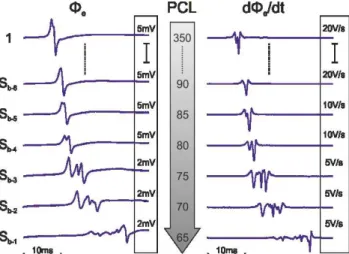
Diversity of depolarization signals is not only present in terms of spatial heterogeneity but also at one given recording site in response to subsequent pacing stimuli when PCL decreases. During control values of PCL e(t) and de(t)/dt
are quite uniform showing a large amplitude and just minor distortion visible as a small secondary deflection in
de(t)/dt (see Fig. 2). During the last 6 stimuli before block
arises amplitude diminishes and the fractionation index FI increases progressively.
Figure 2: Progressive change of e(t) and de(t)/dt with
PCL approaching absolute refractory period. Ramp like pacing protocol was used.
We analysed a large number of recordings taken in CT (239), PectM (1037) and VB (264) from 15 hearts. The distribution of FI within each class of tissue differs mark-edly (see Tab. 1) due to different histological structure. CT represents the most complex microstructure and pathways for the cardiac impulse entering from the sinus node area into the CT resulting in the lowest portion of uniform signals with FI=1. In the class of PectM signals the dominant portion of recordings is uniform. In the VB we found a higher number of uniform signals compared to CT but also a much larger portion of large FI signals (FI=8-10). This might be linked to the fact, that on one hand very compact strands of PectM fibres incorporate smoothly in the VB and on the other hand signals are colliding there with crossing fibres.
Table 1: Fractionation Index distribution obtained in CT, PectM and VB (given in %).
FI CT PectM VB 1 20,51 49,03 46,89 2 26,50 26,56 17,84 3 17,95 11,19 14,11 4 15,81 5,45 5,39 5 8,12 3,60 5,81 6-10 11,11 4,18 9,96
Discussion
Uniform conduction with biphasic extracellular signals along cable like strands of cardiac fibres can be predicted by computer simulation. Within a network of such strands
at least piecewise continuous conduction can be expected interrupted just at branching and merging sites represent-ing macroscopic discontinuities. At microscopic scale layers of connective tissue are oriented parallel to the muscle fibres and form obstacles changing the signal waveform with directional effects [4]. By such micro-structures the depolarization wave front breaks up into wavelets with delays in the range from 0.5 to 10 ms. It should be emphasized that this type of fractionation is different to those seen in clinical human atrial electro-grams with multiple deflections in the range of 50-100 ms. Fractionations like demonstrated here with ultra-high resolution systems (50 µm inter-electrode distances) would not be detectable with relatively coarse recording systems (mm range) like used in clinical electrophysiolo-gy.
At a microscopic size scale the CTI can be seen as a net-work of piecewise cable-like muscle structures producing spatial heterogeneous signals waveforms. In addition to this macro- and microstructure related heterogeneity, temporal parameters like rapid pacing can change the character of local conduction from uniform towards com-plex and lead to local block and atrial arrhythmia [5]. High resolution recording systems could help to elucidate the mechanisms of complex conduction and improve analyzing techniques to identify zones for ablation.
Acknowledgement
This work has been supported by the Austrian Science Fund (FWF) grant P19993-N15 and grant F3210-N18.
Bibliography
[1] J.A .Cabrera, D. Sanchez-Quintana, J. Farre et al.. “The inferior right atrial isthmus: further architectur-al insights for current and coming ablation technolo-gies”, J. Cardiovasc. Electrophysiol., Vol.16, pp. 402-408, 2005.
[2] E. Hofer, F. Keplinger, T. Thurner, T. Wiener, D. Sanchez-Quintana, V. Climent, Plank G. “A new floating sensor array to detect electric near fields of beating heart preparations”. Biosens Bioelectron., vol. 21(12), pp. 2232-2239, June 2006
[3] T. Wiener, F.O. Campos, G. Plank, E. Hofer. “De-composition of fractionated local electrograms using an analytic signal model based on sigmoid func-tions”, Biomed Tech, pp.1-12, Oct 2012.
[4] F. Campos, T. Wiener, A. Prassl, R. Weber Dos San-tos, D. Sanchez-Quintana, H. Ahammer, G. Plank, E. Hofer. “Electro-Anatomical Characterization of Atri-al Microfibrosis in a HistologicAtri-ally Detailed Com-puter Model”. IEEE Trans Biomed Eng. 2013 Apr 3 (Epub ahead of print).
[5] R. Arnold and E. Hofer, “Pre-block behavior of intra and extracellular parameters during different pacing protocols - preliminary results,” in World Congress
on Medical Physics and Biomedical Engineering May 26-31, 2012, Beijing, China, vol. 39, pp. 395–
VARIATIONS IN PACING DYNAMICS RESULT IN DIFFERENT
HETEROGENEITY AND DEVELOPMENT OF CONDUCTION BLOCK
Arnold R
1, and Hofer E
1,
1
Institute of Biophysics, Medical University of Graz, Austria
[email protected]
Abstract: The complex network of muscle fibers in the right atrium is characterized by structural and functional het-erogeneities. The influence of these heterogeneities on im-pulse conduction determines the activation sequence and increases with increasing heart rates. In this work we show that application of dynamic pacing protocols provokes func-tional heterogeneities and results in ambiguous excitation patterns due to pacing history and structure.
Keywords: right atrium, pacing, heterogeneity, cardiac memory
Introduction
The structural complex muscle network of the cavotricus-pid isthmus (CTI) in the right atrium is seen as potential arrhythmogenic substrate [1]. Structural and functional het-erogeneities influence excitation spread across the CTI es-pecially at elevated heart rates.
Functional heterogeneities, e.g. restitution of action poten-tial duration (APD) and effective refractory period (ERP), are believed to play an important role in genesis of arrhyth-mias [2]. Hence, restitution depends on pacing history and pacing dynamics and results in heterogeneous development of local and global conduction block.
Especially in areas where single muscle fibers branch into multiple fibers the electrical source-sink balance is dis-turbed and the question arises if at elevated heart rates con-duction fails earlier in one branch than in the other one. This could create preferred paths for excitation spread with macroscopic re-entry pathways representing substrates for self-sustaining tachyarrhythmias.
In this work we present a methodical approach to provoke and measure regional heterogeneities of conduction block behavior by means of appropriate pacing protocols.
Methods
Tissue Preparation: A guinea pig (weight ≈ 500 g) was anesthetized with 0.4 ml kg−1 Ketamin and 0.4 ml kg−1 Domidor and sacrificed according to National Ethic Guide-lines. The heart was quickly excised and immersed in cold Tyrode solution (4–8◦C). The right atrium with intact sinus node was dissected, pinned down on a transparent silicone carrier, and placed in a tissue bath with warmed (36.4◦C) and oxygenated (95 % O2, 5 % CO2) Tyrode solution where
it immediately developed autorhythmicity.
Signal recording: Miniaturized flexible sensor arrays com-prising 4 Ag/AgCl electrodes in quadratically arrangement
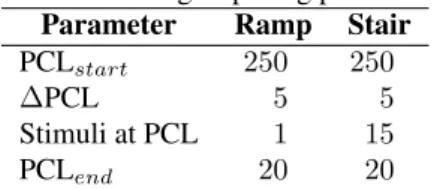
with 50 µm edge length [3] were used to estimate the car-diac near field (CNF). The measurement setup and signal recording technique was described in an earlier work [4]. Pacing: Stimulus pulse trains were generated using a custom-written software application (LabVIEW, National Instruments, Austin, Texas) and a FPGA-board (NI PXI-7813R, National Instruments, Austin, Texas). Timing was specified in terms of pacing cycle length (PCL), i.e. the in-terval in ms between 2 consecutive stimuli [5]. 2 timing characteristics for pacing were used: (i) ramp-like and (ii) stair-like. In ramp-like pacing protocols PCL was reduced after each stimulus, whereas in stair-like pacing protocols PCL was reduced after 15 stimuli at the same PCL. Timing is listed in Tab. 1.
Table 1: Timing of pacing protocols. Parameter Ramp Stair
PCLstart 250 250
∆PCL 5 5
Stimuli at PCL 1 15 PCLend 20 20
Results
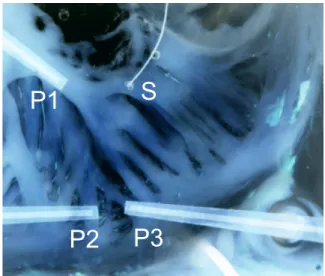
Fig. 1 shows the tissue preparation and the location of stim-ulus and recording sites. Recording site P1 was close to the stimulus site S. Recording sites P2 and P3 were below a branching area on 2 distinct emerging muscle fibers. Dur-ing stair-like pacDur-ing protocol P1, P2, and P3 showed differ-ent developmdiffer-ent of conduction block. In P3 (right muscle branch) conduction failed earliest at a PCL of 70 ms. In P2 (left branch) conduction was sustained until a PCL of 40 ms and in P1 conduction was successful until a PCL of 20 ms (Fig. 2).
In contrast when a ramp-like pacing protocol was applied conduction block occurred at the same PCL (50 ms) at all recording sites (Fig. 3).
Discussion
The preference of specific muscle fibers for excitation spread during high pacing rates favors re-entrant excitation and therefore tachyarrhyhmias. It is known that longitudi-nal and transversal excitation spread exhibit different block behavior [6]. The complex macro- and microstructure of the CTI dictates the direction of excitation spread and therefore it is likely that individual excitation pathways are preferred.
S
P1
P2
P3
Figure 1: Tissue Preparation. S is the stimulus site, P1..3
are the recording sites. P2and P3 are positioned below a
branching area. beat number 500 600 700 P3 P2 P1 S Sb,P3 Sb,P2 Sb,P1
Figure 2: Occurrence and behavior of conduction block for stair-like pacing protocol. Bottom trace (S) is the ap-plied stimulus train, top traces are the evaluated stimulus responses. First conduction block Sb occurs at different
pacing intervals in all 3 recording sites.
beat number 10 20 30 40 50 P1 P2 P3 S Sb Sb Sb
Figure 3: Occurrence and behavior of conduction block for ramp-like pacing protocol. Bottom trace (S) is the ap-plied stimulus train, top traces are the evaluated stimulus responses. First conduction block Sboccurs simultaneously
at all recording sites.
Differences in block behavior between the two types of pac-ing protocols suggest that pacpac-ing history and cardiac mem-ory [7] plays a vital role in impulse propagation. A rapid increase in PCL during a ramp-like pacing protocol appar-ently results in more uniform distributed adaptation dynam-ics.
It has to be noted that the conduction time between stimulus site and recording sites P2 and P3 is quite large (≈ 35 ms). If PCL is in the same range or below this conduction time correlation between stimulus and activation response is dif-ficult. Nevertheless Fig. 2 and Fig. 3 are valid until first occurrence of conduction block.
Acknowledgement
This work was supported by the Austrian Science Fund FWF under grant P19993-N15 and grant F3210-N18.
Bibliography
[1] J. A. Cabrera, D. Sanchez-Quintana, J. Farre, J. M. Rubio, and S. Y. Ho, “The inferior right atrial isth-mus: further architectural insights for current and com-ing ablation technologies.,” J Cardiovasc Electrophys-iol, vol. 16, pp. 402–408, Apr 2005.
[2] R. H. Clayton and P. Taggart, “Regional differences in apd restitution can initiate wavebreak and re-entry in cardiac tissue: a computational study.,” Biomed Eng Online, vol. 4, p. 54, 2005.
[3] E. Hofer, F. Keplinger, T. Thurner, T. Wiener, D. Sanchez-Quintana, V. Climent, and G. Plank, “A new floating sensor array to detect electric near fields of beating heart preparations.,” Biosens Bioelectron, vol. 21, pp. 2232–2239, Jun 2006.
[4] R. Arnold, T. Wiener, D. Sanchez-Quintana, and E. Hofer, “Topology and conduction in the inferior right atrial isthmus measured in rabbit hearts.,” Conf Proc IEEE Eng Med Biol Soc, vol. 2011, pp. 247–250, 2011. [5] R. Arnold and E. Hofer, “Pre-block behavior of intra-and extracellular parameters during different pacing protocols - preliminary results,” in World Congress on Medical Physics and Biomedical Engineering May 26-31, 2012, Beijing, China, vol. 39, pp. 395–397, Springer Berlin Heidelberg, 2012.
[6] M. S. Spach, W. Miller, 3rd, P. C. Dolber, J. M. Kootsey, J. R. Sommer, and C. Mosher, Jr, “The functional role of structural complexities in the propagation of depo-larization in the atrium of the dog. cardiac conduction disturbances due to discontinuities of effective axial re-sistivity.,” Circ Res, vol. 50, pp. 175–191, Feb 1982. [7] S. S. Kalb, H. M. Dobrovolny, E. G. Tolkacheva, S. F.
Idriss, W. Krassowska, and D. J. Gauthier, “The resti-tution portrait: a new method for investigating rate-dependent restitution.,” J Cardiovasc Electrophysiol, vol. 15, pp. 698–709, Jun 2004.
CONTROL OF A MOBILE REHABILITATION ROBOT USING EXACT
FEEDBACK LINEARISATION
Schauer T
11
Control Systems Group, Technische Universität Berlin, Germany
[email protected]
Abstract: This contribution is concerned with the feedback control of a table-placed mobile rehabilitation robot us-ing exact feedback linearisation to precisely track arbitrary position and orientation profiles. An outer control loop exactly linearises and decouples the nonlinear kinematic robot model. This loop also generates reference velocities for the three omnidirectional wheels of the robot that are feedback controlled by individual digital controllers on a inner loop level. The concept was validated in simulations.
Keywords: Nonlinear Control, Robotics, Rehabilitation
Introduction
Robot-aided neuro-rehabilitation has been widely studied in recent years. A variety of upper limb rehabilitation robots has been developed to assist, enhance, evaluate, and docu-ment neurological and orthopaedic rehabilitation of move-ment. However, these devices exclusively focused on the clinical setting which entails a lack of mobility, high acqui-sition costs and limited patient training times.
The Reha-Maus, which is a novel upper limb rehabilitation system developed by the Control Systems Group at TU-Berlin, represents one of the first concepts of a portable rehabilitation robot that actively provides different levels of patient assistance [1]. The design of the Reha-Maus is based on a mobile robot driven by omni-directional wheels. This enables rotational and translation motion in a plane for guiding the hand/lower arm.
However, the previously realised control scheme only al-lowed the arbitrary tracking of reference positions while the orientation had to be kept nearly constant [1]. Unwanted changes in the orientation, e.g. by external disturbances, could even render the position control loop unstable. This contribution describes a novel motion control system for the Reha-Maus that involves nonlinear control theory in order to enable the generation of arbitrary position and orientation profiles.
Methods
Omni-directional robot and kinematic model
The Reha-Maus is designed to allow patients to train their hemiparetic arm. Figure 1 shows a prospective application scenario of the Reha-Maus. The lower right arm of a patient is pivoted on the robotic platform. The system is used to as-sist or reas-sist the patient’s arm and shoulder movements dur-ing the traindur-ing. Human-device interaction forces/moments
3 DC motors with incremental encoders
3 omni-wheels Arm fixture - free to
rotate on the robot
Load cell
Bottom view y x
Figure 1: An application scenario of the Reha-Maus.
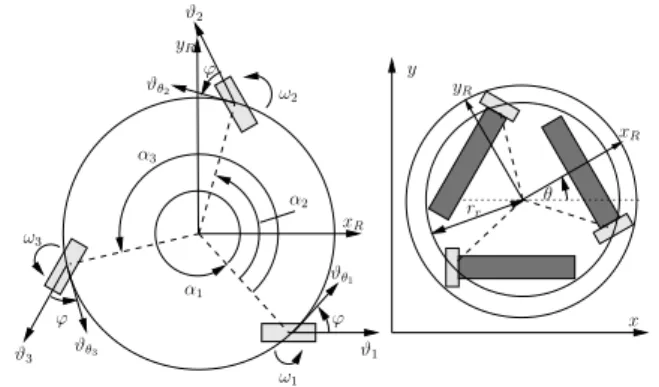
ω2 ϕ ϑ3 ϑθ3 ϕ ω3 α1 ϑθ1 α2 α3 ω1 ϑ1 ϕ ϑθ2 ϑ2 x y rr θ yR xR xR yR
Figure 2: Reha-Maus: Geometry and coordinate systems.
can be measured by a 6D force/torque sensor underneath the arm support, and the movement is monitored by an in-frared camera above the table and incremental encoders at the motors. Arbitrary translational and rotational motion on the table surface is facilitated by three DC-motor-driven omni-wheels. More technical details are given in [1]. The Reha-Maus possesses three DoFs and has a fixed body frame[xR, yR], aligned to the centre of mass (cf. Figure 2).
The description of the kinematics and dynamics takes place in generalised coordinates q = [x, y, θ]T, wherex and y represent the position of the robot on the planar workspace andθ is the robot orientation. A kinematic model was de-rived in [1] based on the assumption that the wheels have no slippage in the direction of traction force. The angular velocities of the three omni-wheels are forming the vector ω(t) = [ω1(t), ω2(t), ω3(t)]T. The kinematic relation
gen--0.6 -0.4 -0.2 0 0.2 0.4 0.6 0 1 2 3 4 x [m] Time [s] -0.6 -0.4 -0.2 0 0.2 0.4 0.6 0 1 2 3 4 y [m] Time [s] -4 -3 -2 -1 0 1 2 3 4 0 1 2 3 4 θ [r ad ] Time [s] -40 -20 0 20 0 1 2 3 4 ωr,i , i = { 1 ,2 ,3 } [r ad /s ] Time [s] x xr y yr θ θr ωr,1 ωr,2 ωr,3
Figure 3: Results for tracking a circular trajectory with si-multaneous robot rotation.
eralised velocity vector ˙q(t) is defined as
˙q(t) = Γ(θ(t))ω(t) (1)
Γ(θ(t)) = rω
cos(θ) cos(θ +2π3 ) cos(θ + 4π3 ) sin(θ) sin(θ +2π3 ) sin(θ +4π3 )
sin(ϕ) rr sin(ϕ) rr sin(ϕ) rr ,
where rr = 10.5 cm is the robot rotation radius, and
ϕ = 39◦ is a construction specific angle. The scalar r ω
is the radius of one omni-wheel. A discrete-time kinematic model can be obtained by the Euler method with the sam-pling periodts= 50 ms:
q(k + 1) = q(k) + Γ(θ(k))ω(k). (2)
Here,k is the sample index and Γ(θ(k)) = tsΓ(θ(k)).
Control system
To perform arbitrary robot movements, a cascaded discrete-time control structure is applied.
An inner loop consists of three independent motor speed controllers that operate the system at maximum actuator capacity in order to facilitate the simplified state-space de-scription of the robot given below. The sample rate of the inner loop is 1 kHz and a bandwidth of approximately 45 Hz is achieved. The design of each motor speed controller is based on an experimentally identified transfer-function model and is described in [1].
An outer loop regulates the generalised robot coordinates and generates as control signals the reference wheel veloci-ties for the inner loop. The sampling time of the outer loop is set to 50 ms. The relationship between the wheel velocity reference vector ωrand controlled wheel velocity vector ω
can be expressed as a simple time delay of one sampling step:
ω(k + 1) = ωr(k). (3)
Combining the kinematic model (2) with the controlled wheel speed dynamics (3) yields a non-linear model with the state x(k) = [q(k)T, ω(k)T]T, the output y(k) = q(k)
and the input signal ωr(k). This model is employed for
designing the outer loop controller. The entire state x(k) is accessible by measurement or estimation [1]. In order to exactly linearise and to decouple the discrete-time multi-variable non-linear model, the following relation between the output y and the input ωris derived from the state-space
model (Eqs. (2) and (3)):
q(k) = q(k− 1) + Γ(k − 1)ωr(k− 2). (4)
The control law ωr(k) = Γ
−1
(k + 1)(v(k)− q(k + 1)) leads to q(k) = v(k− 2) with the new input signal v. The now linearised and decoupled plant model represents a sim-ple time delay of two sampling steps with respect to signal v. The term q(k + 1) can be calculated from q(k) and ω(k) using the state propagation described in Eq. (2). For each generalised coordinate, the exactly linearised plant will be separately feedback controlled by a second order standard linear digital controller with integral action [2] to allow the tracking of a given reference (xr, yr, θr). The poles of the
outer closed-loop dynamics have been chosen to obtain a bandwidth of approximately 2 Hz.
Results
The cascaded control scheme with the nonlinear controller at the outer loop was evaluated in simulations first. Figure 3 shows the results of a tracking test. The robot had to follow a circular path within 4 s while rotating at the same time around its axis. Noise, typically observed at the real system, was added to the states during simulation. The robot was initially in the centre of the circle with an orientation error of 180◦.
Discussion
The proposed nonlinear control scheme successfully lin-earises and decouples the nonlinear discrete-time model and therefore allows the tracking of arbitrary position and orien-tation profiles. After the compensation of initial errors, the system output follows the references as specified. The ob-served wheel velocities are feasible in practice. The devel-oped controller forms the basis for the realisation of many therapeutic exercises that will be realised by the robot. The experimental validation of the control concept is ongoing.
Bibliography
[1] D. Lou, T. Schauer, M. Roth, and J. Raisch, “Position and orientation control of an omni-directional mobile rehabilitation robot,” in IEEE Multi-Conference on Sys-tems and Control 2012, (Dubrovnik, Croatia), pp. 50– 56, 2012.
[2] K. J. Åström and B. Wittenmark, Computer-controlled systems: theory and design. Prentice Hall, 1997.
FIRST RESULTS OF A NEW ELECTROMECHANICAL CONTROLLED
EXTERNAL VENTRICULAR DRAINAGE IN A PORCINE MODEL
Inga Margrit Elixmann
1, Marian Walter
1, Christine Goffin
1, Michael Czaplik
1, Phil Alexander Huewelmann
1,
Monika Kwiecien
1, Martin Weinzierl
2, Markus Oertel
3, Wolfgang-Ingo Steudel
4, Michael Kiefer
3, Berno
Misgeld
1, Klaus Radermacher
1and Steffen Leonhardt
11
Helmholtz-Institute for Biomedical Engineering, RWTH Aachen University, Aachen, Germany
2,3,4
Department of Neurosurgery:
2Helios Klinikum Krefeld, Germany;
3Inselspital Bern, Switzerland;
4
Saarland University, Homburg, Germany
[email protected]
Abstract: Acute increase of intracranial pressure (ICP) usually has to be treated with an external ventricular drainage (EVD). Current standard mechanical EVD carry a lot of disadvantages, which hypothetically could be bet-ter managed by a newly developed electromechanical EVD. In this report our first preliminary results of such an elec-tromechanical EVD applied in a porcine animal model are presented. The drainage was demonstrated to be both suc-cessful in monitoring and controlling elevated ICP, and able to detect slit ventricles due to overdrainage, if the indented target ICP was set too low.
Keywords: External Ventricular Drainage, Intracranial Pressure, Control, Animal Model
Introduction
An increase in intracranial volume causes raise of intracra-nial pressure (ICP). Such an increase can occur for example because of an imbalance of the continuous process of pro-duction and resorption of cerebrospinal fluid (CSF). Acute high ICP can be life threatening and has to be treated im-mediately. The standard procedure consists of insertion of a pressure sensor for ICP monitoring as well as a catheter into the ventricles for external drainage of CSF. Usually, the height of the CSF drainage reservoir determines the result-ing ICP due to its hydrostatic pressure. This conventional mechanical external ventricular drainage (EVD) has poten-tial disadvantages and possiblities of complications. If the position of the reservoir is chosen too low or the patient changes to an upright position, undesirable overdrainage may occur. The ventricles can collapse to slit ventricles and occlude the catheter perforation. Currently, there is exclu-sively one commercially available electromechanical EVD consisting of an ICP sensor integrated in the drainage tube followed by a peristaltic pump called Liquoguard®(Moeller Medical GmbH), which is conceived of potentially mini-mize these problems. However, it is advisable to use this system with an additional independent ICP sensor to be able to detect slit ventricles. If slit ventricles occur, the integrated pressure sensor measures incorrect ICP values [1]. Therefore, the authors developed an innovative elec-tromechanical "intelligent" EVD (iEVD) [2], which mea-sures simultaneously ICP, pressure and flow in the tube and
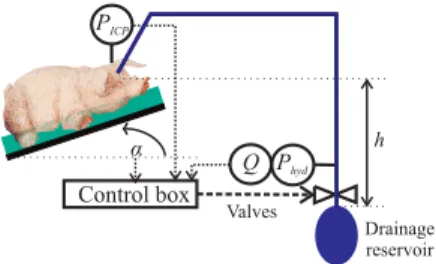
h Control box α Phyd PICP Q Valves Drainage reservoir
Figure 1: Experimental setup with the iEVD
patient position α (Figure 1). The iEVD functions by a hydrostatic pressure difference between cranium and CSF drainage reservoir and controls the ICP by positioning of a tube squeezer valve and an additional switching valve. It was already tested in an animal experiment, is able to re-sponse to changes of the drainage reservoir position or tar-get ICP value and can indirectly detect slit ventricles.
Methods
In the present animal experiment, inducing a kaolin solution into the cisterna magna reduces the pigs’s CSF resorption surface. The pig was kept under general anaesthesia. On the third day, the iEVD was implanted and tested.
The control loop with the iEVD is shown in Figure 2. The gradual tube squeezer valve sets an appropriate operating point for the system by adjusting the drainage to the target flow Qtargetand the switching valve was used in the outer
control loop to keep ICP at the intended level. In recent studies, the position of the gradual tube squeezer valve was the only control variable applied. However, due to an in-tegrative error in the position sensor of the tube squeezer valve, the nonlinear relationship of motor position to hy-draulic resistance could not be compensated exactly after some time [2] and hence the switching valve was added. A filter uses a 5 s moving window over 100 Hz ICP measure-ments, determines the maximum (systolic) and minimum (diastolic) ICP value and calculates the average 1 Hz-ICP value by the following equation:
ICP = 1
3(ICPmax+ 2 · ICPmin) (1) The control algorithm works with a sample frequency of 1 Hz. At the beginning, the switching valve opens and the
following tube squeezer valve gradually opens in minimal step size of 2.5 µm until the iEVD drains a predetermined target flow Qtarget. After this initialization the switching
valve is controlled with a hysteresis of 0.3 mmHg. While the switching valve is open, a secondary controller increases the stored value of Qtarget by 50 % if ICP is increasing
more than 0.3 mmHg within 1 s or ICP is not decreasing after a certain threshold time.
Whenever QEV D< 1.25 · Qtarget, the controller increases
stepwise the opening position of the tube squeezer valve until Qtargetis reached.
Slit ventricles are diagnosed when pulsation of the brain is not passed on to the water column and the difference of the maximal and minimal value within a 5 s window of 100 Hz data of the pressure sensor in the drainage tube is smaller or equal to 1 mmHg.
Results
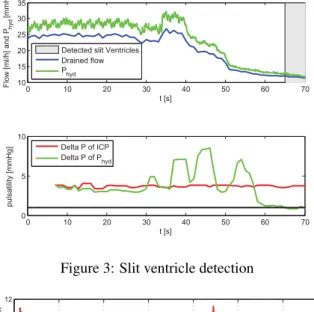
The target ICP had to be chosen higher than 8 mmHg other-wise the pig suffered from slit ventricles (s. Figure 3). With a target ICP of 8 mmHg, slit ventricles occured at approx-imately t =50 s and at t =56 s the pulsation in the water column Phyd got smaller than 1 mmHg and slit ventricles
were identified. The compliance of the tubing dampens the amplitude of ICP by 25 %.
With a higher target ICP the drainage functioned well as shown in Figure 4. At t =110 s the level of the drainage reservoir was increased and the flow decreased. At t =300 s the target ICP was decreased from 10.5 mmHg to 10 mmHg and hence Qtargetwas increased by the controller to drain
sufficently. The tube squeezer valve gradually opened the tube until Qtargetwas reached again. After ∆t ≈200 s the
target flow was constant and only the outer control loop was active once again.
Discussion
First tests of the iEVD at a pig were successful. Potential fu-ture improvements could be an automatic increase of target pressure, if slit ventricles were detected. This preliminary iEVD can serve as a platform for more advanced control approaches: Foltz et al. [3] found out that the waveform is more reliable than mean ICP for diagnosis in humans.
PICP
- switching valveController for GS
ΔQProd Controlled system e d‘ ΔP -hΔPh0 d TS Sampler Descretizer filter TS Sampler Descretizer Qdrain
Controller for gradual tube squeezer valve
P ICP target valve position NLR NLR = non linear controller (event based control)
Figure 2: ICP control loop
0 10 20 30 40 50 60 70 10 15 20 25 30 35 t [s] Flow [ml/h] and P hyd [mmHg]
Detected slit Ventricles Drained flow P hyd 0 10 20 30 40 50 60 70 0 5 10 t [s] pulsatility [mmHg] Delta P of ICP Delta P of P hyd
Figure 3: Slit ventricle detection
0 100 200 300 400 500 600 700 9 10 11 12 t [s] ICP [mmHg] 0 100 200 300 400 500 600 700 0 10 20 t [s] Flow [ml/h] Measured flow Target flow Drainage bag rise
Figure 4: Measured adaption of target flow to maintain the changing target ICP at t =300 s
If pigs show similar single pulse waveform change follow-ing increasfollow-ing ICP, it would be possible to observe how the iEVD performs in draining according to waveform.
Acknowledgement
The authors express their gratitude for the financial sup-port of the BMBF, the supsup-port of Sensirion AG and of our project partner Reco Medizintechnik Wolfgang Rentsch e.K. and Raumedic AG.
Bibliography
[1] S. Linsler, M. Schmidtke, W. I. Steudel, M. Kiefer, and J. Oertel, “Automated intracranial pressure-controlled cerebrospinal fluid external drainage with Liquo-Guard®,” Acta Neurochir (Wien), Nov. 2012, Epub. [2] I. M. Elixmann, M. Walter, C. Goffin, S. Hahne,
M. Kiefer, and S. Leonhardt, “Hirndruckmodellierung und Regelung einer neuen mechatronischen exter-nen Ventrikeldrainage,” at - Automatisierungstechnik, vol. 59, pp. 613–621, Oct. 2011.
[3] E. L. Foltz and C. Aine, “Diagnosis of hydrocephalus by CSF pulse-wave analysis: a clinical study.,” Surg Neurol, vol. 15, pp. 283–93, Apr. 1981.
MODEL-BASED VENTILATOR SETTINGS IN PRESSURE
CONTROLLED VENTILATION
Schranz C
1, Becher T
2, Schädler D
2, Weiler N
2, Möller K
1 1Institute of Technical Medicine, Furtwangen University, Germany
2
Dept. of Anesthesiology and Intensive Care Medicine, University Medical Center Schleswig-Holstein, Germany
[email protected]
Abstract: Mathematical models of respiratory mechanics
can be used to optimize ventilatory settings. This paper presents an approach to calculate patient-specific ventila-tor settings during pressure controlled ventilation. The proposed algorithm identifies the 1st Order Model of respiratory mechanics and calculates ventilator settings that provide a defined alveolar minute ventilation with minimal inspiration pressure and allow sufficient expira-tion time to avoid the build-up of intrinisic PEEP. The results can also be used to visualize the nonlinear relation of ventilation parameters. Retrospective comparison of calculated ventilator settings in clinical data indicated high concordance to clinically optimized ventilator set-tings. The proposed algorithm and visualization uncovers the nonlinear interaction of ventilation parameters and supports the determination of individualized ventilator settings. The algorithm minimzes inspiration pressure necessary to achieve a predefined minute ventilation, which may be a useful approach in optimizing lung-protective ventilation.
Keywords: Model-based Therapy, Optimized Ventilator
Setting, Respiratory Mechanics
Introduction
Mechanical ventilation carries the risk of ventilator-induced lung injury (VILI), caused by excessive stress and strain to the lung tissue [1]. To minimize the risk of VILI, ventilator settings should be adapted to the individ-ual breathing mechanics of the patient. Currently there is no general consensus about the “ideal” ventilation strat-egy for preventing VILI. However, there is evidence that considering individual lung properties might be beneficial [2]. Thus, mathematical models of respiratory mechanics can be used to quantify the characteristics of the respira-tory system leading to personalized optimized ventilator settings [2]. This paper presents an approach to calculate and illustrate the influence of patient-specific ventilator settings during pressure controlled ventilation (PCV) to maintain a preset minute ventilation. Finally, ventilator settings with minimal inspiration pressure and sufficient inspiration and expiration time can be selected to mini-mize alveolar stress and to avoid the build-up of intrinsic PEEP.
Methods
The alveolar ventilation is the effective part of the applied minute ventilation (MV) penetrating the regions of the
lung where gas-exchange occurs. Alveolar ventilation depends on the dead-space volume VD, the tidal volume
VT and the respiratory rate (RR):
V V
RRVA T D (1)
VD can be approximated using the estimated patient’s
ideal body weight (iBW).
iBW kg
mL
VD2 (2)
To calculate the required tidal volume to maintain the de-sired alveolar ventilation, Eq. 1 is rearranged using the inspi-ration and expiinspi-ration time (tI and tE) to represent RR:
I E
D A D A T V V t t V RR V V (3)The tidal volume in Eq. 1 can be simulated by using a patient-specific model of respiratory mechanics and the applied airway pressure as the defined input signal.
Respiratory mechanics model: The 1st Order Model
(FOM) of respiratory mechanics is a serial arrangement of a resistive element (R) and a compliant compartment (C). The FOM is given as a transfer function:
sRC C s p s V s H aw 1 ) ( ) ( ) ( (4)
Model simulation: During PCV a pressure signal
accord-ing to Figure 1 is applied by the ventilator. The initial phase for t < tR and can be described as follows:
t t PEEP p t p R I Ramp aw ) ( , (5) t paw PEEP tR pI
Figure 1: paw during inspiration phase in PCV
The entire pressure signal during inspiration is con-structed by using a step-function σ(t):
t t
p t p PEEP
t p t p I Ramp aw R Ramp aw aw ) ( ) ( ) ( , , (5)The resulting volume as output signal can be derived in Laplace-Domain by multiplying the transfer function and the Laplace-transferred input signal:
()
( ))
(s L p t H s
V aw (6)
By an inverse Laplace-Transformation the resulting tidal volume can be derived in the time-domain for t > tR.
Table 1: Patient characteristics with applied ventilator settings (tR = 0.2 s) together with identified model parameters and
calculated ventilator settings (tR = 0.2 s).
Pat. Height Diagnosis alv.Vent (L/min) pI,Set
(cmH2O) PEEP (cmH2O) tI,Set (s) tE,Set (s) R (cmH2O·s/L) C (mL/cmH2O) τE (s) pI,Calc (cmH2O) tI,Calc (s) tE,Calc (s)
1 170 Trauma, mod. ARDS 7.0 30.0 15.0 2.0 3.0 14.5 51.2 0.92 29.1 1.5 2.8 2 163 Gold IV Sepsis 5.9 25.0 7.0 0.8 1.8 15.6 25.9 0.45 20.7 0.9 1.4
RC t R RC t I RC t R I T I R I e t e RC p PEEP e t C t t V V 1 (7)Calculating ventilator settings: To find the relation of
inspiration pressure and inspiration time to meet the calcu-lated tidal volume in Eq. 3, Eq. 7 is rearranged in terms of inspiration pressure.
RC t R RC t T RC t R RC t I I R I R e t e RC C V PEEP C e t PEEP e RC p 1 1 2 (8)Patient-specific ventilator settings with respect to sufficient expiration time require an expiration time being at least three times the time constant during expiration τE [3]. Thus, pI is
calculated for for two different tE = 3·τE and tE = 4·τE and two
different tR, being 0 and 0.2 s for various tI in the range of 0.1
to 4 s.
Model identification: The patient-specific parameters R and
C were determined by fitting the FOM to inspiratory data of
measured PCV-cycles using multiple linear regression method. τE is estimated by fitting an exponential function to
the expiratory flow data.
Analysis of clinical data: Data sets of two ventilated
pa-tients in PCV from a previous clinical trial were used for this analysis (Table 1). Written informed consent had been ob-tained from the patients. The clinical ventilator settings had been optimized by experienced ICU-physicians to provide a clinically acceptable minute ventilation with minimal pI
while avoiding the build-up of intrinsic PEEP. The recorded data were used to identify the model as described and the algorithm calculated ventilator settings that would yield the same alveolar minute ventilation.
Results
After estimating R, C and τE of the ventilated patients (Table
1), the nonlinear relation between the ventilator settings of pI
and tI for tE = 3·τE and 4·τE, and tR = 0.0 s and 0.4 s were
obtained (Fig. 2). Obviously, these relations show a unique minimum for pI. Longer tE and longer tR lead to higher pI to
maintain the same alveolar ventilation. Additionally, the effect of tR on pI is more dominant in regions of shorter tI and
gets smaller with increasing tI. The clinical settings in Patient
1 (Fig. 2, left) indicate, that the patient was ventilated with tE
being in the region of 3·τE. To minimize pI, tI could be
re-duced from 2.3 to 1.8 s. Patient 2 (Fig. 2, right) was venti-lated with tE ≈ 4·τE. The applied pI could be decreased from
25 cmH2O to 21 cmH2O by shortening tE to 3·τE and tI from
1.4 s to 0.9 s. 0 1 2 3 4 10 15 20 25 30 35 40 tI (s) pI ( cm H2 O)
tE = 3*E, tR = 0.4 s tE = 4*E, tR = 0.4 s tE = 3*E, tR = 0.0 s tE = 4*E, tR = 0.0 s Appl. Ventilator Settings
0 1 2 3 4 10 15 20 25 30 35 40 tI (s) pI ( cm H2 O)
Figure 2: Patient-specific relation of ventilator settings. pI
over tI to achieve a defined alveolar ventilation, for various tE
and tR (left: Patient 1, right: Patient 2)
Discussion
The methodology proposed offers clinically acceptable pa-tient-specific suggestions of ventilator settings that are di-rectly applicable at the ventilator. The settings at minimal pI
could be considered as lung-protective as mechanical stress may be minimized and additionally the risk of intrinsic-PEEP build-up is reduced. The visualization of the nonlinear interaction of ventilator settings can be helpful for the clini-cian to get an impression on the quality of ventilation and to find a direction for further optimization to following thera-peutic goals. The nonlinear relation of ventilation parameters becomes transparent and may support the determination of optimized ventilator settings that consider the individual lung physiology.
Acknowledgement
This research was supported by the German Federal Min-istry of Education and Research (WiM-Vent, Grants 01IB10002D and 01IB10002F).
Bibliography
[1] J. D. Ricard, D. Dreyfuss et al., “Ventilator-induced lung injury,” Curr Opin Crit Care, vol. 8, no. 1, pp. 12-20. 2002.
[2] S. E. Rees, C. Allerød et al., “Using physiological models and decision theory for selecting appropriate ventilator settings,” J Clin Monit Comput, vol. 20, no. 6, pp. 421-9, Dec. 2006.
[3] M. S. Lourens, B. van den Berg et al., “Expiratory time constants in mechanically ventilated patients with and without COPD,” Intensive Care Med, vol. 26, no. 11, pp. 1612-8, Nov. 2000.
CURRENT DEVELOPMENTS IN AUTOMATIC DRUG DELIVERY IN
ANESTHESIA
Simanski O
1, Sievert A
1,2, Janda M
3, Bajorat J
31
Automation and Mechatronics Group, Hochschule Wismar - University of Applied Sciences: Technology
Busi-ness and Design, Wismar, Germany
2
Institute of Automation, University of Rostock, Rostock, Germany
3
Clinic of Anaesthesiology and Intensive Care, University of Rostock, Rostock, Germany
[email protected]
Abstract: The main objectives during general anaesthesia
are adequate level of hypnosis, analgesia, relaxation, and stable vital functions. During the last 20 years many control-lers for the automatic drug delivery in anaesthesia were developed. Our group also developed controllers for the neuromuscular blockade, the depth of hypnosis and the analgesia. In order to administer the medication as needed, a model-based control design or a model-based control is a goal worth striving for. The controller designed in our group and first results of the studies are presented and evaluated briefly.
Keywords: automation in anaesthesia, automatic drug
delivery
Introduction
In clinical practice anaesthesiologists have to observe and control a huge amount of hemodynamic and respiratory variables as well as clinical signs for adequate hypnosis and analgesia. In neuro-, thoracic- and abdominal surgery a continuous neuromuscular block is needed to guarantee optimal surgical conditions. A neuromuscular blocking drug is administered in order to prevent reflex muscle movement.
New short-acting drugs are introduced over the last years. This makes a continuous mode for drug application pos-sible and implies the use of automatic control.
For the design of a closed-loop control system a measura-ble control value and remote controllameasura-ble infusion pumps are needed.
Measurement and Modelling
For the determination of the degree of neuromuscular blockade is the muscle response recorded. The evoked muscle response after supramaximal stimulation of a motoric nerve (e.g. ulnaris nerve - adductor pollicis mus-cle) can be registered by electromyography (EMG) or acceleromyography (AMG). A frequently used device is the “NMT-module” (Fa. General Electric) [1].
Measuring depth of hypnosis is often discussed and no final answer can be given. Different algorithms are known for estimation the depth of hypnosis from the raw EEG. The bispectral index (BIS) becomes very popular in the last years and has been validated in large studies. The algorithm combines the power spectrum and bispectrum with a burst suppression analysis. The BIS describes a
complex EEG pattern within a simple variable. The BIS-monitor (Fa. Aspect Medical) reflects the state of hypno-sis with help of an index between 0-100, where 0 repre-sents an isoelectrical EEG.
The main problem of measuring the analgesia level is the loss of parameters, which describe the current status. A rather new commercial device called A.N.I.-Monitor (Fa. MetroDoloris) uses a wavelet transformation of the ECG to gather information about the parasympathetic tone.The A.N.I.-Monitor outputs a simple numeric value with a scale from 0 - 100 to describe the state of analgesia calcu-lated from the hearth rate variability (HRV) [2]. More popular is the use of direct HRV parameters to detect the analgesia level [4].
For the controller design it’s desirable to use a model description that explains the interaction between the drug infusion and the measurable effect. The most popular kind to model the drug distribution and elimination are phar-macokinetic-pharmacodynamic (PKPD) models.
Pharmacokinetics describes the dynamic process of drug distribution in the body from the infusion to the concen-tration in the blood and pharmacodynamics describes the interaction from the blood concentration and the measure-able effect [3].Figure 1 shows the general structure of the PKPD model description.
Figure 1: Structure of the simple drug interaction model in Wiener structure, with u as infusion rate, e-sT as delay time for the drug transport, G(s) as transfer function of the PKPD model and Eeff as measurable effect after the static
nonline-arity.
Depending on the used drug G(s) is a third order model for the neuromuscular blocking drug or a fourth order model for the hypnotic drug Propofol.
Figure 2 shows the schematic description of the developed control system. An adaptive generalized predictive controller (aGPC) was developed for the control of the neuromuscular blockade [5]. Because of the nonlinear behaviour of the measurement of the depth of hypnosis a simple fuzzy con-troller as nonlinear concon-troller was integrated. For the design of the fuzzy PD+I controller a standard implementation of the integral (I) part was used. The rules for the