Advance Access publication 20 September 2013
Pharyngeal airway dimensions: a cephalometric,
growth-study-based analysis of physiological variations in children aged 6–17
Barbara Mislik
*
, Michael P. Hänggi
*
, Luca Signorelli
*
, Timo A. Peltomäki
**
and
Raphael Patcas
*
*Department of Orthodontics and Pediatric Dentistry, Center for Dental Medicine, University of Zurich, Switzerland, **Oral and Maxillofacial Unit, Tampere University Hospital, Finland
Correspondence to: Raphael Patcas, Department of Orthodontics and Pediatric Dentistry, University of Zurich, Plattenstrasse 11, CH-8032 Zurich, Switzerland. E-mail: [email protected]
Summary
OBjECTivE: The aim was to assess pharyngeal airway dimensions and physiological changes based on lateral cephalometric radiographs from healthy untreated children aged 6–17 years.
MATERiALS/METHODS: The sample consisted of 880 lateral cephalograms (412 females and 468 males) of the Zurich Craniofacial Growth Study. Statistical analyses on cephalometric measurements of airway dimensions (distances ‘p’: shortest distance between soft palate and posterior pharyngeal wall and ‘t’: shortest distance between tongue and posterior pharyngeal wall) and craniofacial parameters were performed. To disclose differences between different age groups, a Kruskal–Wallis test was applied. The influence of gender on ‘p’ and ‘t’ was analysed by a Mann–Whitney U-test for each age group separately. The Spearman correlation was computed in order to investigate associations between crani-ofacial parameters. variables associated with ‘p’ and ‘t’ were chosen for multiple regression model investigation.
RESULTS: The results demonstrated high interindividual variations. A slight influence of age on ‘p’ (P = 0.034) could be attested (+1.03 mm) but not on ‘t’ (P = 0.208). With the exception of the 9-year age group, no significant differences between the genders were found. Correlation analysis revealed sev-eral statistically significant correlations between ‘t’ or ‘p’ and antero-posterior cephalometric variables. All correlation coefficients were, however, very low and the adjusted coefficient of determination also revealed the regression model to be very weak.
COnCLUSiOnS: The high interindividual variations of ‘p’ and ‘t’ render the use of reference values problem-atic. Contrary to other craniofacial structures, neither age-related changes nor sexual dimorphism were found for ‘p’ and ‘t’. Any associations to antero-posterior cephalometric characteristics seem low.
Introduction
Interest in upper airway shape and dimensions has increased steadily during the past few decades, mainly due to the appreciation of the relationship between upper airway con-figuration and sleep-disordered breathing (SDB) as well as its relation to craniofacial morphology in general ( Guijarro-Martinez and Swennen, 2011; Katyal et al., 2013; Flores-Mir et al., 2013).
SDB refers to a wide variety of breathing anomalies rang-ing from chronic or habitual snorrang-ing to upper airway resist-ance syndrome and to obstructive sleep apnoea (OSA). SDB mostly results from a combination of anatomic factors that predispose the airway to collapse during inspiration, combined with an insufficient neuromuscular compensa-tion during sleep to maintain airway patency (Young et al., 2002). Among anatomic factors, adenotonsillar hypertrophy is considered to be the most commonly recognized cause for SDB in children (Marcus, 2000). Deviant craniofacial morphology is also a predisposing factor (Pirilä-Parkkinen
et al., 2010; Katyal et al., 2013).
SDB is associated with several symptoms in children, the severity of which varies according to the severity of the disorder. Snoring, enuresis, frequent episodes of hypoxia, and awakenings are common night-time symptoms and consequences, which disrupt continuous sleep and can cause significant daytime problems (Young et al., 2002). Excessive sleepiness, decrease in school performance, abnormal behaviour, growth disturbance, and the progres-sive development of hypertension are frequently found. An association between SDB, sleep bruxism, and headache has also been reported in children and adolescents (Carra et al., 2012).
Early diagnosis of SDB is imperative in order to promote
normal facial development (Peltomäki, 2007; Aboudara
et al., 2009). Small pharyngeal dimensions established early in life may predispose to later SDB or even to OSA (Papaioannou et al., 2013), when subsequent soft-tissue changes caused by normal ageing, obesity, or genetic back-ground further reduce the patency of the oropharynx (Martin
First and foremost sign of SDB is pathologic breathing and sleeping pattern, which may be evaluated and recorded in the patient’s history. Lateral cephalograms have, to no little extend, also been used to diagnose restricted dimen-sions of the oropharynx (Battagel et al., 2000; Kuhnel et al., 2005), identifying certain decreased pharyngeal dimensions characteristic to OSA (Battagel and L’Estrange, 1996). In a systematic review, lateral cephalometry has been found to be a reliable initial screening tool of upper airway obstruc-tion to determine the need for more in-depth ENT follow-up (Major et al., 2006).
Literature on physiologic airway dimensions in growing subjects is however scarce and, in case a reference value was needed, most studies compared airway dimensions of SDB subjects to a relative small control group. These com-parative studies have found airway dimension to average 10–12 mm at its shortest distance between the tongue and the posterior pharyngeal wall and 9–10 mm at its shortest distance between the soft palate and the posterior pharyn-geal wall (de Freitas et al., 2006; Hanggi et al., 2008; Pirilä-Parkkinen et al., 2011; Bollhalder et al., 2013). Yet little is known about the development of airway dimensions in healthy children and if age or gender have an influence on airway dimensions.
The aim of this retrospective cross-sectional study was to evaluate pharyngeal airway dimensions and their phys-iological changes based on a large sample size of lateral cephalograms of healthy untreated children between 6 and 17 years of age. To our knowledge, no previous attempt has been made so far to study airway dimensions from a large sample, enabling to classify all measurements according to age and gender.
Materials and methods
Subjects
The lateral cephalograms used for this study were derived from the Zurich Craniofacial Growth Study performed in the years 1981–84 at the Department of Orthodontics and Paediatric Dentistry of the University of Zurich. In the orig-inal study, 884 healthy schoolchildren of Caucasian ethnic-ity from all local public schools of the cethnic-ity of Zurich with no history of orthodontic treatment were randomly selected and examined. Based on a health questionnaire, subjects with severe systemic diseases and children under medica-tion were excluded from the selecmedica-tion. Different skeletal or dental malocclusions as well as breathing pattern, habits, enlarged tonsils, snoring, etc. were not considered as exclu-sion criteria.
The examination always took place very close to the indi-vidual’s birthday. Ethical and legal approval for releasing the data was obtained by the Federal Commission of Experts for Professional Secrecy in Medical Research (Federal Authorities of the Swiss Confederation, 2011). All cephalograms utilized
for this study had to be of good quality and the airway had to be clearly visible. Thus, the final sample used consisted of 880 cephalograms (412 females and 468 males). The gender distribution for all ages is given in Tables 2 and 3).
Methods
All cephalograms were taken with the same custom-made X-ray device (COMET, 3175 Flamatt, Switzerland) in a standardized position: the teeth were in centric occlusion and the head was aligned with the Frankfort horizontal plane parallel to the floor. This position was stabilized with ear rods and a nasal support to prevent the head from rotat-ing durrotat-ing exposure. The focus-coronal plane distance was 200 cm, film-coronal plane distance was 15 cm, and the magnification was 7.5 per cent.
The subjects were asked to refrain from swallowing dur-ing the radiological examination. Tongue posture was sub-sequently assessed on the cephalograms to ascertain that the children did not swallow.
Three investigators who had been calibrated previously by a board-certified orthodontist traced and landmarked the lateral cephalograms by hand according to the definitions listed in Table 1 and shown in Figure 1. The digitizing was performed using a tablet digitizer (NumonicsAccuGrid, Lansdale, Pennsylvania, USA) with a resolution of 1 milli-inch. The digitized cephalometric values were calculated using self-written software.
For the assessment of the dimension of the airway, two distances were evaluated as described in other airway stud-ies (McNamara, 1984; Rodenstein et al., 1990; Finkelstein
et al., 2001; Pirilä-Parkkinen et al., 2011; Alves et al., 2012): distance ‘p’, as the shortest distance between the soft palate and the posterior pharyngeal wall, and distance ‘t’ as the shortest distance between the tongue and the posterior pharyngeal wall.
In addition to the conventional measurements of for pro- and retrognathism (SNA, SNB), distance ratios were also introduced. Three distances parallel to the Frankfort hori-zontal plane, perpendicular to a vertical line through sella (point S), were measured to nasion (point N), point A, and point B, respectively (Figure 1). Subsequently, three ratios were defined as distance to point A/distance to point N (‘ratio A/N’), distance to point B/distance to point N (‘ratio B/N’), distance to point [(A + B) × 0.5]/distance to point N (‘ratio AB/N’).
Thirty-eight cephalograms were traced a second time more than 6 months apart, 19 by the same investigator and 19 by a different investigator, in order to determine intra- and interobserver reproducibility.
Statistical methods
The data were analysed with SPSS (IBM SPSS version 20, Armonk, New York, USA). To determine intra- and interob-server reliability, the intraclass correlation coefficient (ICC)
for absolute agreement based on a one-way random effects analysis of variance was calculated.
Descriptive statistics were computed for all variables of interest for each age group separately. The distances ‘p’ and ‘t’ were tested for normal distribution using the tests of Kolmogorov–Smirnov and Shapiro–Wilk, revealing that ‘p’ and ‘t’ differ statistically significantly from normal distribu-tion. Therefore, non-parametric tests were used for further investigations.
The association between age and distances ‘p’ and ‘t’ was investigated graphically and a non-parametric estimate of the mean influence was provided by the Loess-smoother (Cleveland and McGill, 1985), in order to visualize the dependency of ‘p’ and ‘t’ to age. Kruskal–Wallis test was applied to disclose the differences in mean values of ‘p’ or ‘t’ between the age groups.
The influence of gender on distances ‘p’ and ‘t’ was analysed by a Mann–Whitney U-test for each age group separately.
Spearman correlation was computed in order to investi-gate associations between distances ‘p’ and ‘t’ and ceph-alometric parameters. Additionally, partial parametric correlations were performed to adjust for multiple correla-tions due to age, gender, and all cephalometric predictors used. Variables that showed tendencies for associations with distances ‘p’ and ‘t’ (P < 0.1) were chosen for mul-tiple regression model investigations. Backward search procedure was applied in order to obtain the most parsimo-nious model. The resulting optimal multiple linear regres-sion model was refitted again using the entire procedure. The estimates of the adjusted regression coefficient and the corresponding P values were provided. The relevance of the model was discussed according to the adjusted R2-statistic.
Results of statistical analysis with P-value smaller than 0.05 were considered to be statistically significant.
Results
The ICC revealed a very good repeatability for all cephalo-metric measurements. The mean value for all measurements was 0.948 (1 SD: 0.142; minimum: 0.729; maximum: 0.995) for intraobserver repeatability and 0.933 (1 SD: 0.141; min-imum: 0.700; maxmin-imum: 0.996) for interobserver repeat-ability, respectively. These ICC values are comparable to other airway studies (Bollhalder et al., 2013) and indicate a reliable reproducibility of the measurements.
The distributions of airway distances ‘t’ and ‘p’ corre-sponding to the age of the subjects are shown graphically in
Figures 2 and 3, respectively. The mean distances and stand-ard deviation for distance ‘t’ and ‘p’ are presented in Tables 2 and 3. Both tests for normality revealed that distances ‘t’ and ‘p’ differ statistically significantly from normal distri-bution (Kolmogorov–Smirnov for ‘t’: 0.000 and ‘p’: 0.000; Shapiro–Wilk for ‘t’: 0.000 and ‘p’: 0.010), and hence, non-parametric tests were used for further investigations.
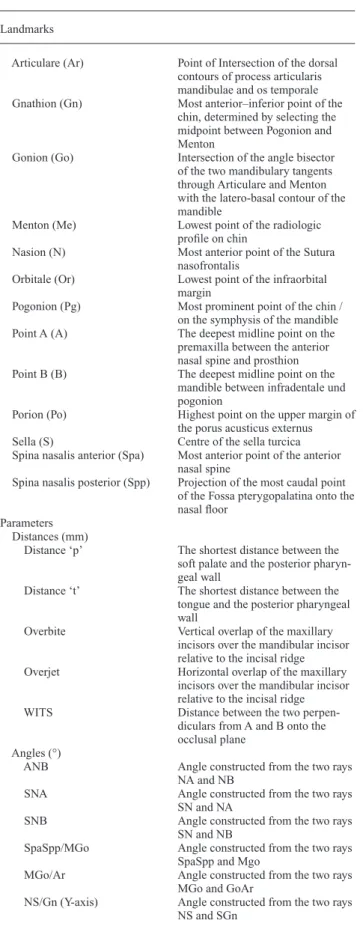
Table 1 Definition of the cephalometric landmarks and parameters used in this study (alphabetical order). Landmarks
Articulare (Ar) Point of Intersection of the dorsal contours of process articularis mandibulae and os temporale Gnathion (Gn) Most anterior–inferior point of the
chin, determined by selecting the midpoint between Pogonion and Menton
Gonion (Go) Intersection of the angle bisector of the two mandibulary tangents through Articulare and Menton with the latero-basal contour of the mandible
Menton (Me) Lowest point of the radiologic profile on chin
Nasion (N) Most anterior point of the Sutura nasofrontalis
Orbitale (Or) Lowest point of the infraorbital margin
Pogonion (Pg) Most prominent point of the chin / on the symphysis of the mandible Point A (A) The deepest midline point on the premaxilla between the anterior nasal spine and prosthion Point B (B) The deepest midline point on the
mandible between infradentale und pogonion
Porion (Po) Highest point on the upper margin of the porus acusticus externus Sella (S) Centre of the sella turcica Spina nasalis anterior (Spa) Most anterior point of the anterior
nasal spine
Spina nasalis posterior (Spp) Projection of the most caudal point of the Fossa pterygopalatina onto the nasal floor
Parameters Distances (mm)
Distance ‘p’ The shortest distance between the soft palate and the posterior pharyn-geal wall
Distance ‘t’ The shortest distance between the tongue and the posterior pharyngeal wall
Overbite Vertical overlap of the maxillary incisors over the mandibular incisor relative to the incisal ridge Overjet Horizontal overlap of the maxillary
incisors over the mandibular incisor relative to the incisal ridge WITS Distance between the two
perpen-diculars from A and B onto the occlusal plane
Angles (°)
ANB Angle constructed from the two rays NA and NB
SNA Angle constructed from the two rays SN and NA
SNB Angle constructed from the two rays SN and NB
SpaSpp/MGo Angle constructed from the two rays SpaSpp and Mgo
MGo/Ar Angle constructed from the two rays MGo and GoAr
NS/Gn (Y-axis) Angle constructed from the two rays NS and SGn
The Kruskal–Wallis test on all 880 subjects revealed a statistically significant influence of age on distance ‘p’ (P = 0.034), but no impact on distance ‘t’ (P = 0.208). This association with ‘p’ can also be seen when compar-ing Figures 2 and 3. The Loess interpolation line shows in
Figure 2 a slight, but continuous increase of ‘p’ of about 1.03 mm over the 11-year period. In Figure 3, the Loess interpolation line demonstrates that ‘t’ decreases slightly between 6 and 12 years of age and then increases again up to 17 years of age.
The investigation on the association of gender to dis-tances ‘t’ and ‘p’ found no important influence. Only in the 9-year age group, significant differences between the gen-ders for distances ‘t’ (P-value 0.009) and ‘p’ (P-value 0.002) were found. The statistical results are given in Tables 4 and
5 for distances ‘p’ and ‘t’, respectively.
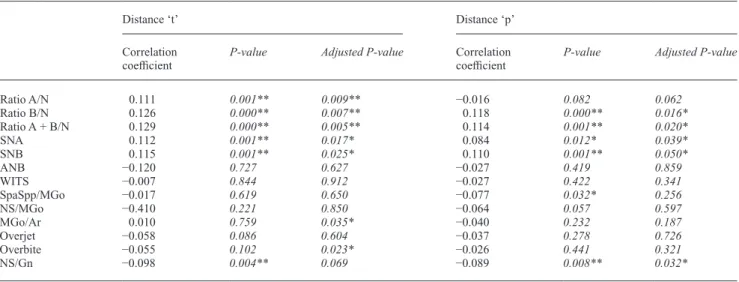
The Spearman correlation analysis revealed several sta-tistically significant correlations between the distances ‘t’ and ‘p’ and cephalometric parameters. The results of the correlation analysis, including the partial parametric cor-relation analysis adjusted for age, gender, and predictors, are presented in Table 6. Significant positive correlations for distance ‘t’ and ‘p’ were found with the cephalomet-ric values of ratio B/N, ratio A + B/N, SNA, SNB, and a significant negative correlation with NS/Gn. For dis-tance ‘p’, a further negative correlation with SpaSpp/ MGo was observed. The two last parameters (NS/Gn and SpaSpp/MGo) did, however, not correlate significantly when adjusted for age, gender, and the other parameters. Moreover, all mentioned significant correlations had small correlation coefficients, and it is remarkable that no correlations to ANB were found neither for distance ‘t’ nor for distance ‘p’.
Variables that showed statistical tendencies (P < 0.1) or associations with distance ‘p’ and distance ‘t’ were chosen for multiple regression model investigations. These are pre-sented in Table 7 for distance ‘t’ and Table 8 for distance ‘p’, with the possible variables listed for ‘t’ an ‘p’ separately. The adjusted coefficient of determination (R2) of the
mul-tiple linear regression model was 0.18 for distance ‘p’ and 0.31 for distance ‘t’, indicating the inherent insufficiency of the model to adequately predict ‘p’ or ‘t’.
Discussion
Rationale behind this study and the parameters used
This study investigated the pharyngeal airway dimen-sions based on 880 lateral cephalometric radiographs from healthy, orthodontically untreated children aged 6–17 years. It is the first attempt to establish reference values of airway Figure 1 Cephalometric points and pharyngeal distances used in this
study: distance ‘p’ and ‘t’. New cephalometric distances introduced (thick black lines): Distance to N, A, and B. All distances are measured to a line through S, perpendicular to the Frankfort horizontal plane.
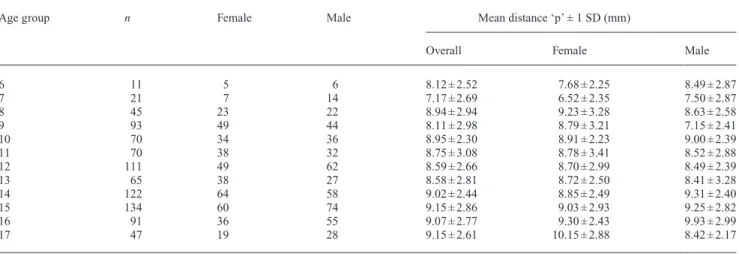
Table 2 Gender distribution and mean values with standard deviation (SD) for airway distance ‘p’ according to age and gender (n = 880 in total).
Age group n Female Male Mean distance ‘p’ ± 1 SD (mm)
Overall Female Male
6 11 5 6 8.12 ± 2.52 7.68 ± 2.25 8.49 ± 2.87 7 21 7 14 7.17 ± 2.69 6.52 ± 2.35 7.50 ± 2.87 8 45 23 22 8.94 ± 2.94 9.23 ± 3.28 8.63 ± 2.58 9 93 49 44 8.11 ± 2.98 8.79 ± 3.21 7.15 ± 2.41 10 70 34 36 8.95 ± 2.30 8.91 ± 2.23 9.00 ± 2.39 11 70 38 32 8.75 ± 3.08 8.78 ± 3.41 8.52 ± 2.88 12 111 49 62 8.59 ± 2.66 8.70 ± 2.99 8.49 ± 2.39 13 65 38 27 8.58 ± 2.81 8.72 ± 2.50 8.41 ± 3.28 14 122 64 58 9.02 ± 2.44 8.85 ± 2.49 9.31 ± 2.40 15 134 60 74 9.15 ± 2.86 9.03 ± 2.93 9.25 ± 2.82 16 91 36 55 9.07 ± 2.77 9.30 ± 2.43 9.93 ± 2.99 17 47 19 28 9.15 ± 2.61 10.15 ± 2.88 8.42 ± 2.17
dimensions based on a large growth study. Limitations of lateral cephalometry in airway studies have been dis-cussed (Lowe et al., 1986; Battagel and L’Estrange, 1996;
Finkelstein et al., 2001), particularly the inadequate repre-sentation of upper airway structures in a two-dimensional (2D) radiograph. Information is obviously lost on the trans-verse airway dimension, and its value as a diagnostic tool has been questioned, as a solid assessment of airway dimen-sions would require a three-dimensional (3D) imaging technique such as computerized tomography or magnetic resonance imaging (MRI; Lowe et al., 1986; Rodenstein
et al., 1990).
The upper airway is not a rigid structure and its dimen-sions are influenced by many factors. These include supine
or upright positioning, awake or asleep muscle tone, inspi-ration or expiinspi-ration, duinspi-ration of X-ray exposure, and mouth opening. Considering these circumstances, it becomes evi-dent that even a 3D radiographic representation does not account for the true clinical circumstances under which SDB and particularly OSA may occur.
In a 3D Cone-beam computed tomography (CBCT) study comparing OSA to non-OSA patients, only the smallest cross-section airway area was found to be significantly dif-ferent between the two groups (Ogawa et al., 2007). Hence, only the smallest cross-section airway area, i.e. the ante-rior–posterior dimension, seems to be of clinical relevance. This observation was recently substantiated by another study demonstrating lateral cephalogram to be a valid
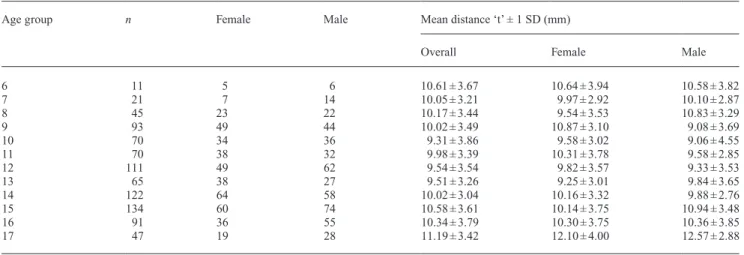
Table 3 Gender distribution and mean values with standard deviation (SD) for airway distances ‘t’ according to age and gender (n = 880 in total).
Age group n Female Male Mean distance ‘t’ ± 1 SD (mm)
Overall Female Male
6 11 5 6 10.61 ± 3.67 10.64 ± 3.94 10.58 ± 3.82 7 21 7 14 10.05 ± 3.21 9.97 ± 2.92 10.10 ± 2.87 8 45 23 22 10.17 ± 3.44 9.54 ± 3.53 10.83 ± 3.29 9 93 49 44 10.02 ± 3.49 10.87 ± 3.10 9.08 ± 3.69 10 70 34 36 9.31 ± 3.86 9.58 ± 3.02 9.06 ± 4.55 11 70 38 32 9.98 ± 3.39 10.31 ± 3.78 9.58 ± 2.85 12 111 49 62 9.54 ± 3.54 9.82 ± 3.57 9.33 ± 3.53 13 65 38 27 9.51 ± 3.26 9.25 ± 3.01 9.84 ± 3.65 14 122 64 58 10.02 ± 3.04 10.16 ± 3.32 9.88 ± 2.76 15 134 60 74 10.58 ± 3.61 10.14 ± 3.75 10.94 ± 3.48 16 91 36 55 10.34 ± 3.79 10.30 ± 3.75 10.36 ± 3.85 17 47 19 28 11.19 ± 3.42 12.10 ± 4.00 12.57 ± 2.88
n denotes the amount of subjects in every age group.
age (y) 17 16 15 14 13 12 11 10 9 8 7 6 5 distance "p" (mm) 20 18 16 14 12 10 8 6 4 2 0 Distance ″p″
Figure 2 Graphical distribution of airway distance ‘p’ corresponding to
the age of the subjects (n = 880) and Loess interpolation line.
age (y) 17 16 15 14 13 12 11 10 9 8 7 6 5 distance "t" (mm) 26 24 22 20 18 16 14 12 10 8 6 4 2 0 Distance ″t″
Figure 3 Graphical distribution of airway distance ‘t’ corresponding to
imaging method and a good screening tool when compared to MRI: the measuring dimensions of the nasopharyngeal and retropalatal region in children correlated significantly to MRI findings, and both techniques revealed the nar-rowest measurement to be the anterior–posterior distance located in the retropalatal region (Pirilä-Parkkinen et al., 2011). Finally, a systematic review concluded that lateral cephalometrics can be considered a reliable initial screen-ing tool of upper airway obstruction (Major et al., 2006). It is safe to presume that although an airway assessment based on cephalograms will be limited on a 2D depiction of the airway, it nevertheless will represent the critical and pivotal distances for airway patency. Conventional lateral cephalogram remains therefore not only a solid and routine diagnostic tool for orthodontics but also a legitimate instru-ment for airway measureinstru-ments (Aboudara et al., 2009).
Distances ‘t’ and ‘p’ and the influence of age
In the present study, the smallest distance from soft palate to the posterior pharyngeal wall, i.e. distance ‘p’, known also as McNamara’s line was used. Even though no consensus exists concerning the measurements of the nasopharynx, this dis-tance is the only one with some validation from multiple stud-ies (Major et al., 2006). Dimension ‘t’ on the other hand is the most widely used measurement of the retroglossal dimension.
The measurement results of distances ‘p’ and ‘t’ show high interindividual variations, but only small differences between the different age groups. The individual variation of the param-eters measured is substantial enough to render the use of mean values, when applied to individual cases, as questionable.
This study illustrates that distance ‘t’ decreases slightly between 6 and 12 years of age and then increases slightly up to 17 years of age. The results for distance ‘t’ are in
Table 4 Descriptive analysis (mean, median, interquartile range ‘IQR’) for ‘p’ at all ages (n = 880 in total).
Age group Female distance ‘p’ Male distance ‘p’ Significance
Mean (mm) Median (mm) IQR (mm) Mean (mm) Median (mm) IQR (mm) P-value
6 7.68 8.06 3.95 8.49 9.02 3.29 0.329 7 6.52 6.08 2.11 7.49 7.18 4.52 0.535 8 9.23 8.60 4.70 8.62 8.52 3.29 0.776 9 8.97 9.06 4.05 7.15 7.24 4.20 0.002* 10 8.91 9.06 3.67 9.00 9.03 2.97 0.953 11 8.78 8.40 3.63 8.52 8.37 4.32 0.944 12 8.70 8.54 4.60 8.49 8.25 3.35 0.719 13 8.72 8.94 3.57 8.41 8.06 2.22 0.418 14 8.85 9.00 3.37 9.31 9.14 2.99 0.232 15 9.03 8.74 3.62 9.25 9.06 3.90 0.562 16 9.30 9.50 2.93 8.92 9.22 4.40 0.518 17 9.90 9.75 3.55 8.70 8.74 2.52 0.078
P-value of Mann–Whitney U-test is given to demonstrate significant differences between genders; P-values are written in italics. *Significance level set at the 0.05 level.
Table 5 Descriptive analysis (mean, median, interquartile range ‘IQR’) for ‘t’ at all ages (n = 880 in total).
Age group Female distance ‘t’ Male distance ‘t’ Significance
Mean (mm) Median (mm) IQR (mm) Mean (mm) Median (mm) IQR (mm) P-value
6 10.64 11.00 7.73 10.58 9.66 7.15 1.000 7 9.97 9.06 5.65 10.09 9.63 4.79 0.913 8 9.54 8.54 4.46 10.83 11.29 4.95 0.195 9 10.87 10.44 4.09 9.08 8.77 5.19 0.009* 10 9.58 9.08 4.71 9.06 9.77 4.58 0.350 11 10.31 10.13 5.18 9.58 9.61 4.04 0.604 12 9.82 9.85 5.73 9.33 9.06 4.50 0.354 13 9.25 9.22 4.89 9.84 9.06 6.27 0.786 14 10.16 9.22 4.59 9.88 9.85 4.67 0.689 15 10.14 9.75 4.67 10.94 10.75 3.68 0.167 16 10.29 9.22 5.65 10.36 10.05 3.66 0.929 17 11.59 11.78 5.09 10.41 9.93 4.37 0.170
P-value of Mann–Whitney U-test is given to demonstrate significant differences between genders; P-values are written in italics. *Significance level set at the 0.05 level.
agreement with earlier studies (McNamara, 1984; Ogawa
et al., 2007; Hanggi et al., 2008; Alves et al., 2012). The observed initial decrease of ‘t’ could probably be attrib-uted to the distinct growth pattern of the tongue, which resembles neural growth pattern. Thus, during the juvenile phase, tongue growth will be more intense compared to the growth of all its surrounding structures, which follow vis-ceral growth pattern. It is this disparity that possibly causes the initial decrease of distance ‘t’. Distance ‘p’ displayed a slight continuous increase of about 1.03 mm between 6 and 17 years of age. This increase is also confirmed by
McNamara (1984) and is probably related to the decline of the adenoid size during this growth period. However, caution should be applied when interpreting the small yet statistically significant age-related increase, as a large inter-individual distribution, which can be observed similarly for both airway measurements, is very apparent.
Considering how abundant craniofacial growth and development is between 6 and 17 years of age, it is con-trary to expectation that no radical change in the upper air-way dimensions was found. It seems that the upper airair-way dimensions are formed and matured in the early periods of growth, and those years seem to be of high relevance to ensure the later physiological need of an adequate airflow.
Influence of gender and cephalometric variables on distances ‘t’ and ‘p’
Sexual dimorphism in craniofacial dimensions is a fact that has been established in various analyses (Schudy, 1965;
Bishara and Jakobsen, 1985; Siriwat and Jarabak, 1985;
Nanda, 1988). Yet, maybe surprisingly, there were no differ-ences in airway dimensions of distance ‘t’ and ‘p’ between
Table 6 Spearman correlation analysis providing correlation coefficients and P-values for distance ‘t’ and distance ‘p’ (for both genders and all ages).
Distance ‘t’ Distance ‘p’
Correlation
coefficient P-value Adjusted P-value Correlation coefficient P-value Adjusted P-value
Ratio A/N 0.111 0.001** 0.009** −0.016 0.082 0.062 Ratio B/N 0.126 0.000** 0.007** 0.118 0.000** 0.016* Ratio A + B/N 0.129 0.000** 0.005** 0.114 0.001** 0.020* SNA 0.112 0.001** 0.017* 0.084 0.012* 0.039* SNB 0.115 0.001** 0.025* 0.110 0.001** 0.050* ANB −0.120 0.727 0.627 −0.027 0.419 0.859 WITS −0.007 0.844 0.912 −0.027 0.422 0.341 SpaSpp/MGo −0.017 0.619 0.650 −0.077 0.032* 0.256 NS/MGo −0.410 0.221 0.850 −0.064 0.057 0.597 MGo/Ar 0.010 0.759 0.035* −0.040 0.232 0.187 Overjet −0.058 0.086 0.604 −0.037 0.278 0.726 Overbite −0.055 0.102 0.023* −0.026 0.441 0.321 NS/Gn −0.098 0.004** 0.069 −0.089 0.008** 0.032*
Additionally, the adjusted P-values of the partial parametric correlation analysis adjusted for age, gender, and all predictors are given; P-Values are written in italics.
*Correlation is significant at the 0.05 level (two-tailed). **Correlation is significant at the 0.01 level (two-tailed).
Table 7 Multiple linear regressions on 880 observations (both genders and all ages) for explanation of distance ‘t’. SE, standard error. Distance ‘t’ Coefficient SE P-value Go-Pg 0.100 0.024 0.000** WITS 0.099 0.047 0.037* MGo/Ar 0.069 0.025 0.006** Overbite −0.133 0.061 0.029* Ratio B/N 4.301 1.898 0.024*
Possible variables were Go-Pg, WITS, MGo/Ar, overbite, ‘ratio B/N’; P-Values are written in italics.
*Correlation is significant at the 0.05 level. **Correlation is significant at the 0.01 level.
Table 8 Multiple linear regressions on 880 observations (both genders and all ages) for explanation of distance ‘p’. SE, standard error. Distance ‘p’ Coefficient SE P-value Go-Pg 0.031 0.018 0.820 SNB 0.102 0.038 0.007** SpaSpp/Mgo −0.730 0.034 0.031* SN/Mgo −0.084 0.039 0.031*
Possible variables were Go-Pg, SNB, SpaSpp/MGo, SN/Mgo; P-Values are written in italics.
*Correlation is significant at the 0.05 level. **Correlation is significant at the 0.01 level.
male and female subjects. In general, women are smaller in stature than men (having less muscle mass and smaller heads) and subsequently require less oxygen. If airways in women are of similar dimensions to those in men, it follows that their airways must be larger in relative terms and this may be one of the reasons that women would be less prone to OSA than men. Further studies are, however, needed to substantiate this hypothesis. It may be of importance that females have smaller cross-sectional area of the tongue than males measured from lateral cephalograms and that females reach adult values ear-lier (Cohen and Vig, 1976). One may question the validity of cephalometric measurements on tongue size, but a highly significant correlation has been found between lingual vol-ume measured on MRI and the area of the lingual shadow measured on profile radiographs (Liegeois et al., 2010).
Only few and weak correlations of ‘p’ and ‘t’ to the cephalometric landmarks were found. In fact, no correla-tions were found to otherwise important variables such as the angle of the mandible or skeletal class (e.g. ANB or WITS). A significant, however weak, correlation could be established to the pro- and retrognathism of the maxilla and mandible and to the Y-axis.
The evaluated coefficient of determination R2 for the
regression models for distance ‘p’ and ‘t’, respectively, indicates that the established model will not fit any future data very well. This corroborates the observation that asso-ciations between airway dimensions and other craniofacial measurements are weak and are partly contrary to other stud-ies (Abu Allhaija and Al-Khateeb, 2005; Alves et al., 2012). Conclusion
Based on the data of the examined population, the follow-ing observation can be made: the mean value of distance ‘p’ increases continuously from age 6 (8.12 mm) to age 17 (9.15 mm). The mean value of distance ‘t’ decreases from age 6 (10.61 mm) to age 10 (9.31 mm), but increases after-wards again up to age 17 (11.19 mm). However, both dis-tances ‘p’ and ‘t’ show high interindividual variations and render the use of a mean value as reference on individu-als questionable. Small differences between the different age groups could be observed, but no differences between the genders. Only weak correlations of distances ‘p’ and ‘t’ to certain cephalometric landmarks were found, but no correlation with ANB. The results show that upper airway dimensions in growing children from 6 to 17 years of age remain remarkably stable on average and suggest that the airway dimensions are being established in early childhood. References
Aboudara C, Nielsen I, Huang J C, Maki K, Miller A J, Hatcher D 2009 Comparison of airway space with conventional lateral headfilms and 3-dimensional reconstruction from cone-beam computed tomography. American Journal of Orthodontics and Dentofacial Orthopedics 135: 468–479
Abu Allhaija E S, Al-Khateeb S N 2005 Uvulo-glosso-pharyngeal dimensions in different anteroposterior skeletal patterns. The Angle Orthodontist 75: 1012–1018
Alves M Jr, Franzotti E S, Baratieri C, Nunes L K, Nojima L I, Ruellas A C 2012 Evaluation of pharyngeal airway space amongst different skeletal pat-terns. International Journal of Oral and Maxillofacial Surgery 41: 814–819 Battagel J M, L’Estrange P R 1996 The cephalometric morphology of
patients with obstructive sleep apnoea (OSA). European Journal of Orthodontics 18: 557–569
Battagel J M, Johal A, Kotecha B 2000 A cephalometric comparison of subjects with snoring and obstructive sleep apnoea. European Journal of Orthodontics 22: 353–365
Bishara S E, Jakobsen J R 1985 Longitudinal changes in three normal facial types. American Journal of Orthodontics 88: 466–502
Bollhalder J, Hanggi M P, Schatzle M, Markic G, Roos M, Peltomaki T A 2013 Dentofacial and upper airway characteristics of mild and severe class II division 1 subjects. European Journal of Orthodontics 35: 447–453 Carra M C, Bruni O, Huynh N 2012 Topical review: sleep bruxism, head-aches, and sleep-disordered breathing in children and adolescents. Journal of Orofacial Pain 26: 267–276
Cleveland W S, McGill R 1985 Graphical perception and graphical meth-ods for analyzing scientific data. Science 4716: 828–833
Cohen A M, Vig P S 1976 A serial growth study of the tongue and inter-maxillary space. The Angle Orthodontist 46: 332–337
de Freitas M R, Alcazar N M, Janson G, de Freitas K M, Henriques J F 2006 Upper and lower pharyngeal airways in subjects with class I and class II malocclusions and different growth patterns. American Journal of Orthodontics and Dentofacial Orthopedics 130: 742–745
Federal Authorities of the Swiss Confederation 2011 Expertenkommission für das Berufsgeheimnis in der medizinischen Forschung. Sonderbewilligung zur Offenbarung des Berufsgeheimnisses zu Forschungszwecken im Bereich der Medizin und des Gesundheitswesens. Bundesblatt 2011: 7640–7642
Finkelstein Y et al. 2001 Frontal and lateral cephalometry in patients with sleep-disordered breathing. The Laryngoscope 111: 634–641
Flores-Mir C, Korayem M, Heo G, Witmans M, Major M P, Major P W 2013 Craniofacial morphological characteristics in children with obstructive sleep apnea syndrome: a systematic review and meta-analy-sis. Journal of the American Dental Association 144: 269–277
Guijarro-Martinez R, Swennen G R 2011 Cone-beam computerized tomography imaging and analysis of the upper airway: a systematic review of the literature. International Journal of Oral and Maxillofacial Surgery 40: 1227–1237
Hanggi M P, Teuscher U M, Roos M, Peltomaki T A 2008 Long-term changes in pharyngeal airway dimensions following activator-headgear and fixed appliance treatment. European Journal of Orthodontics 30: 598–605 Katyal V, Pamula Y, Martin A J, Daynes C N, Kennedy J D, Sampson W
J 2013 Craniofacial and upper airway morphology in pediatric sleep-disordered breathing: systematic review and meta-analysis. American Journal of Orthodontics and Dentofacial Orthopedics 143: 20–30 Kuhnel T S, Schurr C, Wagner B, Geisler P 2005 Morphological changes
of the posterior airway space after tongue base suspension. The Laryngoscope 115: 475–480
Liegeois F, Albert A, Limme M 2010 Comparison between tongue volume from magnetic resonance images and tongue area from profile cephalo-grams. European Journal of Orthodontics 32: 381–386
Lowe A A, Gionhaku N, Takeuchi K, Fleetham J A 1986 Three-dimensional CT reconstructions of tongue and airway in adult subjects with obstruc-tive sleep apnea. American Journal of Orthodontics and Dentofacial Orthopedics 90: 364–374
Major M P, Flores-Mir C, Major P W 2006 Assessment of lateral cepha-lometric diagnosis of adenoid hypertrophy and posterior upper airway obstruction: a systematic review. American Journal of Orthodontics and Dentofacial Orthopedics 130: 700–708
Marcus C L 2000 Sleep-disordered breathing in children. Current Opinion in Pediatrics 12: 208–212
Martin S E, Mathur R, Marshall I, Douglas N J 1997 The effect of age, sex, obesity and posture on upper airway size. European Respiratory Journal 10: 2087–2090
McNamara J A Jr 1984 A method of cephalometric evaluation. American Journal of Orthodontics 86: 449–469
Nanda S K 1988 Patterns of vertical growth in the face. American Journal of Orthodontics 93: 103–116
Ogawa T, Enciso R, Shintaku W H, Clark G T 2007 Evaluation of cross-section airway configuration of obstructive sleep apnea. Oral Surgery, Oral Medicine, Oral Pathology, Oral Radiology, and Endodontics 103: 102–108
Papaioannou G, Kambas I, Tsaoussoglou M, Panaghiotopoulou-Gartagani P, Chrousos G, Kaditis A G 2013 Age-dependent changes in the size of adenotonsillar tissue in childhood: implications for sleep-disordered breathing. Journal of Pediatrics 162: 269–274
Peltomäki T 2007 The effect of mode of breathing on craniofacial growth--revisited. European Journal of Orthodontics 29: 426–429
Pirilä-Parkkinen K, Löppönen H, Nieminen P, Tolonen U, Pirttiniemi P 2010 Cephalometric evaluation of children with nocturnal sleep-disor-dered breathing. European Journal of Orthodontics 32: 662–671 Pirilä-Parkkinen K, Löppönen H, Nieminen P, Tolonen U, Paakko E,
Pirttiniemi P 2011 Validity of upper airway assessment in children: a clini-cal, cephalometric, and MRI study. The Angle Orthodontist 81: 433–439 Rodenstein D O et al. 1990 Pharyngeal shape and dimensions in healthy
subjects, snorers, and patients with obstructive sleep apnoea. Thorax 45: 722–727
Schudy F 1965 The rotation of the mandible resulting from growth: its implications in orthodontic treatment. The Angle Orthodontist 35: 36–50 Siriwat P P, Jarabak J R 1985 Malocclusion and facial morphology is there a relationship? An epidemiologic study. The Angle Orthodontist 55: 127–138
Young T, Peppard P E, Gottlieb D J 2002 Epidemiology of obstructive sleep apnea: a population health perspective. American Jounral of Respiratory and Critical Care Medicine 165: 1217–1239