REGULAR ARTICLE
Plant species from mesotrophic wetlands cause relatively
high methane emissions from peat soil
Albert Koelbener&Lena Ström&
Peter J. Edwards&Harry Olde Venterink
Received: 30 October 2008 / Accepted: 27 March 2009 / Published online: 24 April 2009
# Springer Science + Business Media B.V. 2009
Abstract Plants can influence methane emissions from wetland ecosystems by altering its production, consumption and transport in the soil. The aim of this study was to investigate how eight vascular plant species from mesotrophic to eutrophic wetlands vary in their influence on CH4 emissions from peat cores, under low and high N supply. Additionally, we measured the production of low-molecular-weight organic acids (LOA) by the same species (also at low and high N supply), because LOA form a substrate for methanogenesis. There were considerable differences among species in their effects upon rates of CH4 emission. Six of the species (Eriophorum latifolium Hoppe, Potentilla palustris (L.) Scop., Anthoxanthum odoratum (L.) s. str., Carex rostrata Stokes, Carex elata All., Carex acutiformis Ehrh.) increased CH4 emissions up to five times compared to control peat cores without plants, whereas two species (Phalaris arundinacea L., Phragmites australis (Cav.) Trin. ex
Steud.) had no effect. There was a weak negative correlation between plant biomass and CH4emission. N addition had no significant general effect upon CH4 emission. LOA production varied considerably among species, and tended to be highest for species from mesotrophic habitats. LOA production was stimulated by N addition. We conclude that some species from mesotrophic wetlands tend to cause higher CH4 emissions than species from eutrophic wetlands. This pattern, which contradicts what is often mentioned in literature, may be explained by the higher LOA production rates of species adapted to less productive habitats.
Keywords Adaptation . Biomass . Ecological traits . Greenhouse gas . Nitrogen . Organic acids . Peat . Root exudation . Vascular plants
Introduction
Methane (CH4) is an important greenhouse gas, estimated to be responsible for almost 20% of the radiative forcing from long-lived and globally mixed greenhouse gases (IPCC 2007). Natural wetlands are among the most important sources of CH4, estimated to account for 90% of natural emissions and one third of total emissions (IPCC2007).
Plants can have a strong effect upon the emission of CH4from wetland ecosystems, apparently because they influence the production, consumption and transport of CH4in the soil (Christensen et al.2003;
Responsible Editor: Per Ambus.
A. Koelbener (*)
:
P. J. Edwards:
H. Olde Venterink Institute of Integrative Biology, Plant Ecology, ETH Zurich,Universitätstrasse 16, 8092 Zurich, Switzerland e-mail: koelbener@env.ethz.ch L. Ström
Department of Physical Geography and Ecosystems Analysis, GeoBiosphere Science Centre, Lund University, Sölvegatan 12,
Joabsson et al.1999; Saarnio et al.2004; Ström et al.
2003; Whiting and Chanton1992). In some cases, as much as 90–98% of the CH4 efflux from inundated sites has been associated with vascular plants (Joabsson et al. 1999; Verville et al. 1998). Three main mech-anisms are known through which vascular plants influence CH4emissions from wetland soils: (1) plant roots continuously release organic compounds into the rhizosphere, which are easily available C-sources for methanogenesis (Ström et al. 2003); (2) CH4 moves through the aerenchyma tissue of the roots, rhizomes and dead or living stems to the atmosphere, thereby escaping oxidation in aerobic soil layers—the conduit or chimney effect (Verville et al.1998); (3) plants bring oxygen into the rhizosphere, which inhibits methano-genic archaea, and fuels CH4 oxidation (Van der Nat and Middelburg1998). Only a few plant species have been studied for their influence on CH4 emission; however, these have shown large variation (Ding et al.
2005; Joabsson and Christensen 2001; Laine et al.
2007; Ström et al. 2005), suggesting that changes in the species composition of wetlands—either as a consequence of climate change or through some other process—could have a considerable effect on CH4 emissions (Christensen et al. 2004; Johansson et al.
2006). But to be able to predict such effects, more species need to be investigated and the relative importance of the various mechanisms by which plants influence CH4emissions need to be better understood. Many wetlands throughout the world are subjected to nutrient enrichment, which may increase the produc-tivity of the vegetation and lead to changes in species composition (Bedford et al1999, Olde Venterink et al
2002, Galloway et al2004, Bragazza et al2006). Some authors have concluded that CH4 emissions tend to increase with increasing wetland productivity because rates of root exudation, as well as and gas exchange via the conduit effect, are likely to be larger for big plants than for small ones and hence to be positively related to plant biomass (cf. Ding et al. 2003; Joabsson and Christensen 2001; Waddington et al. 1996; Whiting and Chanton1993). However, it could also be argued that, because plant roots tend to produce more exudates under nutrient-poor conditions as a mechanism to increase phosphorus availability (Hinsinger 2001; Lu et al.1999; Marschner1998; Neumann and Römheld
1999; Ström 1997), CH4 emissions are likely to be higher in nutrient poor wetlands. In view of the different mechanisms by which plants may influence
CH4emissions, it is unclear whether there is a general tendency for species of eutrophic sites to enhance CH4 emission more than species from mesotrophic sites, or vice versa.
The main aim of this study was to investigate how eight vascular plant species from meso- to eutrophic wetlands vary in their influence upon CH4emissions. Additionally, we investigated whether N fertilisation influences the effects of plants on CH4emission. In a separate experiment we investigated how the selected plant species differ in root production of low-molecular-weight organic acids (LOA). It was our objective to evaluate the effects of differences in plant biomass production, fertility of the natural habitat, as well as root LOA production of the species. Our hypotheses were: (I) Vascular plants increase CH4emissions from peat. (II) N fertilisation results in higher CH4 emission rates because it stimulates plant productivity and it may also increase root exudation because of induced P-limitation.
(III) Plant species from eutrophic wetlands have a larger effect upon CH4 emission rates than species from less productive wetlands. This hypothesis is based on the assumption that plant size has a larger effect upon emissions than inherent species differences in production of root exudates.
Materials and methods
Experiment I: Influence of plant species on CH4 emission from peat cores
This first experiment was designed to compare the influence of eight plant species on CH4emission from peat soil. We compared the following species with each other and with a control (bare soil): Eriophorum latifolium Hoppe, Potentilla palustris (L.) Scop., Carex rostrata Stokes, Anthoxanthum odoratum (L.) s. str., Carex elata All., Carex acutiformis Ehrh., Phragmites australis (Cav.) Trin. ex Steud., and Phalaris arundi-nacea L. The species differ with respect to fertility of the habitats in which they normally occur, varying from mesotrophic to eutrophic wetlands. We ordered the species according to the fertility indication values of Ellenberg et al. (1991) and Bakkenes et al. (2002) (see AppendixA). Anthoxanthum odoratum, Phalaris
arundinacea and Phragmites australis were grown from seeds collected in the field (NE Switzerland), Carex rostrata, Carex elata and Carex acutiformis were propagated from tillers collected in the field. Wild types of Potentilla palustris and Eriophorum latifolium were bought commercially (Die Wildstaudengärtnerei, Eschenbach, Switzerland).
Plants were grown in undisturbed peat cores (one plant per core, or in the case of Eriophorum latifolium two small plants). Peat for the experiment was taken from a wet, mesotrophic fen in Nussbaumen near Frauenfeld, Switzerland, where atmospheric N-deposition is 15–20 kg ha−1 y−1 (BUWAL 2005). Although it would have been convenient to use a homogenised peat-substrate, the processes of sieving and mixing of peat would have severely altered the microbial community and increased carbon mineral-ization. We therefore decided to grow the plants in intact peat cores, accepting that inhomogeneities in the substrate would probably lead to variation among replicates. To minimize this variation, all material was collected from a small (10 m2) area where the top 40 cm of the soil had been removed the week before. Peat cores (2.2 l) were collected by driving PVC cylinders (19 cm depth, 12.2 cm diameter) into the peat, taking care not to compact the material, and closing the bottoms with gas-tight lids.
Half of the cores in the experiment were fertilized with N (100 mg N (NH4NO3) per pot during the experiment), while the other half remained unfertil-ized (equally distributed among plant species and bare soil). We fertilized with N because it was growth-limiting: in a preliminary experiment using the same peat material, Anthoxanthum odoratum plants were supplied with N, P, N+P, and growth was compared with an unfertilized control. Only the addition of N caused a significant increase in biomass (ANOVA: F(1,17)=23.48; P=0.0015). At the end of the experi-ment NH4, NO3, PO4 and K concentrations were measured in the soil solution of five fertilised and five unfertilised cores. Nitrate was below the detection limit, whereas NH4, PO4 and K concentrations were on average 0.13, 0.03 and 0.54 mg/l in unfertilised, and 0.20, 0.02 and 0.50 mg/l in the fertilised treatments respectively.
The experiment was carried out in a greenhouse in Zurich, Switzerland, between June and October 2006. The water level in the cylinder was maintained at 2 cm below the peat surface, throughout the experiment
with deionised water. This could be monitored from outside by means of a tube connected to the base of the peat core. There was no visible growth of algae. All treatments were replicated ten times, yielding a total of 180 pots (eight species +bare control soil * two (with/without N) * ten replicates).
Methane emissions were measured using a closed chamber technique. Pots were placed in water-filled vessels (32 cm in diameter; 4 cm high) twelve hours before sampling. In order to take air samples, Plexiglas chambers were placed on top of the vessels immedi-ately before the sampling. Chambers of two different volumes were used (15.2 or 27.1 litre), depending on the size of the plants. Head-space samples were taken with syringes through a rubber stopper with an inbuilt three-way stopcock. Samples were instantly trans-ferred into evacuated vials with rubber septa. Four samples were taken from each pot at six-minute intervals. Methane concentrations were determined using a gas chromatograph (6890 N, Agilent Technol-ogies, California, USA) equipped with a Porapak Q column (80/120 mesh) and a flame ionization detector. Samples were injected using an auto sampler (222xc Sample Changer, Gilson, Wisconsin, USA) and cali-brated with several calibration gases injected every nine to 12 samples. The CH4emission rate of each pot was determined by linear regression of the four repeated headspace CH4concentrations in the cham-ber. In case of significant methane emission rates R2 -values were high (generally >0.7). If emission rates were very low or negligible, R2-values could also be low (<0.5) due to bias around zero. The sampling of one full replicate (eight species +one control times two N treatments=18 pots) took half a day; thus all 180 pots were sampled over five consecutive days. We varied the sample time of different species through-out the day. The CH4emission rates of all cores were measured for all cores between 25 and 30 September 2006.
After the CH4measurements, the roots and shoots of all plants were harvested, dried at 70ºC for 48 h, and weighed.
Experiment II: Organic acid production of plant species
In a second experiment, we grew the same eight plant species in nutrient solutions to determined interspe-cific differences in the production of low molecular
weight organic acids (LOA) such as acetate, formate and oxalate. These LOAs may either be exuded directly by roots or, more likely, result in the fermentation of larger acids and carbohydrates from plant root exudates (Dessureault-Rompré et al. 2007). The plants used for this experiment had been grown on peat cores collected from the same 10 m2 as in Experiment I. They had been growing in the same greenhouse and for the same period (five months) as the plants in Experiment I. At the time for harvesting of Experiment I, we transferred the plants into nutrient solutions. Plants were grown in a low-N or a high-N nutrient solution to simulate differences in N availability, just as in Experiment I. The Low-N solution was a 1/10 dilution of a full strength solution containing 57 g/l Ca (NO3)2·4H2O, 12.7 g/l NH4NO3, 13.2 g/l HK2PO4, 26.6 g/l MgSO4·7H2O, 0.1 g/l ZnSO4·7H2O, 0.02 g/l CuSO4·5H2O, 0.5 g/l H3BO3, 0.02 g/l NA2MoO4·H2O and 4.4 g/l Cl3Fe (Modified Hoagland solution after Steiner1961). The high-N solution contained twice as much NH4NO3 (and therefore had a N:P ratio of 10 instead of 5). All other nutrients were the same in both N-treatments. Both N treatments were replicated four times in a full factorial design, yielding 64 plants (eight species * two N treatments * four replicates). The plants grew in the nutrient solutions for three weeks; the solutions were exchanged weekly. After three weeks, all plants had produced new roots and the nutrient solutions were exchanged for the last time. Subsequently after three days of incubation, samples were taken and analysed for acetate, formate, oxalate, citrate, malate, lactate and propionate by ion chromatography (Dionex autosampler system, AS 11 column, eluent generator: potassium hydroxide (1 to 60 mM), flow: 1.5 ml min−1). Unfortunately, all plants of Potentilla palustris died in the nutrient solution, so that no data were obtained for this species.
Statistics
Differences in CH4 emission and LOA production rates were tested by means of one-way ANOVAs. All data were log-transformed. ANOVAs were carried out with species and nitrogen as factors and root biomass and/or shoot biomass as co-variables. For analyses that included the pots without plants (control), or target variables calculated per gram biomass (root or shoot), only the factors species and nitrogen were fitted. All models were determined by the AICc criterion
(Burnham and Anderson2002). Multiple comparisons between pairs of means were carried out with the Tukey test (Zar 1999). All analyses were performed using the statistical software R, version 2.6.2 (R Development Core Team2006).
Results
Variation in biomass among plant species and effect of N addition (Experiment I)
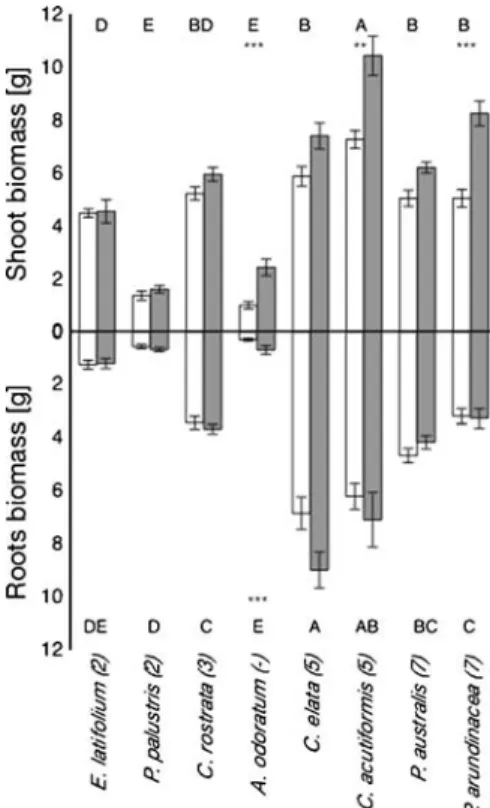
Biomass varied widely among the eight plant species (Fig.1), with Carex elata, Carex acutiformis, Phrag-mites australis and Phalaris arundinacea having significantly higher shoot and root biomasses than Eriophorum latifolium, Potentilla palustris and
Fig. 1 Mean root and shoot biomass (dry) of the eight wetland plant species of the experiment with plants in peat cores. Species are ordered according to the fertility index (N-values) of Ellenberg et al. (1991) increasing from left to right (see AppendixA). White bars are unfertilised plants, shaded bars are N-fertilised. Error bars show SE of 10 replicates. Stars indicate significant differ-ences in biomass of a species due to N fertilisation (*P≤0.05; **P≤0.01; ***P≤0.001), letters show significant differences between species (P≤0.05)
Anthoxanthum odoratum. However, it was not always the species from mesotrophic habitats (Eriophorum latifolium, Potentilla palustris and Carex rostrata) that produced the lowest biomass (Fig. 1). N addition significantly increased the shoot biomass of Anthox-anthum odoratum, Carex acutiformis and Phalaris arundinacea (F(1,144)=53.42, P<0.001), and also the root biomass of Anthoxanthum odoratum (F(1,140)= 5.81, P<0.05).
Effects of vascular plants on CH4emission (Experiment I)
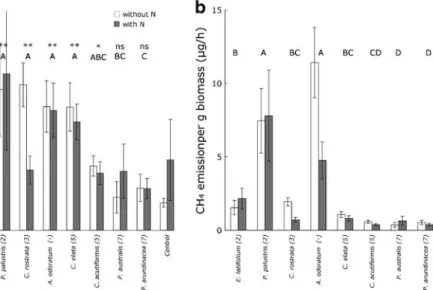
CH4 emissions were up to five times higher from peat cores with Eriophorum latifolium, Potentilla palustris, Carex rostrata, Anthoxanthum odoratum, Carex elata and Carex acutiformis than from control cores with no plant (Fig.2a, Table1). However, the emission rates of two species—Phragmites australis and Phalaris arundinacea—were not significantly higher than the control. CH4emission rates tended to be higher with species from mesotrophic wetlands (species with Ellenberg N values 2-5) than with species from eutrophic wetlands (species with Ellenberg N=7) (Fig. 2a). Also, plant species from mesotrophic wet-lands, such as Eriophorum latifolium and Potentilla
palustris, had significantly higher CH4emission rates per gram total biomass than Phragmites australis and Phalaris arundinacea (Fig.2b, Table1).
Phalaris arundinacea was the only species for which there was a significant positive relationship (R2=0.302) between CH4 emissions and shoot bio-mass (Fig.3, interaction effects Table1). The combined data for all species showed a weakly negative relationship (Fig.3). Correlation between root biomass and CH4 emission showed a similar pattern as for shoot biomass (data not shown).
The N treatment had no significant consistent effect on CH4 emission rates (Table 1), either on a per plant or per unit biomass basis, although N application increased the biomass of some species. Variation in rhizospheric LOA production
among species and upon N addition (Experiment II) Rhizospheric production of low molecular weight organic acids (LOA) differed considerably among plant species (Fig.4a; Table2). Carex elata had by far the highest LOA production, but Eriophorum latifo-lium and Carex rostrata with high-N supply also had a higher production of LOA than Carex acutiformis, Phalaris arundinacea and Phragmites australis
Fig. 2 Mean CH4emission rates from peat cores with different
plant species of European wetlands, as calculated per pot (a), or per g total dry plant biomass (b). Species are ranked according to the fertility index (N-values) of Ellenberg et al. (1991); values shown in brackets after species name (see AppendixA). Error bars show SE of 10 replicates. In A: Stars indicate
whether CH4 emission rates of a species were significantly
higher compared to the control pots (peat cores without plants) (*P≤0.05; **P≤0.01; ***P≤0.001). Letters indicate significant (P≤0.05) differences in CH4 emission rates between species
(the N treatment had no significant effect on CH4 emission
(Fig. 4a). In the low N treatment, Carex rostrata, Anthoxanthum odoratum and Carex elata had higher production rates of LOA than Phalaris arundinacea, Phragmites australis. Generally, species from meso-trophic wetlands tended to produce more LOA than species from eutrophic wetlands, both in absolute terms and per gram plant or root biomass (Fig. 4). Independently of species, total LOA production was not correlated with biomass (Table2).
Overall, a high N addition caused a significantly higher LOA production than the low N treatment (Table2). Acetate and formate were the most important organic acids. Whereas production of both acids was similar in the low N treatment, acetate production was significantly higher than formate production in the high N treatment (Appendix B). Whereas species-specific effects on acetate were very similar to those on total LOA production, there were no species effects on formate production.
Discussion
Vascular plants can influence CH4 emissions from wetlands by altering the production, consumption and transport of CH4in the soil (Christensen et al.2003; Joabsson et al. 1999; Saarnio et al.2004; Ström et al. 2003; Whiting and Chanton 1992), but different species have been found to vary in the extent and how they influence CH4 emissions (Ström et al.
2005; Verville et al.1998). Our experiment supports our first hypothesis—that plants strongly influence the rate of CH4emission from wetland soils, and they
also confirm that there are large differences among species in this respect: whereas six of the eight species significantly increased CH4 emissions com-pared to bare peat, two species had no detectable effect (Fig. 2a). We found indications that the dif-ference among species is related to variation in root exudate production, and hence to the influence of the plants on production of CH4, as we will discuss below.
Table 1 Effects of species, nitrogen and biomass on CH4log
transformed emission rates (ten replicates per treatment). The results from three ANOVAs either include or exclude control
(soil without plant) treatments. Model evaluations were based on the AICc criterion (Burnham and Anderson2002)
CH4per pot without control CH4per pot with control CH4per g biomass without control
Source df MS F df MS F df MS F Species 7 11.10 5.26*** 8 13.17 3.51*** 7 33.38 12.77*** Nitrogen 1 1.64 0.78 1 4.13 1.10 1 7.96 3.05 Shoot biomass 1 19.20 9.06** nf nf Root biomass 1 0.82 0.39 nf nf Species x Nitrogen 7 5.83 2.75* nf nf Species x Shoot b. 7 9.11 4.30*** nf nf Residuals 135 2.12 170 3.76 151 *P≤0.05; **P≤0.01; ***P≤0.001
Fig. 3 Methane emission rates plotted against shoot biomass, for eight plant species together. There was a weakly negative correlation between CH4emission and shoot biomass. Since the
N treatment had no significant effect on CH4emission rates,
data from both fertilized and unfertilized treatment were included
Whiting and Chanton (1993) found evidence that CH4emission rates increase as the net production of wetland vegetation increases. Similarly, Chanton et al. (1997) found a strong positive correlation between CH4emission and living aboveground biomass of rice plants. These positive relationships have been inter-preted as indicating that CH4emissions increase with the increasing primary productivity (Bouchard et al.
2007; Dacey et al.1994; Greenup et al.2000). We only found a positive correlation between shoot-biomass and CH4 emission rates for one species (Phalaris
arundinacea), and no significant relationships for the other seven (Fig. 3), just as Joabsson and Christensen (2001) and Ström et al. (2005) did for some other wetland species. The combined data for all our species actually showed a weak negative correlation between aboveground biomass and CH4 emission (Fig. 3). Similarly, Bouchard et al. (2007) found decreasing CH4emission rates with increasing biomass production of emergent plants in a mesocosm experiment, and such a negative relationship is also evident in the data of Van der Nat and Middleburg (1998), albeit with
Table 2 ANOVA tables for the effects of species and the nitrogen treatment on rhizospheric production of low molecular weight organic acids (log transformed) of seven wetland plant
species. The target variable was either LOA production per plant, LOA production calculated per gram dry total biomass or LOA production per gram dry root biomass
LOA production per plant LOA production per g total biomass LOA production per g root biomass
Source df MS F df MS F df MS F Species 6 5.9 73.9*** 6 1.8 11.7*** 6 4.1 20.6*** Nitrogen 1 17 215.9*** 1 9.3 60.5*** 1 12.8 65.2*** Shoot biomass 1 0.0001 0.002 nf nf Root biomass 1 0.12 1.5 nf nf Species x Nitrogen 6 0.93 11.7*** 6 1.7 11.1*** 6 1.4 7.0*** Residuals 41 0.08 42 0.15 42 0.20 P≤0.05; **P≤0.01; ***P≤0.001
Fig. 4 Mean total of rhizospheric production (+/− SE) of low molecular weight organic acids (LOA) of eight wetland species in nutrient solution during three days, as calculated per plant (a), per gram total dry biomass (b), or per gram dry root biomass (c). Species are ordered according to the fertility index (N-values) of Ellenberg et al. (1991) increasing from left to right (see Appendix A). LOA is expressed here as the
cumulative carbon release by the plants. Error bars show SE of 4 replicates. Significant effects of N addition are indicated with stars (* P≤0.05; ** P≤0.01; *** P≤0.001). Letters show differences among the plant species. The letters on the right side compare plant species exposed to the high N treatment, the letters of the left side compare the species from the low N treatment
only two species. If biomass were strictly correlated with CH4emission, we would expect a constant CH4 emission per gram biomass for all plant species (Fig. 2b), but our experiment revealed that the two species with the lowest biomass—Potentilla palustris and Anthoxanthum odoratum—had much higher CH4 emissions per unit of biomass than other species (Fig. 1). Overall, therefore, our results are more consistent with those of Bouchard et al. (2007), who found a negative relationship between CH4 emission and biomass, than with those of Whiting and Chanton (1993). We conclude that in wetland ecosystems biomass alone is not a reliable predictor of CH4 emissions because some species enhance CH4 emis-sions more strongly than others with similar or higher biomass (Joabsson et al. 1999; Ström et al. 2003). Possible reasons for this are that some species supply more substrate for methanogenic archaea than others, or provide a more effective conduit for CH4transport (Greenup et al. 2000); and some species may even reduce CH4emissions by causing strong rhizospheric oxidation because of high belowground biomass (Hirota et al.2004).
Contrary to our hypothesis, species from mesotro-phic wetlands tended to show higher CH4 emission rates than species from eutrophic wetlands (Fig. 2). Moreover, in Experiment II there was a tendency for species causing high CH4emission rates to have high rates of LOA production as well (Fig.5). Although we have to be cautious in linking the two experiments— for example, because nutrient availabilities and LOA production in soil may not be the same as in a nutrient solution (Jones 1998)—our results suggest that CH4
emissions are strongly influenced by the differing rates of root exudation from wetland plants (Chanton et al.
1995; Ström et al.2003). Root exudation in plants is likely to be influenced not only by plant size—with bigger plants producing more exudates in absolute terms (Jones et al. 2004)—but also by the ecological
characteristics of a species. Plants adapted to low nutrient availability, particularly of phosphorus, may produce more exudates (Bais et al. 2006; Hinsinger
2001; Lu et al.1999; Marschner1998; Neumann and Römheld1999). In absolute terms, total production of organic acids per plant was not correlated with shoot biomass in our experiment (Table 2). Species adapted to mesotrophic habitats had higher LOA production than species of eutrophic habitats, particularly in the N-fertilized treatment (i.e. likely P-limited conditions) both per gram of root as well as in absolute terms (Fig. 4). Thus, the assumption implicit in our third hypothesis—that plant size is more important than habitat adaptation—was incorrect. We note, however, that besides this general pattern, some species like Carex elata in our study may have exceptionally high exudation rates under specific environmental (e.g. P-limited) conditions. We do not have an explanation why this specific species showed such a high exuda-tion rate.
The reason that plants tend to produce more exudates in nutrient-poor conditions is thought to be in order to increase phosphorus availability (Bais et al. 2006; Hinsinger2001; Lu et al. 1999; Marschner
1998; Neumann and Römheld 1999; Ström 1997). This idea is consistent with the finding that N fertilisa-tion stimulates root exudafertilisa-tion (Henry et al.2005) since this causes a shift in the relative availabilities of N and P in the direction of P limitation. This might have stimulated some species in Experiment II to enhanced production of root exudates. Consequently, we also found that N addition increased the production of organic acids in some species in this experiment.
Fig. 5 Mean CH4 emission rates per gram plant root
(Experiment I) versus mean rhizospheric production of low molecular weight organic acids per gram plant root (Experiment II) after three days. Data points are average values of the two nitrogen treatments (with/without N, and low/high N). Error bars represent SE of 8 and 20 replicates for LOA-production and CH4emission, respectively
However, we did not observe any significant effect of N addition upon CH4 emission rates in Experiment I although the underlying mechanisms of a higher biomass and higher LOA production were observed. Hence, our hypothesis predicting a higher CH4 emission upon N-addition has to be rejected. Similar to our results, Silvola et al. (2003) found no significant effect of NH4NO3on CH4-emissions from oligotrophic peatlands. Effects of chemical N-fertilisers on CH4 formation, consumption and emission are complex and often contradictory. In other studies, negative and positive effects of NO3and/or NH4additions on CH4 emissions were observed (cf. Le Mer and Roger2001). The finding that there was no difference in CH4 emissions between Phalaris arundinacea and Phrag-mites australis and bare soil is surprising, since these species revealed high CH4emission rates under field conditions (Kankaala et al.2004; Wilson et al.2008). This inconsistency may be due to differences between the experimental conditions and those in the field, for example in plant size, rooting depths and age. To make a direct comparison between different plants species, and to show mechanistic differences among these species, we chose relatively young plants and kept conditions such as water table and peat volume the same for all species. Perennial plants might act differently when they grow older, and the water table (2 cm below surface) might not have been optimal for all species. Also, LOA production may differ season-ally and this may vary among species. Furthermore, we noted that the CH4emission rates in our peat cores (0.4–1.5 mg m−2h−1) were rather low compared to reported rates from other peat soils, and were in the order of magnitude observed (on average below 1.7 mg m−2h−1) for ombrotrophic peatlands (Greenup et al. 2000). Therefore the effect of plants on CH4 emission through the chimney effect or soil oxidation may have been smaller than in wetlands with higher CH4production rates in the soil. In contrast, the effect of plants through rhizospheric exudation of C com-pounds may have been relatively larger than in other peat soils with higher concentrations of available carbon for methanogenesis. Hence, our peat cores were particularly suited for testing differences among plants with respect to the latter mechanism, but care should be taken in transferring our results to plants growing under field conditions.
Despite intensive research, global estimates of CH4 emissions from wetlands vary widely, from 100 to
231 Tg CH4 / year (IPCC 2007). Our results show that the species composition of wetland vegetations are important in differentiating CH4emissions, just as shown in other studies (Ström et al.2005, Bouchard et al. 2007). Ecological traits of plants may be more important than absolute biomass in determining the influence of wetland plants upon CH4 emissions. Taking into account the functional properties of plants offers scope to improve global estimates of CH4 emissions from wetlands. Our results suggest that emission rates tend to be relatively high under environmental conditions promoting a high produc-tion of root exudates, such as P-limitaproduc-tion or alkaline soil conditions (Dakora and Phillips2002; Jones et al.
2004).
Acknowledgements We thank Adrian Hartmann and Jacynthe Dessureault-Rompré for their help with the measurements of CH4 and organic acids respectively, and Martin Schroth for
providing the possibility to use the ion chromatograph. Carmen Rothenbühler, Pascal Niklaus and René Graf for practical and interspecific technical help during the experiments. Financial support within the project TUMSS (Towards the Understanding of Methane Sinks and Sources) funded by ETH's School Domain of Earth, Environment and Natural Resources is gratefully acknowledged.
Appendix A
The eight plant species used in the experiments with their Ellenberg- and MOVE N indicator values (Bakkenes et al.2002; Ellenberg et al.1991). MOVE values are based on Ellenberg values. A dataset of 100’000 vegetation relevees from the Netherlands served as a base for the calculation of these values.
Species Ellenberg N-value MOVE N-value
Eriophorum latifolium 2 – Potentilla palustris 2 4.07 (±0.96) Carex rostrata 3 4.02 (±1.17) Anthoxanthum odoratum – 4.47 (±1.06) Carex elata 5 4.93 (±1.00) Carex acutiformis 5 5.14 (±0.97) Phragmites australis 7 5.52 (±1.22) Phalaris arundinacea 7 6.14 (±0.72)
Appendix B
Mean total acetate (A) and formate (B) production (+/− SE) per plant of eight wetland species in nutrient
solution during three days. Species are ordered accord-ing to the fertility index (N-values) of Ellenberg et al. (1991) increasing from left to right (see AppendixA). Notice the different scales in A and B.
References
Bais HP, Weir TL, Perry LG, Gilroy S, Vivanco JM (2006) The role of root exudates in rhizosphere interations with plants and other organisms. Annu Rev Plant Biol 57:233–266.
doi:10.1146/annurev.arplant.57.032905.105159
Bakkenes MD, Zwart de D, Alkemade JRM (2002) MOVE nationaal Model voor de Vegetatie versie 3.2 Achtergronden en analyse van modelvarianten. IVM, Bilthoven - Nederland Bedford BL, Walbridge MR, Aldous A (1999) Patterns of nutrient availability and plant diversity of temperate North American wetlands. Ecology 80:2151–2169
Bouchard V, Frey SD, Gilbert JM, Reed SE (2007) Effects of macrophyte functional group richness on emergent freshwa-ter wetland functions. Ecology 88:2903–2914. doi:10.1890/ 06-1144.1
Bragazza L, Freeman C, Jones T, Rydin H, Limpens J, Fenner N, Ellis T, Gerdol R, Hajek M, Lacumin P, Kutnar L, Tahvanainen T, Toberman H (2006) Atmospheric nitrogen deposition promotes carbon loss from peat bogs. Proc
Natl Acad Sci USA 103:19386–19389. doi:10.1073/pnas. 0606629104
Burnham KP, Anderson DR (2002) Model selection and multimodel inference. Springer, Berlin
BUWAL (2005). Stickstoffhaltige Luftschadstoffe in der Schweiz. Status-Bericht der Eidg. Kommission für Lufthygiene. Schriftenreihe Umwelt Nr. 384. Bundesamt für Umwelt, Wald und Landschaft, BUWAL, Bern. (http://www.bafu.
admin.ch/luft/00612/00624/)
Chanton JP, Bauer JE, Glaser PA, Siegel DI, Kelley CA, Tyler SC, Romanowicz EH, Lazrus A (1995) Radiocarbon Evidence for the Substrates Supporting Methane Forma-tion within Northern Minnesota Peatlands. Geochim Cosmochim Acta 59:3663–3668. doi:10.1016/0016-7037 (95)00240-Z
Chanton JP, Whiting GJ, Blair NE, Lindau CW, Bollich PK (1997) Methane emission from rice: Stable isotopes, diurnal variations, and CO2exchange. Global Biogeochem
Cycles 11:15–27. doi:10.1029/96GB03761
Christensen TR, Panikov N, Mastepanov M, Joabsson A, Stewart A, Oquist M, Sommerkorn M, Reynaud S, Svensson B
(2003) Biotic controls on CO2 and CH4 exchange in
wetlands - a closed environment study. Biogeochemistry 64:337–354. doi:10.1023/A:1024913730848
Christensen TR, Johansson TR, Malmer N, Åkerman JH, Friborg T, Crill P, Mastepanov M, Svensson BH (2004) Thawing sub-arctic permafrost: Effects on vegetation and methane emissions. Geophys Res Lett 31:L04501.
doi:10.1029/2003GL018680
Dacey JWH, Drake BG, Klug MJ (1994) Stimulation of Methane Emission by Carbon-Dioxide Enrichment of Marsh Vegetation. Nature 370:47–49. doi:10.1038/370047a0 Dakora FD, Phillips DA (2002) Root exudates as mediators of
mineral acquisition in low-nutrient environments. Plant Soil 245:35–47. doi:10.1023/A:1020809400075
Dessureault-Rompré J, Nowack B, Schulin R, Luster J (2007) Spatial and temporal variation in organic acid anion exudation and nutrient anion uptake in the rhizosphere of Lupinus albus L. Plant Soil 301:123–134. doi:10.1007/ s11104-007-9427-x
Ding WX, Cai ZC, Tsuruta H, Li XP (2003) Key factors affecting spatial variation of methane emissions from freshwater marshes. Chemosphere 51:167–173. doi: 10.1016/S0045-6535(02)00804-4
Ding WX, Cai ZC, Tsuruta H (2005) Plant species effects on methane emissions from freshwater marshes. Atmos Environ 39:3199–3207. doi:10.1016/j.atmosenv.2005.02.022 Ellenberg H, Weber HE, Düll R, Wirth V, Werner W, Paulißen
D (1991) Zeigerwerte von Pflanzen in Mitteleuropa. Scr Geobot 18:1–248
Galloway JN, Dentener FJ, Capone DG, Boyer EW, Howarth RW, Seitzinger SP, Asner GP, Cleveland CC, Green PA, Holland EA, Karl DM, Michaels AF, Porter JH, Townsend AR, Vörösmarty CJ (2004) Nitrogen cycles: past, present, and future. Biogeochemistry 70:153–226. doi:10.1007/ s10533-004-0370-0
Greenup AL, Bradford MA, McNamara NP, Ineson P, Lee JA (2000) The role of Eriophorum vaginatum in CH4 flux
from an ombrotrophic peatland. Plant Soil 227:265–272.
doi:10.1023/A:1026573727311
Henry F, Nguyen C, Paterson E, Sim A, Robin C (2005) How does nitrogen availability alter rhizodeposition in Lolium multiflorum Lam. during vegetative growth? Plant Soil 269:181–191. doi:10.1007/s11104-004-0490-2
Hinsinger P (2001) Bioavailability of soil inorganic P in the rhizosphere as affected by root-induced chemical changes: a review. Plant Soil 237:173–195. doi:10.1023/A:101335 1617532
Hirota M, Tang YH, Hu QW, Hirata S, Kato T, Mo WH, Cao GM, Mariko S (2004) Methane emissions from different vegeta-tion zones in a Qinghai-Tibetan Plateau wetland. Soil Biol Biochem 36:737–748. doi:10.1016/j.soilbio.2003.12.009 IPCC 2007 Climate Change (2007) The Physical Science Basis.
Contribution of Working Group I to the Fourth Assess-ment Report of the IntergovernAssess-mental Panel on Climate Change. Cambridge University Press, Cambridge Joabsson A, Christensen TR (2001) Methane emissions from
wetlands and their relationship with vascular plants: an Arctic example. Glob Change Biol 7:919–932. doi:10.1046/ j.1354-1013.2001.00044.x
Joabsson A, Christensen TR, Wallen B (1999) Vascular plant controls on methane emissions from northern peatforming
wetlands. Trends Ecol Evol 14:385–388. doi:10.1016/ S0169-5347(99)01649-3
Johansson T, Malmer N, Crill PM, Friborg T, Åkerman JH, Mastepanov M, Christensen TR (2006) Decadal vegeta-tion changes in a northern peatland, greenhouse gas fluxes and net radiative forcing. Glob Change Biol 12:2352– 2369. doi:10.1111/j.1365-2486.2006.01267.x
Jones DL (1998) Organic acids in the rhizosphere - a critical review. Plant Soil 205:25–44. doi:10.1023/A:100435 6007312
Jones DL, Hodge A, Kuzyakov Y (2004) Plant and mycorrhizal regulation of rhizodeposition. New Phytol 163:459–480.
doi:10.1111/j.1469-8137.2004.01130.x
Kankaala P, Ojala A, Kaki T (2004) Temporal and spatial variation in methane emissions from a flooded transgres-sion shore of a boreal lake. Biogeochemistry 68:297–311.
doi:10.1023/B:BIOG.0000031030.77498.1f
Laine A, Wilson D, Kiely G, Byrne KA (2007) Methane flux dynamics in an Irish lowland blanket bog. Plant Soil 299:181–193. doi:10.1007/s11104-007-9374-6
Le Mer J, Roger P (2001) Production, oxidation, emission and consumption of methane by soils: A review. Eur J Soil Biol 37:25–50. doi:10.1016/S1164-5563(01)01067-6 Lu Y, Wassmann R, Neue HU, Huang C (1999) Impact of
phosphorus supply on root exudation, aerenchyma forma-tion and methane emission of rice plants. Biogeochemistry 47:203–218
Marschner H (1998) Role of root growth, arbuscular mycor-rhiza, and root exudates for the efficiency in nutrient acquisition. Field Crops Res 56:203–207. doi:10.1016/ S0378-4290(97)00131-7
Neumann G, Römheld V (1999) Root excretion of carboxylic acids and protons in phosphorus-deficient plants. Plant Soil 211:121–130. doi:10.1023/A:1004380832118 Olde Venterink H, Pieterse NM, Belgers JDM, Wassen MJ, De
Ruiter PC (2002) N, P and K budgets along nutrient availability and productivity gradients in wetlands. Ecol Appl 12:1010–1026. doi:10.1890/1051-0761(2002)012 [1010:NPAKBA]2.0.CO;2
R Development Core Team (2006) R: A Language and Environ-ment for Statistical Computing. R Foundation for Statistical Computing, Vienna, Austria.http://www.r-project.org/ Saarnio S, Wittenmayer L, Merbach W (2004) Rhizospheric
exudation of Eriophorum vaginatum L. - Potential link to methanogenesis. Plant Soil 267:343–355. doi:10.1007/ s11104-005-0140-3
Silvola J, Saarnio S, Foot J, Sundh I, Greenup A, Heijmans M, Ekberg A, Mitchell E, van Breemen N (2003) Effects of elevated CO2and N deposition on CH4emissions from
European mires. Glo Biogeochem Cy 17:1068. doi:10.1029/ 2002GB001886
Steiner AA (1961) A universal method for preparing nutrient solutions of a certain desired composition. Plant Soil 15:134–154. doi:10.1007/BF01347224
Ström L (1997) Root exudation of organic acids: importance to nutrient availability and the calcifuge and calcicole behav-iour of plants. Oikos 80:459–466. doi:10.2307/3546618 Ström L, Ekberg A, Mastepanov M, Christensen TR (2003)
The effect of vascular plants on carbon turnover and methane emissions from a tundra wetland. Glob Change Biol 9:1185–1192. doi:10.1046/j.1365-2486.2003.00655.x
Ström L, Mastepanov M, Christensen TR (2005) Species-specific effects of vascular plants on carbon turnover and methane emissions from wetlands. Biogeochemistry 75:65–82. doi:10.1007/s10533-004-6124-1
Van der Nat F, Middelburg JJ (1998) Seasonal variation in methane oxidation by the rhizosphere of Phragmites australis and Scirpus lacustris. Aquat Bot 61:95–110.
doi:10.1016/S0304-3770(98)00072-2
Verville JH, Hobbie SE, Chapin FS, Hooper DU (1998) Response of tundra CH4 and CO2 flux to manipulation
of temperature and vegetation. Biogeochemistry 41:215– 235. doi:10.1023/A:1005984701775
Waddington JM, Roulet NT, Swanson RV (1996) Water table control of CH4emission enhancement by vascular plants
in boreal peatlands. J Geophys Res 101:22775–22785.
doi:10.1029/96JD02014Atmos
Whiting GJ, Chanton JP (1992) Plant-dependent CH4emission
in a subarctic canadian fen. Global Biogeochem Cycles 6:225–231. doi:10.1029/92GB00710
Whiting GJ, Chanton JP (1993) Primary Production Control of Methane Emission from Wetlands. Nature 364:794–795.
doi:10.1038/364794a0
Wilson D, Alm J, Laine J, Byrne KA, Farrell EP, Tuittila ES (2008) Rewetting of Cutaway Peatlands: Are We Re-Creating Hot Spots of Methane Emissions? Restor Ecol.
doi:10.1111/j.1526-100X.2008.00416.x
Zar JH (1999) Biostatistical analysis. Prentice Hall, Upper Saddle River, New Jersey