Summary
In previous studies, significant differences in
Mycobacterium bovis infection prevalence was
reported between two Chadian cattle breeds. Those findings and the established differentiation due to phenotypic characteristics suggest that the two breeds (Arab and Mbororo) are genetically different. To evaluate the genetic structure and the differences between these breeds, the genetic diversity within and between breeds was evaluated based on a total of 205 multilocus genotypes (21 microsatellite loci).
All of the loci under investigation were
polymorphic and the number of alleles ranged from 4 to14 within the two populations. The analysis of population fixation resulted in a FST value of 0.006. Further the population assignment of the individual genotypes and the exact test of population
differentiation did not support the hypothesis that the samples drawn from the two populations are genetically different. Population admixture and sample collection are discussed as possible reasons for the rejection of the hypothesis. Finally,
recommendations for sample collection in extensive systems are given.
Resumé
Dans des études précédentes on avait observé des différences significatives dans les infections par
Mycobacterium bovis chez les races bovines de
Chadian. Ces observations et la différence due aux caractéristiques phénotipiques suggèrent que les deux races (Arabe et Mbororo) sont génétiquement différentes. Pour évaluer la structure génétique et les différences entre ces races on a évalué la diversité génétique dans et entre races sur un total de
Molecular characterization of two common Chadian cattle breeds
C. Flury1,5, B.N.R. Ngandolo2, B. Müller3, J. Zinsstag3 & H.N. Kadarmideen41Institue of Animal Science, Swiss Federal Institute of Technology (ETH),
Universitätsstrasse 65, 8092 Zürich, Switzerland
2 Laboratoire de Recherches Vétérinaires et Zootechniques de Farcha, P.O. Box 433, N’Djaména, Chad
3 Swiss Tropical Institute, P.O. Box, 4002 Basel, Switzerland
4CSIRO Livestock Industries, JM Rendel Laboratory, P.O. Box 5545, Rockhampton, QLD 4702, Australia
5Present address of the corresponding author: Swiss College of Agriculture (SHL),
Länggasse 85, 3052 Zollikofen, Switzerland
205 génotypes multiloci (21 loci microsatélites). Tous les loci étudiés étaient polymorphiques et le nombre d’allèles allaient de 4 à 14 dans les populations. L’analyse de la fixation de la population a donné un Fst de valeur 0,006. Après l’asségnation des génotypes individuels à la population et le test exact de différence de la population, l’hypothèse des échantillons sortis de deux populations génétiquement différentes n’était pas correcte. Le mélange des populations et la saisie des échantillons sont étudiés comme possible cause du rejet de l’hypothèse. Pour finir, on présente une série de recomandations pour la saisie des
échantillons dans des systèmes extensifs.
Resumen
En estudios anteriores se observaron diferencias significativas en infecciones prevalentemente por
Mycobacterium bovis en dos razas bovinas de
Chadian. Estos hallazgos y la diferenciación establecida debida a las características fenotípicas sugieren que las dos razas (Arabe y Mbororo) son genéticamente distintas. Para evaluar la estructura genética y las diferencias entre estas razas, se evaluaron la diversidad genética dentro y entre razas en un total de 205 genotipos multiloci (21 loci microsatélites). Todos los loci estudiados eran polimórficos y el número de alelos iba de 4 a 14 dentro de las dos poblaciones. El análisis de fijación de la población resultó en Fst con valor 0,006. Tras la asignación de genotipos individuales a la población y el test exacto de diferenciación de la población quedó eliminada la hipótesis de que las muestras sacadas de las dos poblaciones eran genéticamente diferentes. La mezcla de poblaciones y la recogida de muestras se discuten como posibles
recogida de muestras en sistemas extensivos. Key words: Cattle breeds, Africa, Molecular
characterization, Genetic diversity, Genotyping, Cluster analysis, Populations.
Introduction
Mycobacterium bovis (M. bovis) is the causative agent
of bovine tuberculosis (BTB). Bovine tuberculosis is a zoonotic disease and one question of interest is its importance in the human tuberculosis epidemic, fostered by HIV/AIDS in different parts of Africa (Ayele et al., 2004; Cosivi et al., 1998). Such investigations are extensive, as the tuberculosis epidemic and spread depend on a variety of factors such as complex interactions between different
Mycobacterium tuberculosis complex strains,
non-tuberculus Mycobacteria, susceptibility of host cattle breeds, the public health status and other environmental factors. To further investigate those complexities a large project is currently running in cooperation with Laboratoire de Recherches Vétérinaires et Zootechniques de Farcha, N’Djaména, Chad; Sokoine University of Agriculture, Morogoro, Tanzania; Laboratoire Central Vétérinaire, Bamako, Mali; Ecole Inter-Etats des Sciences et de Médecine Vétérinaires, Dakar, Senegal; the Swiss Tropical Institute (STI), Basel, Switzerland and the Swiss Federal Institute of Technology (ETH), Zürich, Switzerland.
In a previous study, differences between host cattle breeds regarding the prevalence of infections with M. bovis were reported (Hilty, 2006). In Chad as well as in Cameroon (Hilty, 2006), a higher prevalence in the Mbororo breed was found in comparison with the Arab breed, and the
hypothesis was that the distinct prevalence might be due to a differential susceptibility in the two breeds. Further research on the susceptibility of different host breeds and the genetic diversity between these breeds are goals of the overall project. So far, the genetic characterizations of the samples collected at the slaughterhouses in Chad have been completed and are the subject of the presented study.
As compared to Europe, characterisation of animal genetic resources (AnGR) in Africa receives less attention. In the country report of Chad (FAO, 2007b), no molecular characterization of Chadian
development (FAO, 2007a). Even if the two breeds Mbororo and Arab are not at risk of extinction (derived from FAO, 2007c) the data collected at the slaughterhouses in Chad is expected to be worthy of detailed analysis of the molecular aspects of each. The aim of this study was the molecular
characterization of the two breeds including the assessment of genetic diversity within and between populations. Such a characterization is not only of interest regarding the differences in BTB prevalence in the two breeds but also in respect to the
description of indigenous African cattle breeds and African cattle husbandry systems.
Material and Methods
Breeds
The genotyped animals belong to the two breeds Mbororo and Arab. All of them were kept in a long distance transhumant system by pastoralists, thereby passing the border between Chad and the Central African Republic and spending the dry season in the Central African Republic. The transhumant system is the main cattle production system in Chad. Seventy five percent of the national herds are kept by pastoralists and almost 50% of Chadian export revenues are generated within this system (FAO, 2007b).
The Mbororo cattle, also known as Red Fulani, belong to the subgroup Fulani of the West African Zebu cattle. In Chad a population size of
300 000 heads was reported in year 1992 (FAO, 2007c). This breed has long, lyre-shaped horns and a thoracic, sometimes intermediate hump ( FAO, 2007c) (Figure 1). The lactation yield is poor with 2 kg of milk per day at the peak of lactation (FAO, 2007b). The carcass dressing out is low (40% - 42%), but FAO (2007b) reported the good quality of the breed’s hides for leather production. The breed is robust and adapted to different climates, i.e. the breed is kept in dry as well as humid regions of Chad (FAO, 2007b).
The Arab Zebu (or Shewa) has a well developed dewlap and short horns (Zibrowski, 1997). Coat colour is red – maroon in the sahel-zone and predominantly white in the south-east and west (FAO, 2007b). Figure 2 shows some Arab animals from Chad before slaughter. Milk yield per lactation varies from a minimum of 454 kg to a maximum of
Figure 2. Arab cattle at the slaughterhouse in Chad (photo Ngandolo B.N.R.). Figure 1. Mbororo cattle at the slaughterhouse in Chad (photo Ngandolo B.N.R.).
desert regions, the breed is kept in all other regions of Chad. It is estimated, that 75% to 90% of Chadian cattle belong to this breed (FAO, 2007b). A
population size of 4 902 000 heads was reported in year 1992 (FAO, 2007c).
Genotyping
Blood samples were taken from animals before slaughter at three different abattoirs in Southern Chad. Additionally, information about the breed, age, sex, transhumance system, borders crossed, residence during the dry season and the location of the slaughter house of each animal was recorded. The age structure and gender of the sampled animals are shown in table 1.
Blood was allowed to clot, transported on ice to the Laboratoire de Recherches Vétérinaires et Zootechniques in Farcha and stored at -80°C until further processing. DNA was extracted using the QIAamp® DNA Blood Mini Kit (QIAGEN, Cat. No.
51106) from clotted blood corresponding to 238 individual animals. Handling was carried out according to the Blood and Body Fluid Spin Protocol (derived from Qiagen, 2007). DNA was transported to Europe where genotyping was conducted by Van Haeringen Laboratories,
Wageningen, Netherlands. All microsatellites were chosen from the FAO-list (FAO, 2004).
A remarkable degradation of the DNA was observed over time. This problem caused a high fraction of missing genotypes, especially for the most recent genotyped multiplexes. Markers for individuals with missing information for seven and more markers were omitted from further analysis. Finally, 205 genotypes (131 Arab and 74 Mbororo) for 21 microsatellites were included for statistical analysis.
Statistical analysis
For the statistical investigations the packages ARLEQUIN 3.01 (Excoffier et al., 2005),
STRUCTURE 2.1 (Pritchard et al., 2000) and FSTAT 2.9.3.2 (Goudet, 1995) were applied. Deviation from Hardy-Weinberg- Equilibrium (HWE) was tested for each locus in each population using ARLEQUIN (number of steps in MCMC =100 000). The significance level was set to P-value <0.001.
FAO- markers are assumed to be polymorphic, selectively neutral and to segregate independently from other loci (FAO, 2004). In ARLEQUIN a likelihood ratio test of linkage disequilibrium is implemented for genotypic data with unknown gametic phase. This test was conducted on the data setting the number of permutations to 10 000 and the significance level to 0.05.
The number of alleles per locus, the average number of alleles per breed, the observed and expected heterozygosity per locus and breed were calculated as indicators for the genetic variability within the two breeds. The relevant results were part of the testing on HWE with ARLEQUIN. Further breed specific alleles (i.e. private alleles) were counted.
FSTAT (Goudet, 1995) was used for the assessment of Wrights fixation indices and the respective standard errors. Further, the
computations given in ARLEQUIN to conduct population comparisons and population differentiation were conducted. Additionally genotype assignment was derived with this package.
Clustering analysis was conducted with STRUCTURE 2.1 (Pritchard et al., 2000). The length of burning period for the MCMC was set to
10 000 with 10 0000 replications after burning. The number of clusters was varied from 2 to 5.
Number of animals per age class (years) Sampled
individuals Sex No. (mean) Age 1 2 3 4 5 6 7 8 9 10 11
Male 34 4.206 6 4 6 2 6 3 3 2 2 0 0 Arab
Female 97 6.701 2 1 3 6 6 20 26 21 9 1 2 Male 38 3.079 2 18 7 4 4 0 2 1 0 0 0
Ta bl e 2 . N um be r o f g eno ty pes ( N ), num ber o f a lle les, fr ac tio n o f m issi ng g eno ty pes o bs erv ed h et ero zy go si ty , ex pe ct ed h et ero zy go si ty a nd P -v al ue f or H W E-test in g f or th e Ara b sa m pl e a nd th e M bo ro ro sa m pl e, resp ec tiv el y. A rab (131) M bor or o (74) M ar ker N o. A lleles Mi ss in g (% ) O bs _he t Ex p_ he t P-va lue N o. A lleles Mi ss in g (% ) O bs _he t Ex p_ he t P-v al ue BM 181 8 129 9 1. 5 0. 814 0. 813 0. 894 69 9 6. 8 0. 783 0. 844 0. 238 BM 182 4 131 7 0. 0 0. 672 0. 746 0. 003 74 4 0. 0 0. 703 0. 743 0. 910 BM 211 3 131 8 0. 0 0. 771 0. 827 0. 809 74 9 0. 0 0. 824 0. 822 0. 734 C SRM 60 131 10 0. 0 0. 595 0. 568 0. 677 74 8 0. 0 0. 541 0. 610 0. 202 C SSM 66 131 11 0. 0 0. 771 0. 832 0. 322 74 9 0. 0 0. 757 0. 838 0. 006 ET H 10 129 8 1. 5 0. 798 0. 769 0. 382 74 8 0. 0 0. 797 0. 803 0. 237 ET H 225 129 9 1. 5 0. 605 0. 635 0. 725 74 8 0. 0 0. 689 0. 714 0. 341 ET H 3 131 8 0. 0 0. 618 0. 600 0. 504 74 7 0. 0 0. 514 0. 553 0. 842 H A U T27 113 7 13. 7 0. 664 0. 744 0. 374 66 7 10. 8 0. 727 0. 746 0. 797 IL ST S006 126 10 3. 8 0. 651 0. 687 0. 631 70 10 5. 4 0. 786 0. 750 0. 654 IN RA 23 130 12 0. 8 0. 708 0. 745 0. 526 74 10 0. 0 0. 595 0. 665 0. 281 SP S115 131 7 0. 0 0. 496 0. 497 0. 810 74 7 0. 0 0. 338 0. 348 0. 766 TG LA 122 126 14 3. 8 0. 683 0. 716 0. 154 72 11 2. 7 0. 722 0. 704 0. 686 TG LA 126 131 8 0. 0 0. 786 0. 755 0. 756 74 8 0. 0 0. 716 0. 756 0. 055 TG LA 227 131 10 0. 0 0. 618 0. 621 0. 287 74 11 0. 0 0. 500 0. 572 0. 223 TG LA 53 1 93 16 29. 0 0. 763 0. 787 0. 747 60 15 18. 9 0. 567 0. 768 0. 002 ET H 152 131 6 0. 0 0. 511 0. 525 0. 827 73 5 1. 4 0. 507 0. 527 0. 815 ET H 185 129 14 1. 5 0. 806 0. 823 0. 478 74 11 0. 0 0. 662 0. 757 0. 282 HE L5 1 96 7 26. 7 0. 573 0. 770 0. 000 52 6 29. 7 0. 500 0. 751 0. 000 IL ST S005 121 6 7. 6 0. 760 0. 792 0. 386 71 5 4. 1 0. 732 0. 752 0. 895 IN RA 32 126 10 3. 8 0. 714 0. 826 0. 033 72 10 2. 7 0. 806 0. 815 0. 949 IN RA 35 128 8 2. 3 0. 500 0. 534 0. 091 71 7 4. 1 0. 577 0. 671 0. 004 M M 12 131 14 0. 0 0. 832 0. 839 0. 962 74 11 0. 0 0. 838 0. 859 0. 489 Me an 2 9. 3 0. 684 0. 709 8. 3 0. 672 0. 707 SD 2 2. 5 0. 106 0. 113 2. 1 0. 133 0. 127 1Ex cl ud ed. 2A ft er ex lcu sio n of m arkers TG LA 53 a nd H EL 5.
-100 -80 -60 -40 -100 -80 -60 -40 Arab Mbororo log-likelihood
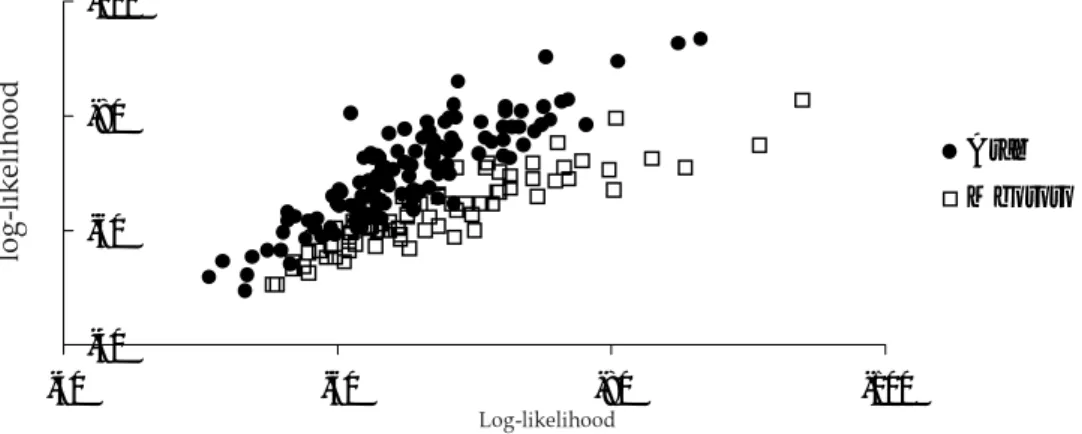
Figure 3. Log-likelihood of each individual's multilocus genotype in the population sample Arab and Mbororo, respectively, assuming that it comes from this population.
Figure 4. STRUCTURE clustering result for k=2 clusters.
Results
Information content of markers and
genetic variability within populations
Table 2 gives an overview of the genotyped markers, the number of individuals with a genotype (N), the number of observed alleles, the fraction of animals with missing genotypes, the observedheterozygosity and the expected heterozygosity and the respective P-value for HWE-testing for the two populations, Arab and Mbororo, separately.
Genetic diversity between populations
and cluster analysis
The total degree of population subdivision
according to Weir and Cockerham (1984) was found to be:
FIT= 0.042 (± 0.008)
Figure 3 shows the results for the genotype assignment implemented in ARLEQUIN. The program calculates the log-likelihood of each genotype under the assumption that it belongs to the respective population.
The results of the clustering analysis assuming two clusters, are given in figure 4. The number of clusters (k) investigated is user defined. The k resulting in the highest logarithmic probability is seen as the most probable number of
subpopulations. For our data the highest log-likelihood was found for k = 2 .
Discussion
Information content of markers and
genetic variability within populations
Marker HEL5 significantly deviates from HWE and was therefore excluded from further analysis. Further, TGLA53 was omitted as its fraction ofLog-likelihood
of the above mentioned markers, 205 individual genotypes for a total of 21 microsatellites remained for further analysis (Table 2).
Testing linkage disequilibrium revealed that for each population three pairs of loci do not segregate independently (P<0.001) (results not shown). However, as all of the markers in linkage disequilibrium are mapped to different chromosomes, the markers are informative regarding diversity studies and are not excluded from further analysis (Peter, 2005).
The number of alleles per locus ranged from 4 up to 14. The minimum was found in the Mbororo sample at the loci BM1824, the maximum at the three loci TGLA122, ETH185 and MM12 of the Arab sample (table 2). These findings show that the two populations are polymorphic for all of the 21 loci under investigation. The chosen loci all fulfil the rule of thumb given by FAO, that markers for diversity studies should segregate with at least 4 alleles per population (FAO, 2004). The mean number of alleles was 9.3 (± 2.5) for the genotypes belonging to the breed Arab and 8.3 (± 2.1) for the genotypes belonging to the Mbororo breed, averaging 8.8 (± 2.3) (Table 2) for the total sample.
28 alleles at 13 loci out of the 203 alleles were found to be so called private alleles (results not shown). A private allele is defined as an allele found in one population but in no other (Woolliams and Toro, 2007). In our study the highest frequency of a private allele was 2.8% only. Thus, their influence on differences in the allelic frequencies between populations is expected to be low.
The average observed heterozygosity was found to be 0.684 (± 0.106) in the Arab and 0.672 (± 0.133) in the Mbororo populations, respectively. The average expected heterozygosity was 0.709 (± 0.113) for the Arab population, and 0.707 (± 0.127) for the Mbororo population (Table 2). The mean number of alleles per locus and the expected heterozygosity are seen as informative measures for the assessment of genetic diversity within populations (Hanotte and Jianlin, 2005; Toro and Caballero, 2004). The mean number of alleles per locus found in the present study is lower than the 11.5 alleles per microsatellite locus observed by Ibeagha-Awemu et
al. (2004) in West/Central African cattle breeds. The
expected heterozygosity for the nine Bos indicus breeds investigated by Ibeagha-Awemu et al. (2004) ranged from 0.703 – 0.744. Our estimates
correspond with the lower end of this range. Generally, it has to be questioned if the samples drawn for our study represent random samples from the Mbororo and Arab breed . The number of animals sampled is adequate, however, the animals
were all kept in one region of southern Chad and the size of the two samples was not equal. A balanced affiliation of both sexes is not given for the Arab sample (table 1). Further, the animals from a pastoralist system arriving at abattoir do not necessarily cover all age classes of a population (Table 1). For both breeds the average age of the sampled cows was about 2.5 years higher than the average age of the sampled bulls (Table 1).
Considering bulls, animals from the older age classes (> 6 years) are under represented in both breeds, indicating that the majority of bulls are slaughtered at a younger age (Table 1). Older animals might have undergone selection as they had to survive the dry season, long treks, disease pressures and other forces arising within this system. Due to these various factors, the assumption of two random samples cannot be warranted.
Genetic diversity between populations
and cluster analysis
The FST indicates that the genetic diversity between the two samples is very low. A high proportion of the FIT is accounted for by the within-heterozygote deficiency (FIS). The low FST is seen as a first incidence, and might be hard to elaborate genetic differences between the samples of Mbororo and Arab cattle.
The distributions of the log-likelihoods for the genotype assignment shown in figure 3 overlap to a certain amount. Again it is not possible to clearly distinguish between the two populations. This result was further confirmed with the exact test of population differentiation implemented in
ARLEQUIN (results not shown). The differentiation test between all samples revealed in P-value > 0.05, i.e. based on the genotypic information - the two populations do not significantly differ.
The algorithm implemented in STRUCTURE (Pritchard et al., 2000) constructs genetic clusters from a collection of individual multi-locus genotypes. Therefore the fraction of each
individual’s genotype that belongs to each cluster is estimated (Rosenberg et al., 2001). It identifies sub-populations which differ in their allele frequencies.
The bars in figure 4 show, that for none of the 205 individuals can the genome be clearly assigned to the Arab cluster or the Mbororo cluster.
Furthermore, no relation between the participation of an individual’s genome fraction and its initially assigned population (x-axis in figure 4) was found.
number of markers and the number of individuals genotyped. For less diverged populations they propose to genotype more than 12-15 markers for 15-20 individuals of the hypothetical populations to get accurate clustering results. For our data those recommendations are fulfilled. Therefore the clustering results further support the notion that that the samples under investigation do not reflect genetically different populations.
Before slaughtering the sampled individuals were phenotypically assigned to the two breeds Mbororo and Arab. Even if relying on different individuals sampled, the reported differences in BTB prevalence between the two breeds (Hilty, 2006) leads to the hypothesis that genetic differences exist and might become obvious in investigating the molecular diversity. However, the analysis of the samples investigated here and the chosen microsatellites do not support this hypothesis. Those findings are somewhat unexpected. They might be explained with effects regarding the sampling of animals kept in transhumance systems. Unfortunately, no data about the herd affiliation was available. As already mentioned above, different age structures were observed between sexes. There is a certain chance that ‘old’ female individuals (5 to 8 years) are the ones that survived for example BTB infection and are therefore overrepresented in both samples. Such sampling effects can result in diminished
differences between breeds.
Mbororo and Arab animals are kept by nomadic pastoralists of two different ethnic groups, where cattle breeds are named after them. This connection appears to be rather loose and both groups often keep Arab and Mbororo cattle inter-mixed in their herds (Dr. C. Diguimbaye-Djaibe and B.N.R. Ngandolo, personal communications). Another possibility is that migration of animals between herds and breeds occur. These aspects support the rejection of the hypothesis due to population admixture. Admixture between populations homogenizes allele frequencies between populations. Therefore, the exploration of
differences in allele frequencies between admixed populations does not lead to significant testing results. This conclusion is further supported by the Country Report of Chad (FAO, 2007b) which records that important admixture between Arab and Mbororo exists.
Based on our study, we fully support the statement that sample collection is the most
1999) may hamper the collection of representative samples. To overcome this difficulty well planned data collection and the collection of additional information like herd affiliation, records of
geographical coordinates and photo documentation of sampling sites, animals and flocks. are highly recommended (FAO, 2007a). Otherwise, the interpretation of genotyping results and statistical analysis become hard and loose their explanatory power.
Conclusions
Considering phenotypes solely, one would have presumed the samples represented two different breeds. However, our study does not confirm genetic differences between the two samples. Here, the potential of genetic characterisation studies in extensive systems becomes obvious. The presented results increase information about cattle breeds kept in pastoralist systems and supports the notion that regular admixture between the two breeds occurs.
Collecting samples at slaughterhouses for semi-feral populations seems promising in comparison with the complex collection of field samples. Nevertheless, careful sample collection procedures remain the most important step. In this context the need for supplementary information (description of the breeds, herd information, information about herd management etc.) is underlined. For this purpose, the pastoralists arriving at slaughterhouse might be asked to fill in a questionnaire. Future research also requires
investigations on cattle husbandry and herding practices of African pastoral communities where very little information is available. No detailed information about the influence of non-genetic factors on differences in disease prevalence (i.e. BTB) between breeds is available.
Increased information about the genetic composition of breeds as well as their production system allows for better understanding of
pastoralist systems in general and of specific threats - such as zoonotic diseases – arising within such systems.
Acknowledgements
and two independent referees are acknowledged for their comments on earlier versions of this
manuscript.
List of References
Ayele, W.Y., Neill, S.D., Zinsstag, J.,
Weiss, M.G. & Pavlik, I. 2004. Bovine tuberculosis: an old disease but a new threat to Africa. Int. J. Tuberc. Lung Dis. 8, 924-937.
Cosivi, O., Grange, J.M., Daborn, C.J., Raviglione, M.C., Fujikura, T., Cousins, D., Robinson, R.A., Huchzermeyer, H.F., de, K.I. & Meslin, F.X. 1998. Zoonotic tuberculosis due to Mycobacterium bovis in developing countries. Emerg. Infect. Dis. 4, 59-70.
DAGRIS. 2007. Domestic Animal Genetic Resources Information System (DAGRIS). J.E.O. Rege, O. Hanotte, Y. Mamo, B. Asrat and T. Dessie (Eds), <http://dagris.ilri.cgiar.org/>, International Livestock Research Institute, Addis Ababa, Ethiopia.
Eding, H. & Meuwissen T.H.E. 2001. Marker-based estimates of between and within population kinships for the conservation of genetic diversity. Journal of Animal Breeding and Genetics 118: 141-159.
Excoffier, L., Laval G. & Schneider S. 2005. Arlequin (version 3.0): An integrated software package for population genetics data analysis Evolutionary Bioinformatics Online.
FAO. 2007a. The state of the world’s animal genetic resources for food and agriculture,
B. Rischkowsky and D. Pilling (Eds), Rome, Italy, pp. 511.
FAO. 2007b. The state of the world’s animal genetic resources for food and agriculture - annex: Country report Chad. B. Rischkowsky and D. Pilling (Eds), Rome, Italy, pp. 511.
FAO. 2007c. Domestic animal diversity information system (DAD-IS). <http://dad.fao.org/>, FAO, Rome, Italy.
FAO. 2004. Secondary guidelines for development of national farm animal genetic resources management plans, Rome, Italy, pp. 55.
Goudet, J. 1995. Fstat (version 1.2): A
computer program to calculate f-statistics. Journal of Heredity 86: 485-486.
Hanotte, O. & H. Jianlin. 2005. Genetic characterization of livestock populations and its use in conservation decision-making. In: The role of biotechnology for the characterization and
conservation of crop, forestry, animal and fishery genetic resources. FAO Workshop, Turin, Italy.
Hilty, M. 2006. Molecular epidemiology of mycobacteria: Development and refinement of innovative molecular typing tools to study mycobacterial infections, Universität Basel, Basel, Switzerland, pp. 157.
Ibeagha-Awemu, E.M., O.C. Jann,
C. Weimann, & G. Erhardt. 2004. Genetic diversity, introgression and relationships among
West/Central African cattle breeds. Genetics Selection Evolution 36: 673-690.
Peter, C. 2005. Molekulargenetische Charakterisierung von Schafrassen Europas und des Nahen Ostens auf der Basis von
Mikrosatelliten, Justus-Liebig-Universität, Giessen, Germany, pp. 160.
Pritchard, J.K., Stephens M. & Donnelly P. 2000. Inference of population structure using multilocus genotype data. Genetics 155: 945-959.
Qiagen. 2007. Qiagen: sample and assay technologies. <www1.qiagen.com/literature/handbooks/
literature.aspx?id=1000190>.
Rosenberg, N. A., Burke, T., Elo, K., Feldman, M.W., Freidlin, P.J., Groenen, M.A.M., Hillel, J., Mäki-Tanila, A., Tixier-Boichard, M., Vignal, A., Wimmers, K. & Weigend S. 2001. Empirical evaluation of genetic clustering methods using multilocus genotypes from 20 chicken breeds. Genetics 159: 699-713.
Ruane, J. 1999. A critical review of the value of genetic distance studies in conservation of animal genetic resources. Journal of Animal Breeding and Genetics 116: 317-323.
Toro, M. & Caballero. 2004. Characterisation and conservation of genetic diversity between breeds. In: Proceedings 55th EAAP Annual Meeting,
Bled, Slovenia.
Weir, B. & C. Cockerham. 1984. Estimating f-statistics for the analysis of population structure. Evolution 38: 12.
conservation of farm animal genetic resources. Wageningen Academic Publishers, Netherlands, 55-74.
chad bassin. CIRAD-EMVT, Wageningen, Netherlands, 79-80.