O R I G I N A L A R T I C L E
A molecular analysis of the patterns of genetic diversity in local chickens from western Algeria in comparison with commercial lines and wild jungle fowls
F. Z. Mahammi1, S. B. S. Gaouar1,2, D. Lalo€e3, R. Faugeras4, N. Tabet-Aoul5, X. Rognon3,6, M. Tixier-Boichard3& N. Saidi-Mehtar1
1 Laboratoire de Genetique Moleculaire et Cellulaire, Universite des Sciences et de la Technologie d’Oran–Mohamed BOUDIAF (USTO-MB), Oran, Algerie
2 Departement de biologie, Universite de Tlemcen, Algerie
3 INRA, UMR1313 Genetique Animale et Biologie Integrative, Jouy-en-Josas, France
4 INRA, Laboratoire d’analyses genetiques pour les especes animales (LABOGENA), Jouy-en-Josas, France 5 Departement de Biotechnologie, Universite d’Oran Es-Senia, Oran, Algerie
6 AgroParisTech, UMR1313 Genetique Animale et Biologie Integrative, Paris, France
Keywords
Algeria; ecotypes; gene flow; genetic diversity; structure; village chickens.
Correspondence
F.Z. Mahammi, Laboratoire de Genetique Moleculaire et Cellulaire, Universite des Sciences et de la Technologie
d’Oran–Mohamed BOUDIAF-USTO-MB, BP 1505, El M’naouer, 31000 Oran, Algerie.
Tel.: +213791726704;
E-mail: [email protected] Received: 29 November 2014;
accepted: 4 February 2015
Summary
The objectives of this study were to characterize the genetic variability of village chickens from three agro-ecological regions of western Algeria:
coastal (CT), inland plains (IP) and highlands (HL), to reveal any underly- ing population structure, and to evaluate potential genetic introgression from commercial lines into local populations. A set of 233 chickens was genotyped with a panel of 23 microsatellite markers. Geographical coordi- nates were individually recorded. Eight reference populations were included in the study to investigate potential gene flow: four highly selected commercial pure lines and four lines of French slow-growing chickens. Two populations of wild red jungle fowls were also genotyped to compare the range of diversity between domestic and wild fowls. A genetic diversity analysis was conducted both within and between popu- lations. Multivariate redundancy analyses were performed to assess the relative influence of geographical location among Algerian ecotypes. The results showed a high genetic variability within the Algerian population, with 184 alleles and a mean number of 8.09 alleles per locus. The values of heterozygosity (He and Ho) ranged from 0.55 to 0.62 in Algerian eco- types and were smaller than values found in Jungle fowl populations and higher than values found in commercial populations. Although the struc- turing analysis of genotypes did not reveal clear subpopulations within Algerian ecotypes, the supervised approach using geographical data showed a significant (p<0.01) differentiation between the three ecotypes which was mainly due to altitude. Thus, the genetic diversity of Algerian ecotypes may be under the influence of two factors with contradictory effects: the geographical location and climatic conditions may induce some differentiation, whereas the high level of exchanges and gene flow may suppress it. Evidence of gene flow between commercial and Algerian local populations was observed, which may be due to unrecorded crossing with commercial chickens. Chicken ecotypes from western Algeria are characterized by a high genetic diversity and must be safeguarded as an important reservoir of genetic diversity.
Introduction
Because of centuries of domestication and breeding, a wide range of chicken breeds exists today. However, an increasing number of local chicken breeds are under threat of extinction, and valuable genotypes and traits are at risk of being lost (Davilaet al.2009).
Genetic variation enables both adaptive evolutionary changes and artificial selection. Local chicken popula- tions are seen as an important genetic reservoir devel- oped over thousands of years and successful in extreme and unusual environments with limited veterinary and management input (Hall & Bradley 1995). The present and future improvement and sus- tainability of indigenous chicken production systems are dependent upon the availability of this genetic variation (Al-Atiyat 2009).
In Algeria, poultry production has grown signifi- cantly in relation to the development of intensive poultry industry that was favoured by incentive poultry policies engaged since the beginning of the 1970s, with the objective to ensure, in the shortest time, the self-sufficiency of urban populations in ani- mal proteins. The generalization of the use of hybrids has increased availability in animal proteins with a high economic efficiency, but at the same time, it has weakened rural poultry structures. Local chicken populations have been exposed to anarchic crosses that have threatened their genetic originality in rela- tion to meat quality and to their ability to resist and adapt to variable feeding and housing conditions.
Despite their current importance and future poten- tial, very little is known about the genetic diversity of local chickens in Algeria. There have been several attempts to characterize phenotype and performance of Algerian local chickens (Moula et al. 2009; Ma- hammi et al. 2014), but no molecular characteriza- tion of these populations had yet been realized. At present, they are commonly referred to as ‘village’ or
‘indigenous’ chickens without differentiating them into any population. It is not known whether the geographical origin influences the genetic differentia- tion of local chicken populations and thus makes them different. As previously adopted in some Afri- can countries, such as Tanzania and Ethiopia (Dessie et al. 2003; Msoffe et al. 2005), we chose to use the term ‘ecotypes’ to describe chickens from different eco-zones. The objectives of this study were to char- acterize the genetic variability of village chickens in the Tell and Highlands regions of western Algeria, to reveal any underlying population structure, and to evaluate potential genetic introgression from com- mercial lines into local populations.
Materials and methods Experimental populations
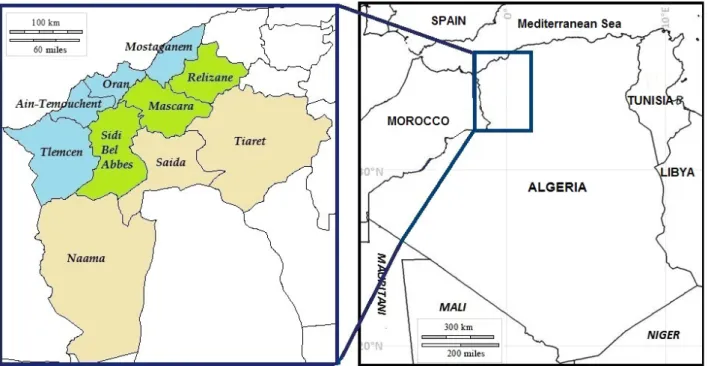
The study was conducted in 31 villages from 10 wilayas (administrative divisions) of western Algeria belonging to three agro-ecological regions that differ in their geo- graphical and climatic characteristics: coastal (CT), inland plains (IP) and highlands (HL) (Figure 1). A total of 233 animals from 52 farms were genotyped, includ- ing all breeding males and a number of females propor- tionate to the flock size, to best represent the diversity among farms. Geographical coordinates were individu- ally recorded to determine the proportion of variation among Algerian native chickens due to the geographi- cal origin. The sampling location and the number of individuals examined per ecotype are shown in Table S1. Two millilitre of blood was collected with an antic- lotting agent (EDTA 0.5M) at the wing vein of each bird.
DNA was extracted from blood using Qiagen, DNeasyâ tissue kit following the protocol of the supplier.
Ten other populations were included in the study to provide a large reference set of genetic diversity and make possible to detect potential impacts of these lines in the local gene pool. These consisted of two wild red jungle fowl populations, 15Gallus gallus gallus(GGG) and 16 Gallus gallus spadiceus (GGS), four highly selected commercial pure lines, broiler dam (Br-f) and sire (Br-m) lines, brown egg layers (BEL) and white egg layers (WEL) with 25 individuals each, and four commercial lines of French slow-growing chickens (Lab-A, Lab-B, Lab-C and Lab-D) with 20–24 individu- als each. These lines are used in cross-breeding for the production of certified chickens which exhibit a lower growth rate than the one of commercial lines but a much higher growth rate than the one of village chick- ens. In addition, lines Lab-C and Lab-D are carrying the naked neck gene. Wild populations and commer- cial lines were obtained from the AVIANDIV project (a European collaborative project on chicken biodiversity (Hillel et al. 2003) and the Label populations were included for the first time in a genetic diversity study.
AVIANDIV populations had been regenotyped in 2009 in the LABOGENA typing laboratory, INRA, Jouy-en- Josas, France, which also performed the genotyping for the Label and Algerian ecotype chickens in 2012.
Thus, all genotypes were obtained with the same equipment at the same place for the 223 reference samples and the 233 Algerian chickens.
Microsatellite amplification and genotyping
Twenty-three microsatellite pairs of primers, among those recommended by the FAO to study the
genetic structure of breeds of chickens around the world, were used by LABOGENA. Subsequently, the markers were grouped into six multiplexes for amplification.
PCR was performed using a Qiagen Master Mix containing dNTPs, Taq polymerase and the dilution buffer. The concentrations of the various components are optimized by the manufacturer to give good results for fragments up to 1 Kb. The reactions were carried out in a total volume of 5ll Qiagen Master Mix, 3ll multiplex and 2ll DNA (20 ng/ll). The cycling conditions consisted of 15 min at 95°C fol- lowed by 30 cycles of 30 s at 94°C, 90 s at 60°C and 90 s at 72°C, and a final extension step of 30 min at 60°C. PCR products were diluted at 1/10, and 2ll of this dilution was taken up in 10ll mixture of formamide/LIZc 500 size standards from Applied Bio- systems. After denaturation at 95°C for 3 min, the mixture was loaded on the Applied Biosystems sequencer 3730 (with 96 capillaries) (Applied Biosys- tems, California, USA). The size of each fragment was determined using GeneMapper Software version 4.0 (Applied Biosystems).
Statistical analysis
The presence of null alleles in the Algerian chickens was tested using FreeNA software (Chapuis & Estoup
2007) where loci showing estimated frequencies of null alleles above 0.2 could be considered as problem- atic for calculations and should be removed. The fol- lowing parameters of polymorphism were calculated using GENETIX 4.4 (Belkhiret al.1996), Genepop 3.4 (Rousset 2008), FSTAT 2.9.3 (Goudet 1995) and Cer- vus (Marshall et al. 1998) softwares for each marker across all populations, and for each separate popula- tion across all markers: total number of alleles (TNA), average number of alleles (ANA), effective number of alleles (Ae), allelic frequencies, allelic richness (AR), non-biased expected (He) and observed heterozygos- ity (Ho) and Wright’s F-statistics (FIT, FIS, FST). Test significance was corrected with sequential Bonferroni correction on loci.
The matrix of Reynolds distance,DR(Reynoldset al.
1983), was computed using PHYLIP 3.69 (Felsenstein 1989). Regarding the DR distance, a Neighbor-Net (Bryant & Moulton 2004) network was drawn using SPLITSTREE 4.8 (Huson & Bryant 2006).
The tree of individuals was built using the genetic relatedness among individual chickens based on pro- portion of shared alleles (DAS), obtained through neighbour-joining algorithm using R 2.14.2 software.
An individual assignment was tested using GENE- CLASS2 software (Piryet al.2004). The probability of assigning an individual to a population was estimated using the population simulation method (10 000 ani-
Figure 1Sampling area in western Algeria. Three agro-ecological regions and ten administrative divisions. Coastal (blue): Telemcen, Ain-Temouch- ent, Oran and Mostaganem; Inland plains (green): Sibi Bel Abbes, Mascara and Relizane; Highlands (beige): Na^ama, Saida and Tiaret.
mals for each breed sample) with the resampling algo- rithm (Paetkau et al. 1995). The Bayesian method developed by Rannala & Mountain (1997) was used to assign animals to breeds.
Another approach for assigning an individual to a genetic cluster was performed with the Bayesian clus- tering procedure implemented in the software STRUCTURE (Pritchard et al. 2000). The analysis involved an admixture model with correlated allele frequencies, which permits mixed ancestry within animals. The model was performed considering a number of clusters (K) ranging from 2 to 15. For each K value, 100 runs were performed with 100 000 itera- tions following a burn-in period. K was the number of assumed clusters to be examined. A pairwise compari- son of the 100 solutions was carried out using CLUMPP software (Jakobsson & Rosenberg 2007) to estimate the similarity function G’ over runs for the different values of K, using LARGEKGREEDY algo- rithm. Solutions with over 95% similarity were considered identical.
Multivariate analyses have been shown to be effi- cient in extracting information from genetic markers (Jombartet al.2009). It can condense the information from a large number of alleles and loci into fewer syn- thetic variables and makes possible to include other variables in addition to marker genotypes in the same analysis. When analysing genetic markers, the main interest is in finding relationships among objects (geno- types or populations) using p alleles. In this case, data are seen as a cloud of n points embedded inside a p- dimensional space, where each dimension is defined by an allele (Jombart et al. 2009). In this study, approaches of multivariate analyses used were princi- pal component analysis (PCA) and principal compo- nent analysis with respect to instrumental variables (PCAIV), which were performed by R 2.14.2 software.
Principal component analysis clusters individuals using proportionate data based on allele frequency information. PCA was performed on allele frequencies scaled by ffiffiffiffiffiffiffiffiffiffiffiffiffiffiffiffiffi
pð1pÞ
p , where the variance between populations of the allele frequency standardized byffiffiffiffiffiffiffiffiffiffiffiffiffiffiffiffiffi
pð1pÞ
p is exactly the classical FST (Jombart et al.
2009).
Principal component analysis with respect to instru- mental variables, or redundancy analysis, was used to determine the proportion of variation among Algerian native chickens due to the geographical origin. It is a supervised approach, generally used to know what proportion of variation of a set of ‘answer’ variables (here genotypes of individuals for 23 microsatellites) is attributable to a set of ‘explanatory’ variables (geo- graphical variables), unlike simple ordinations per-
formed on a single table (e.g. PCA). So, to perform the PCAIV, we used two tables: the first for allelic fre- quencies which are used as quantitative variables after standardization with ffiffiffiffiffiffiffiffiffiffiffiffiffiffiffiffiffi
pð1pÞ
p and the second
with data of the three geographical factors (altitude, latitude and longitude), taken as instrumental variables.
Results
Microsatellite markers
The variability parameters of the investigated loci are displayed in Table S2. All markers were polymorphic.
Only three locus9population combinations of 293 identified a potentially null allele (r<0.2 for all com- binations, data not shown). A total number of 236 alleles were observed for the 23 microsatellite loci, but they were no data for MCW0103 in the wild jungle fowl and the commercial lines used as controls, and no data for MCW0014 for the Lab-B population. Thus, only 21 from 23 markers were included in the analysis requesting complete marker data on all populations, although the 23 markers were used for the separate analysis of Algerian chickens.
The total number of alleles varied from 2 (MCW0103) to 32 (LEI0234) with an overall mean of 10.26 5.08 alleles per locus. The effective number of alleles (Ae) ranged between 0.84 (MCW0130) and 4.43 (LEI0234), with an overall mean of 2.33. The PIC among loci was highest for LEI0234 (0.912) and low- est for MCW0103 (0.314), with an average of 0.61.
Across all populations, the values for observed hetero- zygosity (Ho) ranged from 0.279 (MCW0014) to 0.635 (MCW0034), with an overall mean value of 0.476.
After sequential Bonferroni correction, a significant deficit of heterozygotes was observed for six loci (MCW0014, LEI0234, MCW0330, MCW0078, ADL0278 and ADL0268).
Genetic variation within populations
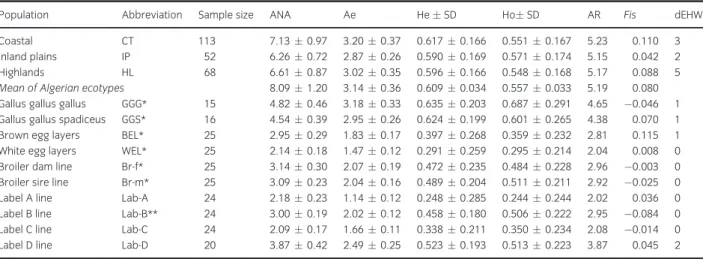
The parameters for the within-population genetic diversity are shown in Table 1. The Algerian popula- tion harboured 184 alleles with an average of 8.09 alleles per locus for 23 loci. Within the three Algerian ecotypes, the average number of alleles (ANA) varied from 6.26 in IP to 7.13 in CT. Number of effective alleles (Ne) varied from 2.87 in IP to 3.20 in CT, and allelic richness (AR) varied from 5.15 in IP to 5.23 in CT with an average of 5.19. Expected heterozygosity (He) of Algerian chicken ecotypes varied from 0.590
in IP to 0.617 in CT with an overall mean value of 0.609. Mean estimate of observed heterozygosity (Ho) of overall Algerian ecotypes and loci was 0.557. Mean value of inbreeding coefficient (Fis) was 0.08 and it varied from 0.042 in IP to 0.11 in CT.
Regarding all populations and the 21 available markers, the greatest value of mean number of alleles (ANA) and allelic richness (AR) was displayed by Algerian ecotypes, but Jungle fowl populations showed the greatest values for heterozygosity (He and Ho) and for the effective number of alleles (Ae). The lowest value of these parameters was displayed by Lab-A population.
A total of 35 private alleles (14.83%) were found (Table S3). All populations except WEL and Br-m exhibited at least one private allele. TheGallus gallus gallus wild population exhibited the highest number of private alleles (11), followed by the Gallus gallus spadiceus population (6). Altogether, Algerian chick- ens exhibited 11 private alleles, with 2–6 per ecotype, and 3% as a maximal frequency.
Deviations from Hardy–Weinberg equilibrium, after sequential Bonferroni correction, were significant for 15 of 292 loci population combinations (p<0.01).
Most of the deviations were observed in the Algerian chickens (10 of 15) and always indicated a significant deficit of heterozygotes (p<0.01).
Genetic relationships and clustering
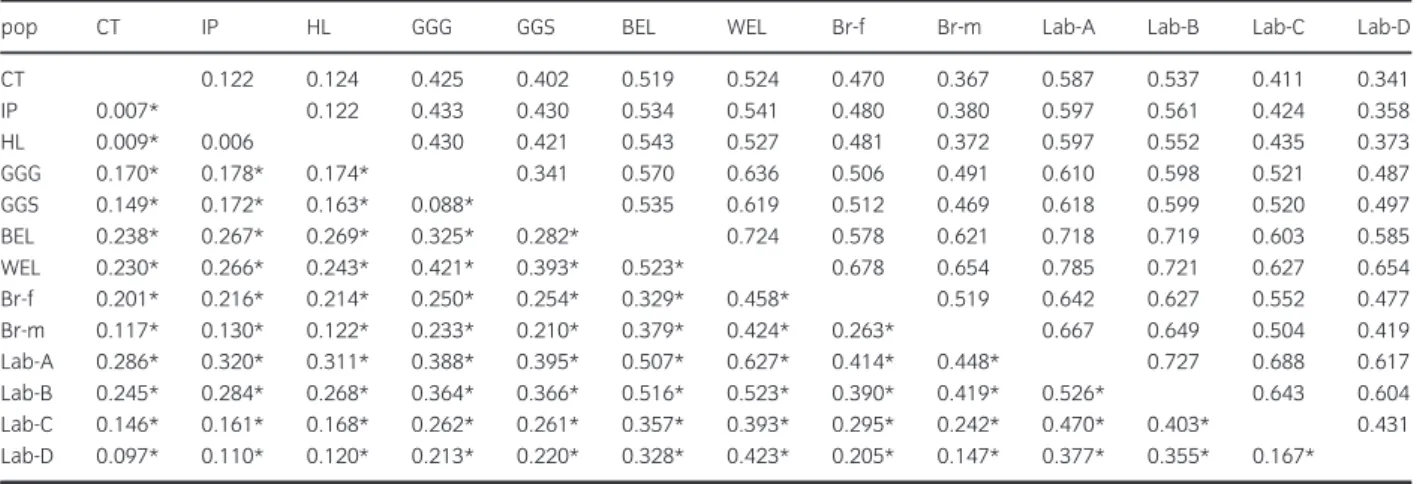
Fstvalues were estimated for each pair of populations (Table 2). They ranged from 0.006 to 0.627 in the overall population, and the largest Fst (0.627) was
observed between the two commercial lines WEL and Lab-A. Within the Algerian population, no significant distance was found between IP and HL (p> 0.5).
Small, but significant (p <0.001), distances were found between CT and IP (0.007) and between IP and HL (0.009). Such low values reflected the low diver- sity between ecotypes. Very low values of Reynolds genetic distance (DR) were observed between pairs of Algerian ecotypes (from 0.122 to 0.124) as compared toDRvalues obtained among commercial lines (from 0.419 to 0.785) (Table 2).
Network tree based onDRvalues is shown in Fig- ure 2. The clustering showed the separation of each reference population. Algerian chickens formed their own separate cluster, with no distinction between ecotypes.
Trees based on the individual allele-shared distance showed that chickens of each reference population grouped according to their origin (Figure 3) and chickens from the three Algerian ecotypes were mixed together (Figure S1).
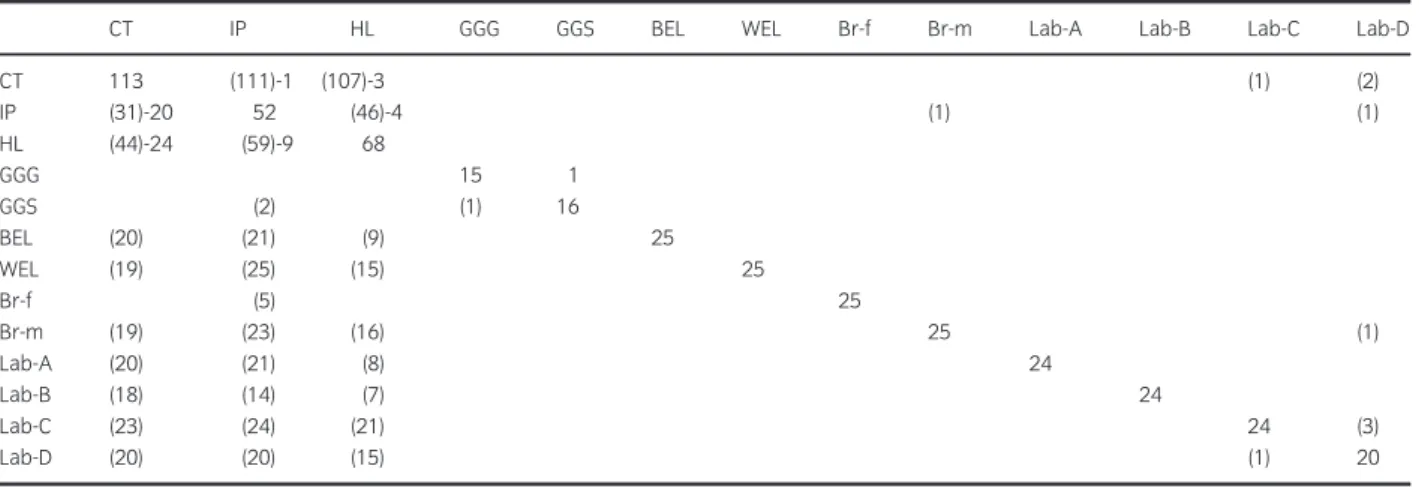
Assignment of individuals by GENECLASS indi- cated that 39% and 35% of IP and HL chickens, respectively, showed a higher probability of assign- ment to CT ecotype than to their ecotype of origin (Table 3). On the other hand, only 1% and 3% of chickens from the CT ecotype showed a higher proba- bility of assignment to IP and HL, respectively. Some individuals from the commercial lines could be signifi- cantly assigned to the Algerian population, but the probability of assignment to one of the ecotype was always lower than the probability of assignment to the true population.
Table 1Genetic diversity estimates for Algerian and reference populations
Population Abbreviation Sample size ANA Ae HeSD HoSD AR Fis dEHW
Coastal CT 113 7.130.97 3.200.37 0.6170.166 0.5510.167 5.23 0.110 3
Inland plains IP 52 6.260.72 2.870.26 0.5900.169 0.5710.174 5.15 0.042 2
Highlands HL 68 6.610.87 3.020.35 0.5960.166 0.5480.168 5.17 0.088 5
Mean of Algerian ecotypes 8.091.20 3.140.36 0.6090.034 0.5570.033 5.19 0.080
Gallus gallus gallus GGG* 15 4.820.46 3.180.33 0.6350.203 0.6870.291 4.65 0.046 1 Gallus gallus spadiceus GGS* 16 4.540.39 2.950.26 0.6240.199 0.6010.265 4.38 0.070 1
Brown egg layers BEL* 25 2.950.29 1.830.17 0.3970.268 0.3590.232 2.81 0.115 1
White egg layers WEL* 25 2.140.18 1.470.12 0.2910.259 0.2950.214 2.04 0.008 0
Broiler dam line Br-f* 25 3.140.30 2.070.19 0.4720.235 0.4840.228 2.96 0.003 0
Broiler sire line Br-m* 25 3.090.23 2.040.16 0.4890.204 0.5110.211 2.92 0.025 0
Label A line Lab-A 24 2.180.23 1.140.12 0.2480.285 0.2440.244 2.02 0.036 0
Label B line Lab-B** 24 3.000.19 2.020.12 0.4580.180 0.5060.222 2.95 0.084 0
Label C line Lab-C 24 2.090.17 1.660.11 0.3380.211 0.3500.234 2.08 0.014 0
Label D line Lab-D 20 3.870.42 2.490.25 0.5230.193 0.5130.223 3.87 0.045 2
ANA, average number of alleles; Ae, effective number of alleles; AR, allelic richness; He, expected heterozygosity; Ho, observed heterozygosity;Fis, within-breed heterozygote deficiency; dEHW, number of loci deviated from Hardy–Weinberg equilibrium for each population.*, parameters calculated with all markers except MCW0103.**, parameters calculated with all markers except MCW0014.
Two STRUCTURE analyses were carried out in this study. The first was performed using commercial and Algerian populations; the second was performed using only the Algerian population. The most probable number of clusters was estimated according to the best mean log-likelihood score resulting in the highest percentage of membership coefficient (q) to each clus- ter (Pritchard et al.2000). The [L(K)] increased shar- ply from K =2 to K=7 and decreased afterwards, while its standard deviation increased (Figure S2), indicating that K =7 captures the major proportion of the genetic structure present in the data (Figure 4a) and that only a minor proportion of it is described by higher K values.
At K=2, the three Algerian ecotypes clustered together with three label lines ‘Lab-B’, ‘Lab-C’ and
‘Lab-D’ and one purebred line ‘WEL’. The BEL, Br-f and Lab-A commercial populations formed a second group, whereas Br-m showed intermediate results. At K= 3, the WEL and Lab-B lines separated from the other two clusters and separated from each other at K= 4, whereas Br-m, Lab-A, Lab-C and Lab-D clustered together at K=4 and BEL and Br-f remained together. At K =5, Br-m clustered with BEL and Br-f, whereas Lab-B and Lab-C clustered together and Lab-D showed an heterogenous compo- sition. At K =6, Br-m definitely separated from BEL and Br-f, which clustered again with Lab-A. Lab-C and Lab-D clustered again together. At K=7, they were 4 clusters of commercial populations: WEL was isolated; BEL clustered with Br-f; Lab-A clustered with Lab-B; Br-m, Lab-C and Lab-D clustered
Table 2Reynolds distance DR(above diagonal) and FST distances (below diagonal) among all populations with 21 markers. Abbreviated population names are found in Table 1
pop CT IP HL GGG GGS BEL WEL Br-f Br-m Lab-A Lab-B Lab-C Lab-D
CT 0.122 0.124 0.425 0.402 0.519 0.524 0.470 0.367 0.587 0.537 0.411 0.341
IP 0.007* 0.122 0.433 0.430 0.534 0.541 0.480 0.380 0.597 0.561 0.424 0.358
HL 0.009* 0.006 0.430 0.421 0.543 0.527 0.481 0.372 0.597 0.552 0.435 0.373
GGG 0.170* 0.178* 0.174* 0.341 0.570 0.636 0.506 0.491 0.610 0.598 0.521 0.487
GGS 0.149* 0.172* 0.163* 0.088* 0.535 0.619 0.512 0.469 0.618 0.599 0.520 0.497
BEL 0.238* 0.267* 0.269* 0.325* 0.282* 0.724 0.578 0.621 0.718 0.719 0.603 0.585
WEL 0.230* 0.266* 0.243* 0.421* 0.393* 0.523* 0.678 0.654 0.785 0.721 0.627 0.654
Br-f 0.201* 0.216* 0.214* 0.250* 0.254* 0.329* 0.458* 0.519 0.642 0.627 0.552 0.477
Br-m 0.117* 0.130* 0.122* 0.233* 0.210* 0.379* 0.424* 0.263* 0.667 0.649 0.504 0.419
Lab-A 0.286* 0.320* 0.311* 0.388* 0.395* 0.507* 0.627* 0.414* 0.448* 0.727 0.688 0.617
Lab-B 0.245* 0.284* 0.268* 0.364* 0.366* 0.516* 0.523* 0.390* 0.419* 0.526* 0.643 0.604
Lab-C 0.146* 0.161* 0.168* 0.262* 0.261* 0.357* 0.393* 0.295* 0.242* 0.470* 0.403* 0.431
Lab-D 0.097* 0.110* 0.120* 0.213* 0.220* 0.328* 0.423* 0.205* 0.147* 0.377* 0.355* 0.167*
*Significant value with p<0.001.
Figure 2NeighbourNet for all populations with 21 markers based on Reynolds distance, DR. Abbreviated population names are found in Table 1.
Figure 3Dendrogram of allele-sharing distances between each individ- ual of all populations with 21 markers. Abbreviated population names are found in Table 1.
together, but Lab-C and Lab-D showed some relation- ships with the clusters of Algerian chickens. Br-m separated from the other populations at K=9 (data not shown).
The three Algerian ecotypes grouped together as a different group from K= 5. At K= 7, the three eco- types appeared as an heterogeneous group formed essentially of three clusters, referred thereafter as gene pools A (red, 44% of all Algerian chickens), B (blue, 29% of all Algerian chickens) and C (yellow, 19% of all Algerian chickens). The proportions of these three gene pools differed across the three eco- types (Figure S3a). At these K values, we observed the occurrence of two homogeneous groups within
the three Algerian ecotypes: the first consisted of 11 individuals from CT ecotype corresponding mainly to gene pool B with 97% and the second consisted of 12 individuals from HL ecotype with 96% of gene pool C. Each of these two groups corresponded to a single flock: the first located in the Boughirate village in the wilaya of Mostaganem and the second in the Ain El Hadjar village in the wilaya of Saida; the two flocks have been isolated and closed. The analysis carried out for the Algerian ecotypes only showed similar results (Figure 4b).
Comparison of individual membership results for K =7 revealed that 32 (14%) Algerian chickens had a q-value higher than 0.2 for clusters of commercial
Table 3Assignment of individuals to a population based on their genotypes for 21 markers
CT IP HL GGG GGS BEL WEL Br-f Br-m Lab-A Lab-B Lab-C Lab-D
CT 113 (111)-1 (107)-3 (1) (2)
IP (31)-20 52 (46)-4 (1) (1)
HL (44)-24 (59)-9 68
GGG 15 1
GGS (2) (1) 16
BEL (20) (21) (9) 25
WEL (19) (25) (15) 25
Br-f (5) 25
Br-m (19) (23) (16) 25 (1)
Lab-A (20) (21) (8) 24
Lab-B (18) (14) (7) 24
Lab-C (23) (24) (21) 24 (3)
Lab-D (20) (20) (15) (1) 20
Row shows the original population and column shows the population to which individuals are affected. In diagonal, the size of each population.
Abbreviated population names are found in Table 1. (n): there is another population for which the probability is higher than 5% but is less than the probability of assignment to the original population; n: the probability of assignment to the original populations is>5% but there is a higher value for assignment to another population.
(a)
(b) Figure 4Estimated membership coefficients
of each individual to the inferred K cluster involving (a) three Algerian local chicken eco- types and 8 commercial populations (K from 2 to 7) and (b) only three Algerian local chicken ecotypes (K 2 and 3). In brackets, the number of runs with similar solutions (SSC>0.95) that has been used to compute the mean Q-matrix.
Abbreviated population names are found in Table 1.
birds. 24 of these 32 chickens belonged to the CT eco- type, and 15 of them originated from the wilaya of Mostaganem (Figure S3b).
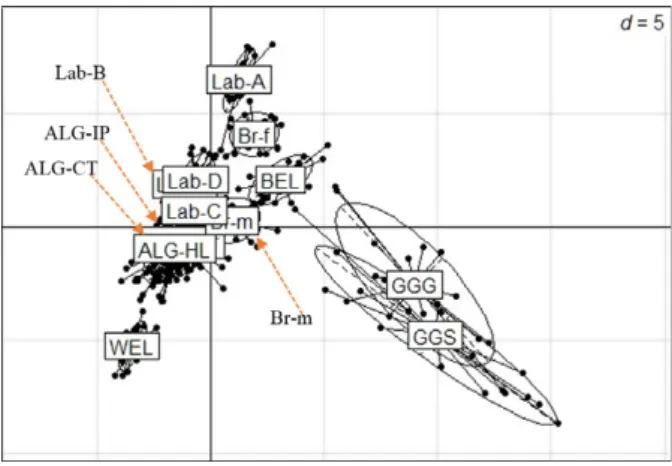
The PCA analysis (Figure 5) showed that the three Algerian ecotypes grouped together, indicating a high level of admixture. This analysis showed that the nearest breeds to Algerian ecotypes were the three label lines Lab-C, Lab-D and Lab-B as well as the broi- ler male breed (Br-m). As expected, wild jungle fowls were very diverse as compared to Algerian and com- mercial chickens.
Influence of environment
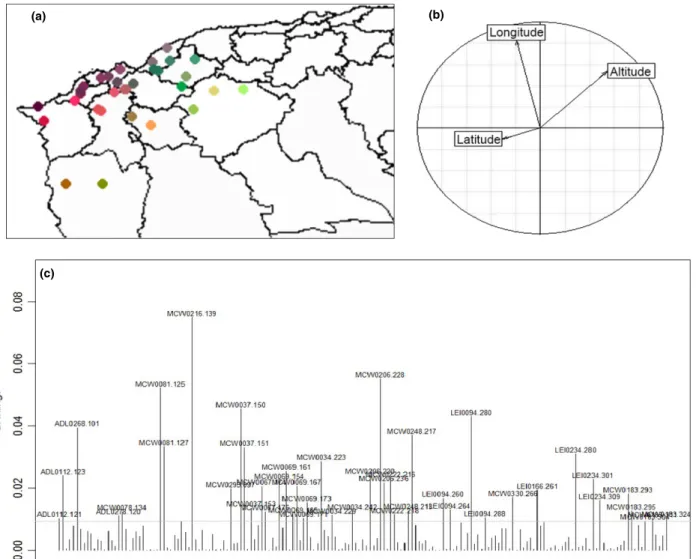
The PCAIV made possible to quantify the proportion of the diversity between individuals explained by the geographical origin (Figure 6). The three explanatory variables, latitude, longitude and altitude included in the analysis could explain 2.56% of the total variabil- ity between Algerian local chickens. The Monte Carlo test permutations (permutations 999) showed that the variability explained by the model was highly sig- nificant (p<0.01). The first axis explained 41.53% of the variance due to geography and the second axis 33.91% of the variance. Using RDA function in pack- age vegan to analyse the effect of each variable sepa- rately showed that the principal vector influencing individual variation on the first axis was altitude. This variable explained 1% of the interindividual variabil- ity (39% of variability due to model). To get some insight into the underlying causes of the differentia- tion due to altitude, we inspected the associated allele loadings. This revealed that the constriction of first axis was largely driven by one allele: allele 139 for the
MCW0216 locus. Such shifts in allele frequencies might be suggestive of natural selection or adaptive traits.
Discussion
Genetic diversity of Algerian chickens
Except for MCW0103 and MCW0098, all microsatel- lite loci exhibited more than 4 alleles indicating they were appropriate for a genetic diversity analysis (Bar- ker 1994). Furthermore, Takezaki & Nei (1996) have determined that gene diversity should be in the range of 0.3–0.8 in the populations, in order that markers to be useful for measuring genetic variation. Average value of gene diversity (He) for all populations in the present study was 0.67. This confirmed that these markers were appropriate for measuring genetic variation.
The mean number of alleles was highest in the Algerian ecotypes, followed by wild and commercial populations, indicating high level of genetic variability of Algerian chicken compared with the other popula- tions in this study. It was higher than that estimated for several African native chicken ecotypes, geno- typed with 22 microsatellites among the 23 used in this study (Leroy et al. 2012), whereas it was lower than values found for Zimbabwean chicken ecotypes (Muchadeyi et al. 2007). However, such variation in number of alleles per locus might be strongly influ- enced by sample size and/or sampling strategy. Private alleles are a source of genetic diversity. The Algerian population showed a rather high number of private alleles, but some of them had low frequencies and contributed little to genetic variation. On the con- trary, 53% of private alleles of wild populations had a frequency higher than 0.13, indicating a significant contribution to genetic variation in these populations.
Estimates of heterozygosity showed a high level of diversity in the Algerian chicken ecotypes, in the range of estimates generally obtained for local chicken populations. This diversity may indicate a higher effective population size for introduced chickens, and/or ancient population admixture fol- lowing multiple introductions. The observed hetero- zygosity values appeared to be lower than the expected ones for two of three Algerian ecotypes.
Several factors can contribute to a lower heterozy- gosity than expected in a population, one reason might be inbreeding. In case of inbreeding, the defi- cit would affect most of the loci in a similar way (Hoda & Marsan 2012). However, within Algerian ecotypes, six of 23 loci showed a significant deficit
Figure 5Representation of the distribution pattern of the three Alge- rian ecotype and reference populations obtained by principal compo- nents analysis (PCA). Abbreviated population names are found in Table 1.
of heterozygotes. Other factor that can also cause a deficit of heterozygotes in the population might be the presence of ‘null alleles’ (non-amplifying alleles); however, the test for null alleles in Alge- rian chickens was not conclusive. Finally, the most probable explanation of this deficit is the presence of population fragmentation within the ecotypes which may lead to a Wahlund effect.
Lower levels of diversity were observed in the com- mercial breeds as compared to the village chickens.
However, the genetic diversity of broiler lines, Lab-B and Lab-D lines was still much higher than the genetic diversity of the other label lines and the commercial layers. The lowest heterozygosity values were observed in WEL and Lab-A, which is also a dam line selected on egg number. Such differences between commercial lines may reflect differences in the size of
the base population according to line, with founder effects in these two lines. The high diversity observed in the Algerian ecotypes is consistent with the random breeding of these local populations and the unre- corded migration of birds between flocks which causes a continuous gene flow between flocks, as described previously for other scavenging chicken populations in Africa (Mtileniet al.2011; Leroyet al.2012).
Genetic differentiation according to history and geography
Genetic distance measures based on gene frequencies can be a good indicator of the history of the chickens domesticated. Large genetic distances were found between the Algerian population and label or pure- bred populations. The relatively highFSTestimate for (a)
(c)
(b)
Figure 6Results of PCAIV: (a) Extrapolation of results of PCAIV analysis on the map; position of coloured dots representing the sampling locations;
difference of colours reflects the low (2.56) but significant (p<0.01) diversity due to the geographical factors. (b) Correlation circle between the three explanatory variables. (c) Associated allele loadings.
commercial breeds indicates that each population rep- resents a limited sample of the total gene pool. This high level of population divergence in purebred lines was expected because they are based on different founder breeds, raised as closed flocks and selected for different production traits (Delany 2003). On the con- trary, the low genetic diversity between ecotypes is certainly due to the mode of reproduction, the exten- sive system of management of village farms and movement of birds with their owners of an area to another. Usually, the farmer buys chickens in the market, or from neighbour farms without any infor- mation or control of their origin. These factors favour a permanent gene flow and create greater diversity within population. The pattern of clustering observed with the allele-sharing distance measures among indi- vidual chickens reflected the admixture of individuals coming from different ecotypes, which was also revealed by the high assignment probabilities between ecotypes. This reflects also the high gene flow and intermixing of gene pools between ecotypes and sug- gests that they are genetically very close. The only exceptions were these two farms which appeared to operate as closed breeding units. Whereas a relatively high proportion of IP and HL chickens were assigned to CT ecotype, the reverse was not true, which may be explained by the highest diversity observed in the CT ecotypes as compared to the other two ecotypes.
Presumably, the coastal region is a region of introduc- tions and mixing of domestic chickens, which contrib- ute to the high genetic diversity of local chickens of western Algeria. Following the Phoenicians’ influ- ence, who dispersed the chicken in the Mediterranean basin, Algeria undergone several colonial con- quests (Roman, Spanish, Ottoman and French), and probably each has left its mark on the Algerian agri- culture in general, and on the breeding of domestic fowl, in particular. Indeed, the entry of chickens in Algeria was every time by sea, followed by distribu- tion to inland areas.
Structure analysis and multivariate analysis (PCA) also showed a high degree of genetic similarity between individuals of three ecotypes and high level of ecotypes admixture.
Although the genetic distances between Algerian ecotypes were very low, the PCAIV showed a low but significant contribution of geography to the genetic diversity of the three ecotypes. In fact, according to the results of the RDA, the altitude is the principal vector influencing the variation of individuals, whereas in our study area, altitude is proportional to the temperature, which suggests that temperature has an effect on the genetic variation of individuals. The
proportion of variation due to geographical location, and indirectly to climatic conditions, is low. This is certainly due to the non-controlled exchanges made by farmers especially in the traditional weekly and monthly markets where farmers meet from different wilaya (Mahammiet al.2014). This stirring made by traditional markets prevents any structuring of local chickens in western Algeria. If any, structuring is pos- sible in the case of closed and isolated farms that appeared as two homogeneous and different groups in structure results.
The current study identifies the contribution of the marker MCW0216 to the geographical differentiation between ecotypes. It would be interesting to analyse the diversity with a wide variety of local populations to better identify regions of the genome most affected by the effect of the geography.
Introgression from commercial lines into Algerian local chickens
Introgression of commercial blood into indigenous flocks may be not negligible, we observed 14% (32 of 233) individuals with q-values>0.2 for the clusters of commercial breeds. This may be due to unrecorded crossing with commercial chickens as no farmer or farm in the study area has declared the set-up of improvement programmes by crossing with commer- cial breeds. Leroy and co-workers (Leroyet al.2012) have also revealed gene flow between commercial and local chicken populations in Morocco and Camer- oon. This introgression might have major impacts on the population structure.
The proportion of introgression was higher in CT ecotype as compared to IP and HL ecotypes; this may be due to the fact that the coastal region has a higher number of state and private commercial farms as a result of a high demand from the numerous popula- tion.
The most represented breed in the introgression is Lab-D. Furthermore, the two commercial lines exhib- iting the lowest distance to Algerian chickens are Lab- D and Lab-C. According to the information provided by the breeders, these lines are not exported to Alge- ria. However, a previous, unrecorded, introduction cannot be excluded, all the more that these two lines carry the naked neck gene, which has been shown to occur at low frequency in Algerian chickens. The ori- gin of the naked neck mutation is not well known and there is no indication supporting an African ori- gin for this mutation, which has most probably been introduced. Further studies should be set up to com- pare the genome sequence surrounding the mutation
in a range of chicken populations to refine the history of this mutation.
Conclusions
The results obtained in this study are consistent with the high variability observed for phenotypic traits in Algerian chickens and reflect the loose management of this population. The lack of a breeding or selection programme for these chicken populations and the importance of exchanges of chickens between farmers through local markets favour the diversity within population and result in a low level of genetic differ- entiation. Evidence of gene flow between commercial and Algerian local populations was observed, which may be due to unrecorded crossing with commercial chickens. However, Algerian local chicken popula- tions must be safeguarded as an important reservoir of genetic diversity.
Acknowledgements
The authors express their sincere gratitude to the Algerian farmers in giving access to their chickens for phenotypic measurement and blood sample collec- tion. The strong support of Mrs Marie-Yvonne Bo- scher is gratefully acknowledged, who made possible the genotyping of Algerian chickens in LABOGENA typing laboratory, INRA, Jouy-en-Josas, France. Sin- cere thanks go also to Celine Chantry-Darmon, Lucie Genestout and all staff of LABOGENA, for their wel- come and technical assistance during microsatellite genotyping. The authors are grateful to Gregoire Leroy and Tatiana Zerjal for their help and advice for STRUCTURE analysis in GABI.
References
Al-Atiyat R. (2009) Diversity of chicken populations in Jordan determined using discriminate analysis of perfor- mance traits.Int. J. Agric. and Biol.,11, 374–380.
Barker J. (1994) A global protocol for determining genetic distances among domestic livestock breeds. Proc. 5th World Congr.Genet. Appl. Livest. Prod.,21, 501–508.
Belkhir K., Borsa P., Chikhi L., Raufaste N., Bonho- mme F. (1996) GENETIX 4.05, logiciel sous Windows TM pour la genetique des populations. Laboratoire Genome, Populations, Interactions: CNRS.UPR. 9060.
Montpellier, France: Universite Montpellier II., 5000, 1996–2004.
Bryant D., Moulton V. (2004) Neighbor-net: an agglomer- ative method for the construction of phylogenetic net- works.Mol. Biol. Evol.,21, 255–265.
Chapuis M.-P., Estoup A. (2007) Microsatellite null alleles and estimation of population differentiation.Mol. Biol.
Evol.,24, 621–631.
Davila S., Gil M., Resino-Talavan P., Campo J. (2009) Evaluation of diversity between different Spanish chicken breeds, a tester line, and a White Leghorn popu- lation based on microsatellite markers.Poult. Sci.,88, 2518–2525.
Delany M.E. (2003) Genetic diversity and conservation of poultry. In: W.M. Muir, S.E. Aggrey (eds), Poultry Genetics. CABI Publishing CAB International, Trow- bridge, UK, Breeding and Biotechnology, pp. 257–281.
Dessie T., Tadesse M., Yami A., Peters K. (2003) Village poultry production system in the Central Highlands of Ethiopia.Trop. Anim. Health. Pro.,33, 521–537.
Felsenstein J. (1989) PHYLIP-phylogeny inference package (version 3.2).Cladistics,5, 164–166.
Goudet J. (1995) FSTAT, a program to estimate and test gene diversities and fixation indices (version 2.9. 3).J.
Hered.,86, 485–486.
Hall S.J., Bradley D.G. (1995) Conserving livestock breed biodiversity.Trends Ecol. Evol.,10, 267–270.
Hillel J., Groenen M.A., Tixier-Boichard M., Korol A.B., David L., Kirzhner V.M., Burke T., Barre-Dirie A., Cro- oijmans R., Elo K. (2003) Biodiversity of 52 chicken pop- ulations assessed by microsatellite typing of DNA pools.
Genet. Sel. Evol.,35, 533–558.
Hoda A., Marsan P. A. (2012) Genetic Characterization of Albanian Sheep Breeds by Microsatellite Markers, Analy- sis of Genetic Variation in Animals, Prof. Mahmut Calis- kan (Ed.), ISBN: 978-953-51-0093-5, InTech, Available from: http://www.intechopen.com/books/analysis- of-genetic-variation-inanimals/genetic-characterization- of-albanian-sheep-breeds-by-microsatellite-markers.
Huson D.H., Bryant D. (2006) Application of phylogenetic networks in evolutionary studies.Mol. Biol. Evol.,23, 254–267.
Jakobsson M., Rosenberg N.A. (2007) CLUMPP: a cluster matching and permutation program for dealing with label switching and multimodality in analysis of popula- tion structure.Bioinformatics,23, 1801–1806.
Jombart T., Pontier D., Dufour A. (2009) Genetic markers in the playground of multivariate analysis.Heredity,102, 330–341.
Leroy G., Kayang B.B., Youssao I.A., Yapi-Gnaore C.V., Osei-Amponsah R., N’Goran E.L., Fotsa J.-C., Ben- abdeljelil K., Bed’hom B., Tixier-Boichard M. (2012) Gene diversity, agroecological structure and introgres- sion patterns among village chicken populations across North, West and Central Africa.BMC Genet.,13, 34.
Mahammi F.Z., Gaouar S.B.S., Tabet-Aoul N., Tixier-Boi- chard M., Sa€ıdi-Mehtar N. (2014) Caracteristiques mor- pho-biometriques et systemes d’elevage des poules locales en Algerie occidentale (Oranie).Cah. Agric.,23, 1–11.
Marshall T., Slate J., Kruuk L., Pemberton J. (1998) Statis- tical confidence for likelihood-based paternity inference in natural populations.Mol. Ecol.,7, 639–655.
Moula N., Antoine-Moussiaux N., Farnir F., Detilleux J., Leroy P. (2009) Rehabilitation socioeconomique d ‘une poule locale en voie d ‘extinction: la poule Kabyle (Thayazit lekvayel).Ann. Med. Veter,153, 178–186.
Msoffe P.L., Mtambo M.M., Minga U., Juul-Madsen H.R., Gwakisa P. (2005) Genetic structure among the local chicken ecotypes of Tanzania based on microsatellite DNA typing.Afr. J. Biotechnol.,4, 768–771.
Mtileni B., Muchadeyi F., Maiwashe A., Groeneveld E., Groeneveld L., Dzama K., Weigend S. (2011) Genetic diversity and conservation of South African indigenous chicken populations.J. Anim. Breed. Genet.,128, 209–218.
Muchadeyi F., Eding H., Wollny C., Groeneveld E., Mak- uza S., Shamseldin R., Simianer H., Weigend S. (2007) Absence of population substructuring in Zimbabwe chicken ecotypes inferred using microsatellite analysis.
Anim. Genet.,38, 332–339.
Paetkau D., Calvert W., Stirling I., Strobeck C. (1995) Mi- crosatellite analysis of population structure in Canadian polar bears.Mol. Ecol.,4, 347–354.
Piry S., Alapetite A., Cornuet J.-M., Paetkau D., Baudouin L., Estoup A. (2004) GENECLASS2: a software for genetic assignment and first-generation migrant detec- tion.J. Hered.,95, 536–539.
Pritchard J.K., Stephens M., Donnelly P. (2000) Inference of population structure using multilocus genotype data.
Genetics,155, 945–959.
Rannala B., Mountain J.L. (1997) Detecting immigration by using multilocus genotypes.Proc. Natl Acad. Sci. USA, 94, 9197–9201.
Reynolds J., Weir B.S., Cockerham C.C. (1983) Estimation of the coancestry coefficient: basis for a short-term genetic distance.Genetics,105, 767–779.
Rousset F. (2008) genepop’007: a complete re-implemen- tation of the genepop software for Windows and Linux.
Mol. Ecol. Resour.,8, 103–106.
Takezaki N., Nei M. (1996) Genetic distances and recon- struction of phylogenetic trees from microsatellite DNA.
Genetics,144, 389–399.
Supporting Information
Additional Supporting Information may be found in the online version of this article:
Table S1The sampling location and the number of individuals examined for the three Algerian ecotypes.
Table S2 Variability parameters of microsatellite markers over all populations.
Table S3 Private alleles for each locus and each population.
Figure S1 Dendrogram of allele-sharing distances between each individual of three Algerian chicken ecotypes with 23 markers.
Figure S2 STRUCTURE analysis involving three Algerian local chicken ecotypes and 8 commercial populations, (a): Mean log likelihood (L(K)) and stan- dard deviation (SD) per K value and (b) similarity according to the number of cluster K (K=1 to 10).
Figure S3 (a) Proportion of the three gene pool (A, B and C) and clusters of commercial birds in three Algerian ecotypes CT (Coastal), IP (Inland plains) and HL (Highlands), esteemed at best value of K (K=7) with 21 markers. (b) Number of chickens with q-value>0.2 for clusters of commercial birds in each ecotype and each wilaya. Abbreviated ecotype and wilaya names are found in Table S1.