HAL Id: halshs-00324390
https://halshs.archives-ouvertes.fr/halshs-00324390
Submitted on 24 Sep 2008HAL is a multi-disciplinary open access
archive for the deposit and dissemination of sci-entific research documents, whether they are pub-lished or not. The documents may come from teaching and research institutions in France or abroad, or from public or private research centers.
L’archive ouverte pluridisciplinaire HAL, est destinée au dépôt et à la diffusion de documents scientifiques de niveau recherche, publiés ou non, émanant des établissements d’enseignement et de recherche français ou étrangers, des laboratoires publics ou privés.
Impact of Bt Cotton on the Farmer’s Livelihood System
in China
Guiyan Wang, Yuhong Wu, Wangsheng Gao, Michel Fok, Weili Liang
To cite this version:
Guiyan Wang, Yuhong Wu, Wangsheng Gao, Michel Fok, Weili Liang. Impact of Bt Cotton on the Farmer’s Livelihood System in China. ISSCRI International Conference ”Rationales and evolutions of cotton policies”, May 2008, Montpellier, France. �halshs-00324390�
1
Impact of Bt Cotton on the Farmer’s Livelihood System in China
Guiyan Wang1 Yuhong Wu2 Wangsheng Gao2 Michel Fok3 Weili Liang11
Hebei Agricultural University, P. R. of China 071001 wanggy@hebau.edu.cn
2
China Agricultural University; 3CIRAD, Annual Cropping Systems, Montpellier, France
Abstract:
In order to analyze the impacts of Bt cotton on the farmers’ livelihood system, we interviewed 169 farmers and extension personnel in the main cotton production areas in Hebei province in the year 2002 and 2003. An integrative method was used in which a multidisciplinary approach was employed including agronomy, economics and sociology. The results showed that the application of Bt cotton increased the cotton growing area as well as farmers' income. For 67% of the farmers interviewed, cotton area has been continuously increasing since 1997. The cotton net margin in one cropping cycle came out to be higher than the combined net margins of wheat and corn in two cropping cycles. The income from cotton played a significant role in the investment to education, leisure and health care. The socio-economic impacts of cotton production are nevertheless not yet optimal because there were still many factors limiting them. Lack of labor and land were the main limiting factors. Productivity is restrained by the high price of Bt cotton seeds which pushed farmers to keep seeds from their own cotton production (42% of the farmers in 2002 and 2003). Farmers are still lacking technical command in using Bt-cotton: 78% of the farmers admitted that while more than 94% of the farmers complained not getting information from local extension and technical services. More success in using Bt-cotton calls upon going beyond providing seeds and asks for continuous assistance from research and extension department, notably to achieve a full knowledge of the Bt-cotton characteristic so as to optimally integrate it into the farmers’ system.
Keywords: China, Bt Cotton, biotechnologies, impact evaluation, Livelihood
L'impact du coton-Bt sur la viabilité
du système de production cotonnière en Chine
Résumé
Dans le but d'analyser les impacts du coton-Bt sur la viabilité du système de production paysanne, nous avons interviewé 169 paysans ainsi que le personnel de vulgarisation dans la principale zone de production cotonnière de la province du Hebei au cours des campagnes 2002 et 2003. Une méthode intégrée a été utilisée en suivant une approche multidisciplinaire associant agronomie, économie et sociologie. Les résultats montrent que le coton-Bt a fait augmenter les surfaces cotonnières ainsi que les revenus. Pour 67% des paysans enquêtés indiquent avoir continuellement augmenté la surface consacrée depuis 1997. Le revenu du coton, en un seul cycle se révèle supérieur au revenu combiné d'un cycle de blé et d'un cycle de maïs. Le revenu issu du coton joue un rôle significatif en faveur de l'investissement pour l'éducation, loisir et soins médicaux. Les impacts socio-économiques ne sont néanmoins pas optimaux car ils sont encore limités par divers facteurs. Le manque de main-d'œuvre et de terre en sont les principaux. La productivité est réduite par le prix élevé des semences de coton-Bt ce qui pousse les paysans à utiliser les semences de leur propre production (cas de 42% des paysans en 2002 et 2003). Les paysans manquent encore de maîtrise technique dans l'utilisation du coton-Bt : 78% des paysans l'admettent alors que 94% d'entre eux se plaignent ne pas obtenir d'information de la part des services techniques ou de vulgarisation. Un plus grand succès dans l'utilisation du coton-Bt suppose d'aller au-delà de la simple fourniture de semences et il interpelle pour une assistance continue en R&D, notamment pour parvenir à une connaissance complète des caractéristiques du coton-Bt pour pouvoir l'intégrer de manière optimale dans le système de production du paysan.
1.
Introduction
Genetically modified cotton (Bt cotton) was commercially planted in 1997 in Hebei Province, China. After that, the adoption of Bt cotton spread rapidly in most provinces of the country. In 2002, the Bt-cotton was cultivated on 2.1 million ha by about 5 million farmers in the whole country because of the economic benefit they gain. This positive economic impact is reported in many other countries. At the world level, many research works have documented the positive impacts to farmers through the Bt-cotton use. Bt cotton is technically efficient and economically profitable for the farmers who cultivate it as compared to the traditional varieties. Benedict and Altman (2001) estimated that the overall average reduction in the use of insecticide is 2.2 in USA. Clive James (2002) reported that Bt cotton has led to a consistent decrease in the number of insecticide sprays.
In developing countries, many papers concentrate on the impacts and adoption of Bt cotton on smallholders. Traxlar (2001) examined the economic and environment impact of Bt cotton in Mexico, the paper showed that Bt cotton could reduce input cost and increase income of Mexican farmers although he found that only wealthy farmers are using Bt cotton varieties. Ismael et al (2001) analyzed the economic impact of Bt cotton on smallholders in South Africa. The paper indicates that using Bt cotton varieties could increase yields and decrease the insecticides, but the cost the seeds were highly increased.The author also indicated that the increase of yield and the decrease of insecicides were more than the increased the cost of seed, and the Bt cotton also increased the farmers’ income.. Elena and Matin Qaim et al conducted he study on the adoption of Bt cotton by farmers in Argentina; they found that the high price of Bt cotton varieties in Argentina was not leading as extended use of Bt-cotton as one might expect.. In China, Pray et al (2001,2002), using the data of a series of surveys from 1999 to 2001 on the Bt cotton production in the main cotton production provinces in the Northern part of China, along the Yellow River valley. The papers demonstrated that the farmers’ adoption of Bt cotton has led to decreasing production costs and increasing yields of cotton, very indicative of what has been achieved in other developing countries.
In china, since the liberalization of the agricultural economy, the farmers have become the most primary economic decision-makers in agricultural systems. The extent to which they master the new Bt-cotton technology and they have the needed production resources should the technology adoption and the economic impact which would result. This is an aspect which is little addressed so far in most papers dealing with the Bt-cotton use in China. This is the ambition of this paper by analyzing the factors and the impacts of the Bt-cotton adoption on the farmers’ livelihood system at the farm level.
This paper is organized as follows: section 2 gives details on materials and methods and provides a description of the features of the cotton growers from the data collected; section 3 appraises the impacts of Bt cotton on the farmers’ livelihood; section 4 analyses the factors which are limiting the extent of the impacts.
2.
Data and Methods
This paper is based on research work conducted in Hebei Province which is located in the Yellow River Valley, in the North of China. This is the province which has traditionally contributed a lot to the Chinese cotton production. In this Province, the main cotton areas consist of Districts of Handan, Xingtai, Hengshui and Cangzhou and the counties of Xinji and Fengnan. The cotton production in Hebei Province has grown a lot till the early 1990s before the outbreak of bollworm resistance to insecticides. After that, the production declined till the commercial release of Bt-cotton in 1997. Clearly, the adoption of Bt-cotton can be associated to a real revival of cotton production and to the positive economic impacts acknowledged to cotton. For this reason, because there were almost no more non-Bt cotton being grown by the time of the study conducted (in 2003, it was estimated that 99% of cotton growers were using Bt-cotton varieties) so as to properly assess the specific impact from Bt-cotton, it is not exaggerated to confuse connect the cotton effect on the farmers' system livehood to the Bt-cotton effect.
In Hebei province, cotton production depends mostly on manual works and a low extent on the machines. The average cotton area is 0.26-0.33ha per household, which is the same as the level of the whole country. The survey was conducted with the aim of capturing the farmers’ cultivation practices and economic results in using the Bt
3
cotton varieties in connection with the farmer structures, their command in the chemical control with reference to the Bt cotton use. The survey covered six villages from the five important districts in the cotton production areas of the province, which includes 208 households in 2002 and 2003, among them there were only 39 households using non-Bt cotton varieties. Sampling methods were used during survey are as follows: firstly, we chose Feixiang, Guangzong, Shenzhou and Hejian counties from typical cotton production regions. And secondly, we chose typical village from every county and chose smallholders at random from the villages. We assure the number of valid questionnaires is not less than 20 in each and every village. The survey in 2003 was cinducted again by using the same survey questionnaire that in year 2002; in other words, we had the same group of smallholders surveyed during two years, so as to ensure continuity of the survey and to capture eventual changes of farmers' practices or opinions meanwhile. In the agricultural system, the household selected one or several livelihood strategies depending on the natural, physical, financial, human and social capital. In Hebei Province, agriculture is the main source income for the household, especially comes from planting. In the main crops, the income from cotton is the main source. Therefore, using the canonical correlation analysis to analyze the relationship between cotton income and the consumption expenditure of the household and deeply explain the extend impact of the cotton and the influencing factors.
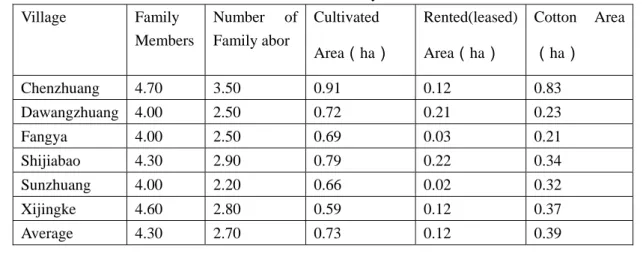
The surveyed farms were representative of the smallholdings, which characterized the situation of agriculture of China (Table 1). According to the survey, the average family size was of 4.30 persons, cultivating on 0.73hectare, in which the cotton area accounted for 54.2%. The average number of family labors involved in fieldworks was 2.70 persons.
Table 1The characteristics of the survey are summarized in the. Village Family Members Number of Family abor Cultivated Area(ha) Rented(leased) Area(ha) Cotton Area (ha) Chenzhuang 4.70 3.50 0.91 0.12 0.83 Dawangzhuang 4.00 2.50 0.72 0.21 0.23 Fangya 4.00 2.50 0.69 0.03 0.21 Shijiabao 4.30 2.90 0.79 0.22 0.34 Sunzhuang 4.00 2.20 0.66 0.02 0.32 Xijingke 4.60 2.80 0.59 0.12 0.37 Average 4.30 2.70 0.73 0.12 0.39
3.
Impacts on the rural household’s income and expenditure by adopting
Bt cotton
3.1.
Impacts on incomes
According to the survey, the average yield of Bt cotton was 3560.9kg/hm2 in 2002 and 3231.2 kg/hm2 in 2003. The yield of non Bt cotton was 1279.5 kg/hm2 in 2002 and 1524.3 kg/hm2 in 2003. The armers who adopt non Bt cotton the income o f the family per year was lower than the family who adopt Bt cotton. The reasons for adoption non Bt cotton was the high price of Bt cotton seeds. The farmers planting non Bt cotton can not buy seeds on the seed market and they have no choice but to use the seeds that a few years ago. Because of the high yield, the farmers gain the high profit from the Bt cotton. In 2002, the net profit of Bt cotton was 8708.6 yuan(RMB)/ hm2 and 3059.4 yuan(RMB)/ hm2, it was obviously that the income from Bt cotton was higher than the non Bt cotton. In 2003 the climat was very fit for the growth of cotton, the income of Bt and non Bt cotton were higher than that of 2002, and they were 13633.3 yuan (RMB)/ hm2 and 7231.7yuan/ hm2 respectively. In a word, the adoption of Bt cotton increased the farmers’ income.
canonical correlation analysis. The canonical correlation analysis is a statistical method, which study the correlations between two groups of variables. First of all, two groups of feature vectors with the same pattern sample are extracted, and the correlation criterion function between the two groups of feature vectors is established. Then, based on this criterion function, their canonical correlation features are extracted to form effective discriminating vectors for classification.
In this section, we try to analyze the impacts of using Bt-cotton on the household’s income and expenditure. This analysis is conducted by using the data collected in 2002, in Hengshui district.In the second stage we use the canonical correlation analysis to deeply analyze how expenditures are influenced by the income deriving from Bt cotton. According to the data, the total income of household was divided into four parts: agriculture income, wages, property income and transfer income, this is consistent with what is implemented in China to capture farmers' income and living standard. However, crop production accounted for 68.2 % in the agricultural income of the farmers. Cotton production is the main cash crop for all villages, representing 60.7% of total crop income,so the Bt cotton income was separated from the planting income to analyze the Bt cotton income (Table2).These income components are denominated as follows for the correlation analysis:
x1 – the net income of Bt cotton(not include the cost of manual work); x2 – planting income (not include Bt cotton);
x3- wages;
x4 - The animal husbandry income, mainly the net income of raising the pig and cattle; x5 – others.
It comes out that the surveyed farms are still very resource-dependent to agricultural activities. In the farmers family, the income from planting (not include cotton) was the main source of the total income, and the next was the Bt cotton. In Hebei province, the same as the whole country, the income of wages and planting account for more than 50% of the total income in the households (Table 2 ).
Table 2 the total income of sample village (Yuan) The sample village wages animal husbandry planting (not include cotton)
Bt cotton others Net income 1 1209.23 1809.89 6195.44 4938.57 1236.33 15389.46 2 3014.11 89.22 8028.48 5109.60 539.48 17420.48 3 1374.38 2653.00 6345.89 4368.89 711.32 15453.46 4 2986.86 836.00 5134.03 3600.20 680.68 13487.75 5 3521.50 4502.23 7327.19 5886.47 472.90 23857.78 Average 2421.22 1978.21 6606.20 4780.74 728.14 17121.79
5
3.2.
Data needed for the canonical correlation
The implementation of the canonical correlation asks for using data on farmers' expenditures. According to the
countryside investigation team's statistical classification, the main expenditures in rural household are categorized and denominated as follows:
y1 -the cost of planting (only includes material cost); y2 -animal husbandry cost (only includes material cost);
y3 -the cost of the tertiary-industry;
y4 -the cost of productive fixed asset owned by household; y5 - tax expenditure;
y6 -living expenditure; y7-other costs.
Table 3 the result of canonical correlation analysis between the net income and consumption expenditure of rural household
canonical correlation coefficient standard error Significant correlation test
The percentage of the income group variables to its own typical variables %
The percentage of the income group
variables to its opposition typical
variables % 1 0.869 0.065 0.016 84.15 58.68 2 0.475 0.102 0.525 16.83 12.77 The first pair of canonical correlation coefficient is higher (Table 3), that is 0.869, and passed the significant correlation test (α=0.05). The second pair of canonical correlation coefficient was lower, and didn’t pass the significant correlation test. Therefore, only the first pair of canonical correlation coefficient was used to explain the relationship of income group variables and consumption expenditure variables. Based on the canonical correlation coefficient, the canonical correlation model was as follows:
U1=0.6037x1+0.3253x2+0.6806x3+0.3130x4+0.1231x5
V1=0.2795y1+0.6035y2-0.2313y3-0.0735y4+0.4643y5+0.3082y6+0.0889y7
According to the importance of the variables, the canonical correlation coefficient and the model, the order of the canonical correlation coefficient of consumption expenditure was: the animal husbandry cost y2>tax expenditure y5> living expenditure y6> the cost of planting y1. These variables were highly correlated with the income of wages and cotton, the corresponding coefficient was 0.6806 and 0.6037, and the next were planting income (not include Bt cotton) and the animal husbandry income.
The result showed that the income from cotton and wages was highly correlated with the expenditures for a farmer’s family. According to the analysis, it is obviously that the application of Bt cotton increased the income to keep the expenditure of the family.
3.3.
Canonical coefficient analysis between income and consumption expenditure of rural
household
From the above results, the cotton income and wages play an important in the farmers’ income, and the farmers want to increase the income and meet the livelihood’s need through productivity. In order to analyze the relation between the income and consumption expenditure, the paper also used the canonical coefficient analysis to find the correlations between income variable and the consumption expenditures variables. The income variables were the same as just be used, and the expenditure variables were selected as follows:
y1 - food expenditure; y2 – clothes expenditure; y3- house expenditure; y4 – the cost facilities for family; y5 –expenditure for health care; y6 – transportation and communication expenditure; y7 –education and
entertainment expenditure; y8 - others. The result was shown as follows:
Table 4 The result of canonical correlation analysis between net income and living expenditure of rural household
canonical correlation coefficient standard error Significant correlation test
1 0.889 0.065 0.011
2 0.754 0.102 0.043
According to table 4, two pair of models passed the significant correlation test (α= 0.05). The models are as follows: First: U1=0.1359x1+0.0526x2+0.9876x3-0.0246x4-0.1456x5 V1=-0.0828y1+0.5712y2+0.6483y3+0.4862y4-0.2754y5+0.2287y6+0.1439y7-0.0101y8 Second: U2=0.8780x1-0.2023x2-0.2247x3+0.3024x4-0.3809x5 V2=-0.3846y1+0.2835y2+0.0454y3+0.2430y4+0.3855y5-0.7532y6+0.5930y7+0.2807y8
In the first pair of model, the coefficient of wages was highest, and than the wages was seprated from the income variables. In the expenditure variables, the coefficient of house, clothes and facilities were higher, and there was a significant correlation between house, clothes, facilities expenditure and wages. The result showed that the wages satisfied the farmers for constructing house, clothes facilities.
In the second pair of model, the coefficient of cotton was higher than others, and that was showed that there was a significant correlation between the transportation, communication, education, health care expenditure and cotton income.
The income from cotton increased the income for farmers, but there are many factors influence the adoption and the income of Bt cotton.
4.
Factors limiting the impacts on livelihood
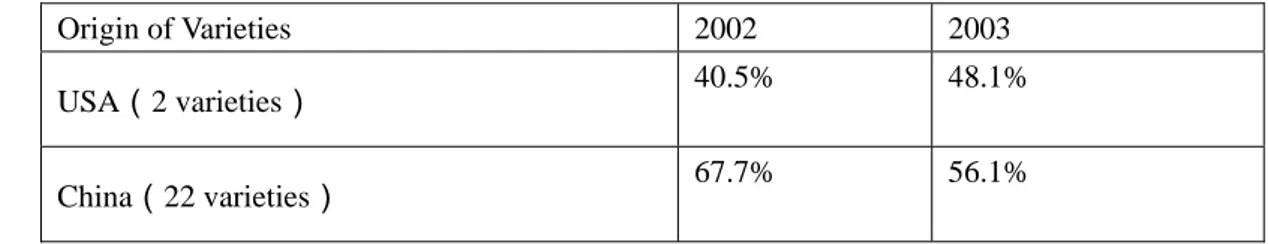
Table 5 Bt cotton varieties shares by origin according to the number of smallholders adoption
Origin of Varieties 2002 2003
USA(2 varieties) 40.5% 48.1%
China(22 varieties) 67.7% 56.1%
From the Bt cotton production in 2002 and 2003, American Bt cotton varieties are having a bigger share than Chinese varieties (table 5). But with the development of Chinese transgenic biotechnology, the share of Chinese Bt cotton varieties in the market increased and the areas have been increasing constantly. During the survey, we identified a total number of 24 Bt cotton varieties in Hebei Province. In addition to the two varieties introduced by the American firms, other 22 varieties were introduced from the Chinese institutes. There were several varieties whose origin remains unclear even to farmers, this means that farmers are not paying enough attention to the real origin of the varieties they use, this phenomenon cold be source of economic loss for them.
4.1.
Family labor and cultivation area and adoption
Cotton growing is not totally manual. Most farmers in Yellow River cotton districts used machines for ploughing and sowing but all other fieldworks were implemented by hands. It was estimated that the fieldworks from sowing to harvest will take about 303-329 human days per hectare.
The survey showed that 96.3% of the households did not hire temporary workers for the cultivation of cotton, 30.9 % of the households expressed they would not like to grow more cotton because of lack of labor and land. In farming families, most members only participate to field works occasionally, this is why the lack of labor is
7
felt as a constraint in spite of the tiny farm size. Therefore, lack of labor and land has become limiting factors for Bt cotton adoption and increase farm income.
4.2.
Farmers Owned Machines Involved in Bt Cotton
Table 6 Farmers equipment in sprayers Village Motorized sprayer (%) Knapsack Sprayer(%) Motorized sprayer price (yuan) Knapsack price(yuan) Chenzhuang 89.7 10.3 518.1 30.0 Dawangzhuang 46.2 53.8 403.3 27.3 Fangya 11.5 88.5 236.7 30.9 Shijiabao 12.5 87.5 395.0 18.6 Sunzhuang 0.0 100.0 29.0 Xijingke 4.2 95.8 400.0 33.9 Average 27.4 72.7 390.6 28.3
The table 6 showed that the number of motorized sprayer, ploughing machine and sowing machine used by farmers were higher than the ones who possess them. Because the motorized sprayer was expensive in which only 27.4% farmers have it. Most of farmers use knapsack sprayer for spraying chemicals. During the busy season, lack of labor and machine became more prominent. In order to catch the time of farming and the lost made by diseases and pests, the farmers usually rent machines, but sometimes it would delay the optimal opportunity for spray because of unavailability to get the machines.
4.3.
Lack of technical assistance to cotton growers
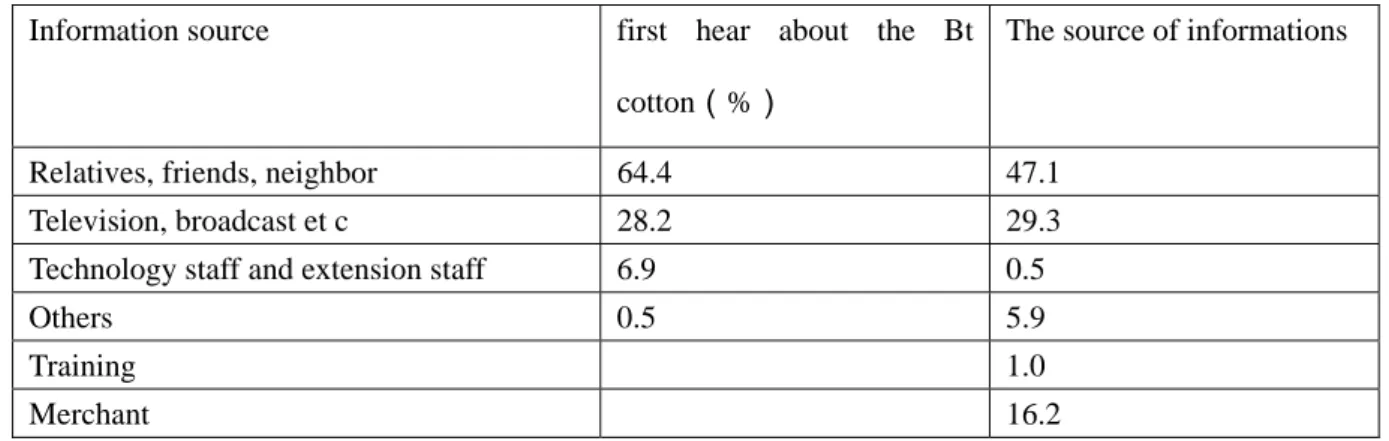
Table 7 the source of information that the smallholders obtained about Bt cotton Information source first hear about the Bt
cotton(%)
The source of informations
Relatives, friends, neighbor 64.4 47.1 Television, broadcast et c 28.2 29.3 Technology staff and extension staff 6.9 0.5
Others 0.5 5.9
Training 1.0
Merchant 16.2
The table 7 showed that, from the start, farmers have got little technical information on Bt-cotton from the extension services. Cotton farmers relied mainly on informal information, from relatives, friends and neighbors. Television and radio broadcast come next as source of information. They can seldom get the information from the agricultural extension staff and experts. But most of the households showed that they were very eager to know more on cotton production, demonstrating the shortfalls in the supply of technical information.
9
4.4.
High price of Bt-cotton seeds
Bt cotton variety is protected by IPR, so the price of seed is very high. In the survey, it was found that the price of varieties DP99B and DP33B was twice as that of Chinese, which was about 20yuan/kg. As farmers try to get seeds at lower prices, they were frequently victims of fake seeds and suffer from bad bad of cotton pests. The high price of seeds encouraged farmers to hold back seeds from their own production, which are less pure and marketed ones. It is observed that only a little bit more than one third of the farmers do buy new seeds every year. More than 60% of farmers used seeds they hold back, at least partly.
Holding back seeds was a traditional practice of farmers in the Hebei Province. This practice is sustained by the farmers' feeling that holding back seeds would not have a negative impact on its effectiveness and they usually renewed the seeds every 2-3 years. For the reasons, holding back seeds is regarded as a way for farmers to save money (47.3%) without risk of production decrease (28.7%) or or lacking pest resistance (24.0%) although this is debated by cotton experts.
4.5.
Not total satisfaction of the pest resistance
The real resistance to bollworm was a major matter of concern to most farmers. In spite of the widespread adoption of Bt-cotton in Hebei Province, only 62.5% of the farming households were satisfied with the resistance to bollworms. This attitude is sustained by the fact that pest resistance is not achieved through the whole cycle of cotton cropping. Although the resistance to pest is well acknowledged at the young stage of cotton plants (91.4% of the surveyed farmers), this resistance is felt insufficient for later stages, this is consistent with what is indeed observed in all countries using Bt-cotton.
4.6.
Pest resistance is only solution to part of the farmers' technical constraint
The reason for a new technology to be adopted by farmers is not only due to its specific advantages, but also it must adapt to the whole set of constraints of the farmer’s system. Beyond the advantages of resistance and labour saving, Bt cotton must satisfy the farmers' expectation for better yield, profitability and income security.. In our survey, more than 40% of the farmers were not satisfied with the effectiveness of Bt cotton, it is partly because they found that the pest resistance was not sufficient or because disease outbreak has become more important concern. In 2003, owing to the climatic conditions, disease infestations were much more serious than in other years. During the survey, 76.3% of the households thought that the desease was one of the most serious constraints to plant Bt cotton. In recent years, the highly profit of cotton makes the plant areas increased constantly, yet farmers often met problems in the restriction of the lands and the difficulties of the rotation of crops, which also deteriorated the outbreak of diseases.
Table 8 the reasons distribution by farmers according to the dissatisfaction of Bt cotton
Reasons % Not resistance to aphids and red spider 11.1
Poor resistance to disease 21.0 Not good on the efficiency of the Bt cotton in controlling bollworms
54.3
Others 5.6
4.7. The market risk that the farmers faced
The farmer is not only producer but also consumer in the agricultural production system. In this system they face natural and market risks. In recent years, the seed cotton price is higher than before although the price has fluctuated a lot. Reports from agricultural department of Hebei Province indicate that there is more than 100
thousands hectares land to grow cotton in the near future. Some of the farmers grow Bt cotton in the region where easily infects diseases and have more risks because of lack of information about Bt cotton. Once the climate and the market change, the farmers would suffer the loss.
5.
Conclusions
The application of Bt cotton increased the income from agriculture for farmers and also improved the households’ livelihood.
The application of Bt cotton increased the planting area for cotton and also the income of farmers. The planting area of 67% of the farmers interviewed has continuously increased since 1997. The planting area for cotton was 50.3% of the average field area farmers owned. The net product value of cotton for one season was higher than the combined net product value of wheat and corn for two seasons. The income from cotton made up to 60.3% of the total income from planting in a farmer family. The income from cotton has been the principal source for farmers. Hence, the adoption of transgenic cotton which has permitted a revival of cotton production has increased the income from agriculture to farmers.
The income from cotton played a significant role in the investment in education and leisure and health care. The results from canonical correlation analysis showed that the income from cotton was highly correlated with the investment and health care for a family.
Many factors limiting the impacts on the livelihood
From the commercial planting to the rapid spread, the farmers cannot acquire the completed information about Bt cotton. During the course of planting, the farmers only get the main information mainly through their social net. The cotton’s cultivated and yield characteristics have been modified because of the insert of Bt gene. The main varieties of the insect pests in the field have changed because of the changes of related systems and management.The farmers plant the Bt cotton only according to their previous experiences, thus would have negative impacts on the benefits and also would make mistakes about Bt cotton. In the survey, only one farmer knows the criteria for controlling the pest, others mainly depend on the experiences and the neighbors’ practices. In the other words, lack of technical assistance for planting was one of limiting factor to impove the yiekd of Bt cotton.
Farmers wanted to get more profits from planting Bt cotton, but lack of land and labor were have become the major limiting factors for Bt cotton adoption.
Hight Price of Bt seeds are also limited the more farmers to buy the top-qulity seeds to grow, and many farmers seleced holding back seeds to meet their deeds.
The transgenic technology showed complex form in the farmers’ livelihood system
The successful application of transgenic crops requires not only the adoption of the varieties and seeds but also continuous assistance from research and extension personnel and also farmers to have the best effect. The main species of the insect pests in the field have changed because of the changes of related systems and management. This influenced the benefit of farmers from planting cotton. Thus, research and extension personnel needed to assist and train farmers how to manage the changing situation and prevent the main insect pests in the cotton field. This will result in the sustainable development of the technique for transgenic cotton. The application of transgenic cotton is a good illustration of the need for an integrated approach in adopting a new technology. The supply of high quality seeds and the provision of technical messages to properly use Bt-cotton will help farmers to obtain higher return than it is now.
Therefore it is necessary for the agricultural department to help the farmers master the properties of Bt cotton and make it accurately integrated into the farmer’s system.
11
References
1. Benedict and Altman. (2001) Commercialization of transgenic cotton expressing insecticidal crystal protein. In Jenkins, J. and S. Saha (eds). Genetic Improvement of Cotton: Emerging Technologies. Science Publicationss, Enfield, New Hampshire, USA. 8: 137-201
2. Clive James. (2002) Global Status of Commercialized Transgenic Crops. Isaaa Briefs. International Service for the Acquisition of Agri-biotech Applications
3. Ismael, Y., Thirtle, C. and Beyer, L. (2001). Efficiency Effects of Bt Cotton Adoption by Smallholders in Makhathini Flats. KwaZulu-Natal, South Africa Paper for the 5th International Conference on Biotechnology, Science and Modern Agriculture: A New Industry at the Dawn of the Century. Ravello, Italy, June 2000.
4. Traxler, G., Godoy-Avila, S., Falck-Zepeda, J, Espinoza-Arellano, J. Transgenic Cotton in Mexico: Economic and Environmental Impacts [EB/OL]. http://www.biotech-info.net/Bt_cotton_Mexico.html, 2001 5. ]Qaim, M. and A. de Janvry. Bt cotton in Argentina: analyzing adoption and farmers’ willingness to pay, selected paper presented at the Annual Meeting of the American Agricultural Economics Association, Long Beach,2002-6-28
6. Elena,M. 2001. Economic Advantage of Transgenic Cotton in Argentina. Proceedings of Beltwide Cotton Conference .2001,1066-1068
7. Pray, C. E., Huang, J., Hu, R., and Rozelle, S. 2002. Five years of Bt cotton in China - the benefits continue. The Plant Journal, 31(4): 423~430.
8. Huang, J., R. Hu, C. Pray, F. Qiao, and S. Rozelle.2001. Biotechnology as an Alternative to Chemical Pesticides: A Case Study of Bt Cotton in China. Paper presented at the ISNAR Consultation “Biotechnology and Rural Livelihood — Enhancingthe Benefits”. The Hague.
9. Pray, C.E., Huang, J., Ma, D., and Qiao, F. 2001. Impact of Bt Cotton in China . World Development, 29: 813-825.
10.Tan Shengjiang, Chen Xiaofeng Li Dianmo etal 2001. Can other host crops become the refuge for the sensibilized bollworms? .Science bulletin , 46(13)