Université de Montréal
Detecting Uterine Cervical Cancer Cells Using Molecular
Biomarkers
par
Ahmed Mousa
Département de Sciences biomédicales
Faculté de médecine
Mémoire présenté à la Faculté de médecine
en vue de l’obtention du grade de Maître en Sciences biomédicales
Option générale
Novembre, 2014
© Ahmed Mousa, 2014
Université de Montréal Faculté des études supérieuresDetecting Uterine Cervical Cancer Cells Using Molecular
Biomarkers
Présenté par: Ahmed Mousa
a été évalué par un jury composé des personnes suivantes:
Dr Suzanne Fortin, président-rapporteur Dr Francis Rodier, directeur de recherche Dre Vanessa Samouëlian, codirectrice de recherche
i
RÉSUMÉ
Arrière-plan: les cellules tumorales circulantes (CTC) sont détectables dans de nombreux
cancers et peuvent être utiles cliniquement pour le pronostic de la maladie, pour mesurer la récidive et pour prédire la sensibilité aux medicaments chimiothérapeutiques. Au cours des dernières années, l’études des CTC dans de nombreux cancers tels que le cancer du sein, du poumon, du côlon et de la prostate a grandement évolué. Alternativement, il y peu d'études à ce sujet concernant le cancer du col de l’utérus (CCU). Objectifs: Notre objectif est d’optimiser le processus d'enrichissement des CTC dans le CCU et la détection moléculaire des biomarqueurs E6 et E7. Matériel et Méthodes: Dans l’optique de mimer la présence de CTC dans le sang, nous avons dilué des cellules cancéreuses CaSki VPH16-positif provenant d’un CCU dans du sang humain prélevé sur des volontaires sains. Les CaSki ont été collectées suite à une centrifugation par densité avec le Ficoll, la lyse des globules rouges (RBC) et la lyse des RBC combinée avec un enrichissement positif et négatif à l’aide de marqueurs de surface cellulaire. Les CTC ont été détectées par la mesure d’expression des oncogènes E6 et E7 du virus du papillome humain (VPH), de la cytokératine 19 (CK19) et de la cycline p16INK4 en utilisant la
technique quantitative en temps réel de Reverse Transcriptase-Polymerase Chain Reaction (qRT-PCR). Pour valider notre méthode de détection des CTC in vivo, nous avons recruté dix patientes atteintes d’un CCU VPH16 positif et six contrôles sains. Résultats: Dans le modèle de dilutions de cellules CaSki, la lyse des RBC seule ou combinée avec l'enrichissement négatif ou positif suggèrent des limites de détection de 1 CTC par mL de sang pour tous les biomarqueurs moléculaires utilisés. La sensibilité de détection est accrue lors de l'utilisation de l’enrichissement positif et négatif en réduisant le bruit de fond causé par les monocytes sanguins. Contrairement aux oncogènes E6 et E7, les marqueurs CK19 et p16INK4A ont été détectés chez
des individus sains, les niveaux d'expression de base appropriés doivent donc être déterminés avec précision par rapport aux patientes CCU. Le gradient de densité par Ficoll a une limite de détection de seulement environ 1000 cellules par mL de sang. Enfin, les CTC ont été détectées dans 2/10 patientes en utilisant le marqueur CK19. Cependant, ces patientes étaient négatives pour les oncogènes E6/E7. Le marqueur p16INK4A était exprimé au même niveau dans tous les
échantillons (CCU et normaux). Conclusion: Notre étude suggère que les oncogènes E6 et E7 du VPH16 sont les marqueurs biologiques les plus sensibles et spécifiques en qRT-PCR pour
ii
détecter les CTC dans le modèle de dilution de cellules de CCU dans le sang. Chez les patientes atteintes d’un CCU de stade précoce, seulement CK19 a révélé la présence potentielle de CTC, ce qui suggère que ces cellules sont rares à ce stade de la maladie.
Mots clés: cancer du col de l’utérus, cellules tumorales circulantes, RT-qPCR, E6 et E7, CK19,
iii
ABSTRACT
Background: Circulating tumor cells (CTCs) have been detected in many cancers and are used
in multiple clinical applications including disease prognosis, tumor recurrence prediction and prediction of tumor sensitivity to chemotherapeutic drugs. Studies in most major solid cancer(s) (breast, lung, colon and prostate) are progressing rapidly, but there has been very little progress concerning uterine cervical cancer (UCC).Objective: our aim is to optimize enrichment processes and the molecular biomarker-based detection of human circulating tumor cells (CTCs) in uterine cervical cancer (UCC). Material & Methods: To mimic CTCs in patients, we designed an experimental spiking model where the CaSki HPV16-positive UCC cell line was serially diluted and spiked into human blood collected from healthy volunteers. CaSki CTCs were enriched using either Ficoll density centrifugation, red blood cell (RBC) lysis or RBC lysis combined with cell surface markers negative or positive enrichment. CTCs were detected using real-time quantitative reverse-transcription polymerase chain reaction (qRT-PCR) to measure the gene expression of human papillomavirus (HPV) viral oncogenes (E6 and E7), cytokeratin 19 (CK19), or the cyclin dependent kinase inhibitor p16INK4A. Finally, ten HPV16- positive UCC
patients and six healthy controls were recruited to validate CTCs detection in vivo. Result: In the spiking model, RBC lysis alone or combined with negative or positive enrichment suggests detection limits close to 1 CTC per mL of blood for all molecular biomarkers used. The sensitivity of detection increased when using positive and negative enrichment probably by reducing the peripheral blood mononuclear cell-derived RNA background. Unlike HPV oncogenes, CK19 and p16INK4A were detected in normal individuals, thus appropriate basal
expression levels need to be accurately determined compared to cancer patients. Alternatively, Ficoll density gradient had a detection limit of only about 1000 cells per mL of blood. Finally CTCs were detected in 2/10 patients using CK19. None of the patients had E6/E7 transcripts and p16INK4A was expressed at similar level across all samples (cancer and healthy).
Conclusion: qRT-PCR of HPV16 E6 and E7 is the most sensitive and specific biomarker used
to detect CTCs in the spiking model. In early disease UCC patients, only CK19 revealed the presence of CTCs suggesting that these cells are rare at that stage of the disease.
Keywords: uterine cervical cancer, circulating tumor cells, qRT-PCR, E6 and E7 oncoprotein,
iv
CONTENTS
RÉSUMÉ ... i
ABSTRACT ... iii
CONTENTS ... iv
TABLE LIST ... viii
FIGURE LIST ... ix
ABBREVIATION LIST ... xi
Chapter I : INTRODUCTION ... 1
1.1 Circulating tumor cells and the induction of metastasis ... 1
1.1.1 Epithelial-Mesenchymal transition ... 2
1.1.2 Metastatic inefficiency ... 4
1.2 CTC Detection ... 5
1.2.1 Density gradient separation of mononucleated cells... 5
1.2.2 Size-based approach to CTC enrichment ... 6
1.2.3 Magnetic immunolabeling isolation ... 8
1.2.4 Microfludic systems for CTC isolation ... 9
1.2.5 Flow cytometry ... 13
1.2.6 Dielectrophoresis ... 14
1.3 Detection and clinical applications in selected cancers ... 16
1.3.1 Breast ... 16
1.3.2 Colon ... 17
1.3.3 Lung ... 17
1.3.4 Prostate ... 17
1.4 Human papillomavirus ... 18
v
1.6 CTCs in UCC ... 23
1.7 Hypothesis and Objective ... 24
Chapter II : MATERIALS AND METHODS ... 27
2.1 Cell Culture ... 27
2.2 Ficoll-Paque Density gradient enrichment ... 27
2.2.1 Validation ... 27
2.2.2 Enrichment of spiked cancer cells ... 28
2.3 Enrichment by RBC lysis ... 28
2.4 Flow cytometry strategy for sorting and counting CTCs ... 28
2.5 Real-time quantitative reverse-transcription polymerase chain reaction (qRT-PCR) .... 32
2.5.1 Reverse transcription ... 32
2.5.2 Multiplex real-time PCR reactions ... 32
2.6 Uterine cervical cancer patients ... 34
Chapter III : RESULTS ... 35
3.1 Validation of Ficoll-Paque Enrichment ... 35
3.2 E6 and E7 oncogenes expression after enrichment using Ficoll-Paque density gradients ... 35
3.3 Detection of spiked cancer cells using flow cytometry following Ficoll-Paque enrichment ... 37
3.4 Detection of spiked cancer cells by flow cytometry following RBC lysis enrichment .. 38
Chapter IV : ARTICLE ... 39
RÉSUMÉ ... 40
ABSTRACT ... 42
INTRODUCTION ... 44
vi
Cell Culture ... 46
CTC Enrichment ... 46
RNA Extraction ... 46
Real-time quantitative reverse-transcription polymerase chain reaction (qRT-PCR) ... 47
Preparation of Formalin-Fixed Paraffin-Embedded (FFPE) Lymph Node models ... 47
Correlation of the Mixed Cell Model to Lymph Node Metastasis ... 48
RESULTS ... 48
Analysis of HPV16/18 E6/E7 oncogenes expression from a mix population of fresh cells . ... 48
HPV 16/18 E6 and E7 oncogenes expression from FFPE cell mixtures ... 48
CTCs detection using molecular biomarkers ... 49
DISCUSSION AND CONCLUSIONS ... 50
FIGURE AND TABLE LEGENDS: ... 54
BIBLIOGRAPHY ... 64
Chapter V : RESULTS FROM UTERINE CERVICAL CANCER PATIENTS ... 67
Chapter VI : DISCUSSION ... 71
CTCs enrichment techniques ... 71
1) Ficoll density enrichment ... 71
2) RBC lysis ... 71
3) Positive and negative enrichment ... 71
CTCs detection ... 72
1) Flow cytometry ... 72
2) Detection using molecular biomarkers in experimental spiking model ... 73
3) Detection of CTCs in uterine cervical patients ... 75
vii
PERSPECTIVES ... 79 Chapter VII : BIBLIOGRAPHY ... 80
viii
TABLE LIST
Table II-I. Cell line ... 27
Table II-II. Sequence of primers and TaqMan probes. ... 33
Table III-I. Flow cytometry cell count following enrichment by Ficoll-Paque. ... 37
Table III-II. Flow cytometry cell count following enrichment by Ficoll-Paque: Detection limit. ... 38
Table III-III. Flow cytometry cell count following enrichment by RBC lysis ... 38
Table IV-I. Sequence of primers and TaqMan probes ... 62
Table IV-II. Calculation of micrometastatic focus volume in one cm lymph node... 63
Table IV-III. Detection limit of HVP oncogenes expression in fresh RNA ... 63
Table IV-IV. Detection limit of HPV oncogenes expression in RNA extracted from FFPE cells block. ... 63
ix
FIGURE LIST
Figure I.1. Invasion-metastasis cascade. ... 2
Figure I.2. Ficoll density separation of PBMC and tumor cells. ... 6
Figure I.3. Comparison of microfabrication and track-etched membranes ... 7
Figure I.4. CTC-chip. ... 11
Figure I.5. HB-chip ... 11
Figure I.6. Schematic presentation of the integrated micomagnetic-microfluidic device ... 12
Figure I.7. Microchip design for immunomagnetic detection of cancer cells ... 13
Figure I.8. Schematic diagram of the ApoStream device. ... 16
Figure I.9. HPV life cycle. HPV infection is confined to epithelial cells. ... 19
Figure I.10. The HPV genome and ORF function ... 20
Figure I.11. E6 and E7 molecular mechanisms of inducing malignant transformation ... 21
Figure II.1. Flow cytometry gating strategy to isolate GFP-positive spiked cancer cells ... 30
Figure III.1. Ficoll-Paque density gradient for cell separation ... 35
Figure III.2. Detection of HPV16 E6/E7 expression from CaSki UCC cells spiked into human blood following Ficoll-Paque density gradient enrichment ... 36
Figure III.3. HPV16 E6/E7 expression detection limits from CaSki cells spiked into human blood following Ficoll-Paque density gradient centrifugation ... 37
Figure IV.1. E6/E7 oncogenes expression in a mix of cell populations containing HPV positive and/or negative cells ... 56
Figure IV.2. E6/E7 oncogenes expression from formalin-fixed, paraffin-embedded UCC mixtures ... 57
Figure IV.3. Expression of E6/E7 pathway constituents from CaSki cells spiked into human blood following isolation by RBC lysis ... 58
Figure IV.4. E6/E7 expression in CaSki cells spiked into human blood following negative enrichment ... 59
Figure IV.5. Comparison E6/E7 expression detection from CaSki cells spiked into human blood following positive or negative enrichment... 60
Figure V.1. qRT-PCR of HPV16 E6/E7 in PBMC enriched from UCC patients ... 68
x
xi
ABBREVIATION LIST
A
A260/280: The ratio of absorbance at 260 nm and 280 nm.
ACK lysing buffer: Ammonium-Chloride-Potassium lysing buffer ADM: Automated digital microscopy
AKT: Protein Kinase B Ang-2: Angiopoietin-2
B
BAK: Bcl-2-homologous antagonist/killer
C
CDK: Cyclin-dependent kinase
cDNA: Complementary deoxyribonucleic acid CEA: Carcinoembryonic antigen
CEE: Cell Enrichment and Extraction™ channel
CHUM: Centre Hospitalier de l'Université de Montréal CK: Cytokeratin
CO2: Carbon dioxide CT: Cycle threshold
CTCs: Circulating tumor cells
D
DAPI: 4',6-diamidino-2-phenylindole ddH2O: Double distilled water DD-RT-PCR: Digital-Direct-RT-PCR DEP: Dielectrophoresis
depFFF: Dielectrophoretic field-flow fractionation DMEM: Dulbecco's Modified Eagle Medium DMSO: Dimethyl sulfoxide
DNA: Deoxyribonucleic acid
E
xii EGFR: Epidermal growth factor receptor
EGR: Epidermal growth factor
EMT: Epithelial-mesenchymal transition EpCAM: Epithelial cell adhesion molecule EPISPOT: Epithelial immuonSPOT
ERK: Extracellular-signal-regulated kinases ETOH: Ethanol
F
FACS: Florescence-activating cell sorting FAST: Fiber-optic array scanning technology FBS: Fetal bovine serum
FFPE: Formalin-Fixed Paraffin-Embedded FGF: Fibroblast growth factor
FIGO: The International Federation of Gynecology and Obstetrics FSC: Forward scatter
G
GEDI: Geometrically-enhanced differential immunocapture chip GFP: Green fluorescent protein
GSK3β: Glycogen synthase 3 beta
H
H&E: Haematoxylin and Eosin HGF: Hepatocyte growth factor HIF: Hypoxia-inducible factor HPV: Human papillomavirus
hTERt: Human telomerase reverse transcriptase HER-2: Human epidermal growth factor receptor 2
I
IGF-1: Insulin-like growth factor 1 IHC: Immunohistochemistry IL-6: Interleukin-6
xiii ITC: Isolated tumor cells
J
JAK: Janus kinase
JNK: C-Jun N-terminal kinases
L
LEF: Lymphoid enhancer-binding factor LN: Lymph node
LVSI: Lymphovascular space invasion
M
MEK: Mitogen-activated protein kinase pathway MET: Mesenchymal-epithelial transition
miRNA: microRNA
MNC: Mononucleated cells
MOFF: Multi-orifice flow fractionation MPAK: Mitogen-activated protein kinases mRNA: Messenger RNA
mTOR: Mammalian target of rapamycin
N
NSCLC: Non-small-cell lung carcinoma NTC: No template control
O
ORF: Open reading frames
OSNA: One-step nucleic acid amplification assay
P
p16INK4A : Cyclin-dependent kinase inhibitor inhibiting CDK4
p53: Tumor suppressor protein p53
PBMC: Peripheral blood mononucleated cell PBS: Phosphate buffered solutions
PCR: Polymerase chain reaction PDMS: Polydimethylsiloxane
xiv
Q
qPCR: Quantitative real time polymerase chain reaction
R
RAF: Proto-oncogene serine/threonine-protein kinase RAS: Rat sarcoma
Rb: Retinoblastoma tumor suppressor protein RBC: Red blood cell
RNA: Ribonucleic acid RPM: Revolutions per minute
RT-PCR: Reverse transcription polymerase chain reaction
qRT-PCR: Real-time quantitative reverse-transcription polymerase chain reaction
S
SARMS: Scorpion Amplification Refractory Mutation System SLN: Sentinel lymph node
SNAIL: Snail family zinc finger SSC: Sideward scatter
T
TBP: TATA-binding protein TCF: T cell factor
TGF: Tumor growth factor TJP: Tight junction protein
TWIST: Twist basic helix-loop-helix proteins
U
UCC: Uterine cervical cancer UV: Ultraviolet
V
VEGR-A: Vascular endothelial growth factor-A
W
WBC: White blood cell
Z
1
CHAPTER I : INTRODUCTION
1.1 Circulating tumor cells and the induction of metastasis
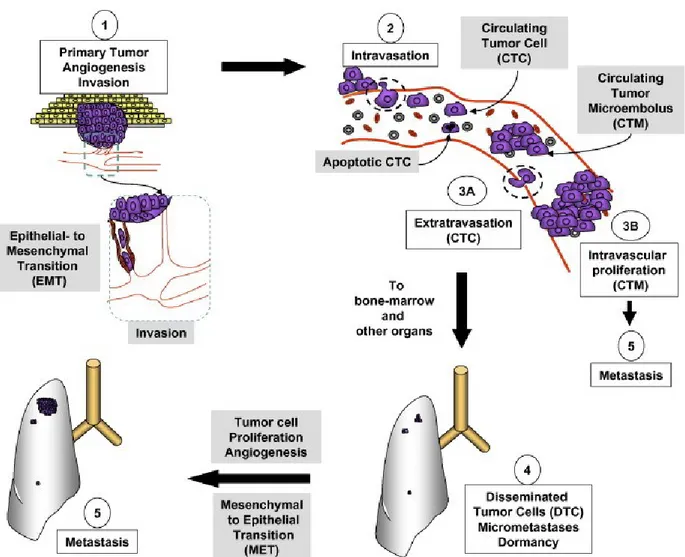
Metastasis is a complex process that involves interplay between tumor cells and the hosting organs. The invasion-metastasis cascade consists of multiple steps as shown in Figure I-1. Tumor cells found within the blood stream are defined as circulating tumor cells (CTCs) [1, 2]. At the primary tumor site, multiple signaling pathways function to promote cellular proliferation, growth inhibition, survival, and invasion, as well as induce tumor angiogenesis, all of which facilitate the metastatic process [3]. Tumor cells proliferate in response to various growth factors; such as transforming growth factor-beta (TGF-β), insulin-like growth factor-1 (IGF-1), and epidermal growth factor (EGF) that activate the RAS, mTOR, and PI3K-AKT signaling pathways [4, 5]. Once tumors reach a critical size where the local blood supply does not meet cellular metabolic demands, hypoxia-inducible factor (HIF) is released to promote the expression of the angiogenic proteins vascular endothelial growth factor-A (VEGF-A) and angiopoietin-2 (Ang-2) [6]. This event results in the formation of neovasculature characterized by high permeability, abnormal structure, and variable blood flow [7-9]. In addition, the co-influence of TGF-β and HIF promotes a process termed epithelial-mesenchymal transition, where epithelial tumor cells acquire a mesenchymal phenotype that allows them to invade, migrate, and gain cancer stem cell-like traits [10-12]. Once through the basement membrane, tumor cells can reach the blood and lymphatic vessels and travel to distant organ sites where they can then move out. Cells within this founder population undergo mesenchymal-epithelial transition (MET) and begin to form metastatic tumor colonies.
Studies suggested that hematogenous spread is an early event that can occur prior to diagnosis of the primary tumor [13]. Multiple studies have reported that the detection of CTCs in early-stage cancer is associated with poor prognosis [14]. CTCs have been identified in many epithelial cancers, including breast, colon, lung, and prostate, and have recently demonstrated prognostic value [15-18]. Other applications of CTC detection include assessing treatment response, genetic mutations, drug resistance screening and selection of patients for adjuvant systemic treatments [19].
2
Figure I.1. Invasion-metastasis cascade. Angiogenesis initiates to meet the metabolic demand
of rapidly proliferating tumor cells, and subsequently promotes EMT. Cells then gain invasive and migratory properties, and intravasate into blood vessels. Within the blood, CTC travel to distant organ sites and extravasate to form dormant foci. Cells can remain dormant or undergo MET to form metastatic microtumors. Most CTCs undergo apoptotic death and are phagocytosed by macrophages; however, the minority can proliferate within the vasculature to form CTM, and eventually metastasis. Reprinted from reference [20]. © 2007, with permission from Elsevier.
1.1.1 Epithelial-Mesenchymal transition
Epithelial-mesenchymal transition (EMT) is a process by which cells that bear epithelial characteristics transform into mesenchymal phenotype, and can be classified into three types
3
based on biological context: type I occurs during embryogenesis and organogenesis; type II during fibrosis, tissue regeneration, and wound healing; and type III during tumorigenesis [21]. EMT results in a spectrum of cells exhibiting partial to full mesenchymal phenotypes and stem cell properties. This is a complex process that involves cross-talk between several molecular pathways [22]. The increased expression of HIF within the tumor results in upregulation of TGF-β and integrins, as well as transcriptional mediators with known roles in mediating EMT, such as TWIST, SNAIL, and ZEB. These factors repress epithelial genes and activate mesenchymal genes leading to a loss of apicobasal polarity and spindle shape morphology and increases in cell motility and invasiveness (Table I-I).
Cancer stem cells are cancer cells that have acquired characteristics of normal stem cells, including self-renewal and differentiation. They are responsible for tumor heterogeneity and the formation of metastatic foci [23]. They have been identified in multiple solid and hematological malignancies by the expression of population-specific markers, and account for tumor drug resistance and progression [24].
4
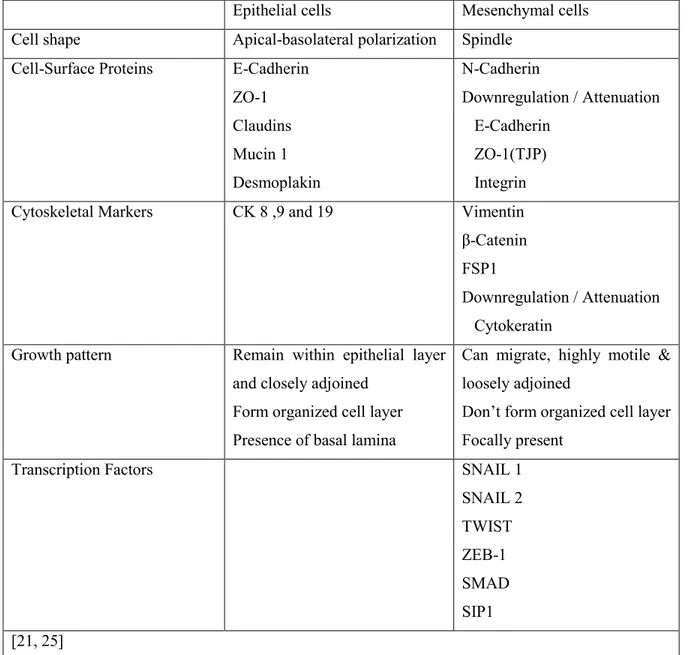
Table I-I. Comparison between epithelial and mesenchymal phenotype.
Epithelial cells Mesenchymal cells Cell shape Apical-basolateral polarization Spindle
Cell-Surface Proteins E-Cadherin ZO-1 Claudins Mucin 1 Desmoplakin N-Cadherin Downregulation / Attenuation E-Cadherin ZO-1(TJP) Integrin
Cytoskeletal Markers CK 8 ,9 and 19 Vimentin
β-Catenin FSP1
Downregulation / Attenuation Cytokeratin
Growth pattern Remain within epithelial layer and closely adjoined
Form organized cell layer Presence of basal lamina
Can migrate, highly motile & loosely adjoined
Don’t form organized cell layer Focally present
Transcription Factors SNAIL 1
SNAIL 2 TWIST ZEB-1 SMAD SIP1 [21, 25] 1.1.2 Metastatic inefficiency
It is important to note that the presence of CTCs does not imply the development of metastasis. Evidence from animal models has demonstrated that only a subset of tumor cells, of the millions injected, survive to successfully graft and form tumors [26]. For instance, a study using murine melanoma cells tagged with a fluorescent marker demonstrated that 87.3% of cells remained within the vasculature at 90 minutes post-injection into the superior mesenteric vein of mice. By day three, 82% had extravasated into tissue, and 63% were lost by day 13. The majority of
5
extravasated cells remained as dormant, solitary cancer cells, with only 0.07% and 0.01% of injected cells forming micrometastases and macroscopic tumors, respectively [27]. Notably, most CTCs either undergo anoikis (programmed cell death as result of cell detachment from the extracellular matrix), immunogenic cell death, or apoptosis after extravasation and formation of dormant micrometastatic foci [27-30].
1.2 CTC Detection
CTCs are often detected by isolating the exceedingly small CTC population from billions of RBC and millions of WBC within the blood through a process termed enrichment. There are many methods used to enrich and identify CTCs. The following section will discuss the techniques currently available and their advantages and disadvantages.
1.2.1 Density gradient separation of mononucleated cells
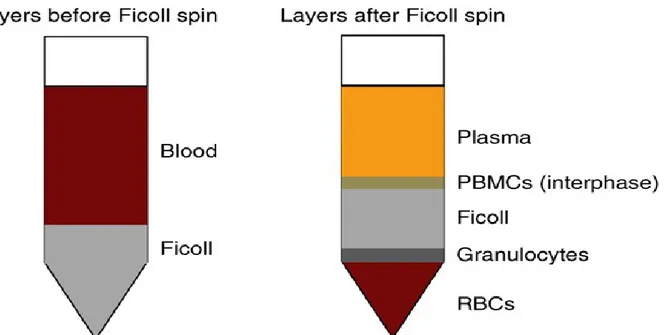
Density gradient separation is a classical method to separate cells based on their buoyant density [31]. Ficoll-Paque-Hypaque (GE Healthcare) is the most used separation reagent (Figure I-2). Blood is layered over the Ficoll-Paque in a conical tube and then centrifuged to form layers. Cells are arranged from bottom to top as red blood cells, granulocytes, density gradient, peripheral blood mononuclear cells (PBMCs), and plasma, where CTCs co-separate with the PBMC population. Collection of the PBMC must be performed immediately, otherwise cells begin to mix. This enriched population is then subjected to immuno-labeling, cytological analysis or molecular analysis in order to detect CTCs.
OncoQuick is a modified density-based method that uses a porous barrier to prevent the PBMC from mixing with granulocytes and RBC after centrifugation. In direct comparison, both found to have similar performance in CTC recovery, although OncoQuick provides a slightly higher purity of PBMCs that facilitates immunocytological analysis and limits false positives in real-time quantitative reverse-transcription polymerase chain reaction (qRT-PCR) screening. However, the increased purity comes at the expense of recovery, as OncoQuick has a recovery rate ranging between 70-90% due to the loss of normal and tumor cells to other phases [32].
Another alternative is RosetteSep™, which uses tetrameric antibody against glycoprotein A opposite of various leukocyte-specific antibodies, depending on your population of interest. The RosetteSep reagent is added to the isolated blood product. This results in the crosslinking of unwanted cells to RBC, forming rosette-like aggregates with high density, which
6
can then be pelleted with centrifugation. Importantly, this method has been found to minimize variability between operators and facilitate the processing of larger blood volumes [33].
Figure I.2. Ficoll density separation of PBMC and tumor cells. Blood is layered on top of
Ficoll density gradient and is followed by centrifugation. Cells are arranged from the bottom to the top based on their buoyant density: RBC, granulocytes, PBMC and tumor cells, and plasma. The PBMC interphase can then be collected and used to detect and/or characterize tumor cells by cytological examination, immuno-labeling, or molecular analysis. Reprinted from reference [34]. © 2014, with permission from Nature Publishing Group.
1.2.2 Size-based approach to CTC enrichment
Average CTCs are reported to be larger than normal blood cells with an average size of 20-25 µm compared to ~8 µm for normal leukocytes [35]. The isolation by size of epithelial tumor cells method, or ISET, uses a polycarbonate membrane with 8 µm pores. Whole blood is diluted with a buffer to fix cells, which are then filtered through the membrane. Cells larger than 8 µm trapped by the membrane are harvested, and then subjected to immunostaining and molecular analysis to detect and characterize the CTC population. This method has a reported detection sensitivity of one cell per mL of blood [36]. The main advantages of ISET include the enrichment of cells with intact morphology, as well as simplicity and reproducibility. However, its recovery rate ranges between 50-60% and tumor cells less than 8 µm are lost in the filtering
7
process [35], In addition, the membrane is fabricated by track etching to randomly distribute the pores, which might result fuse to create larger pores, and the clogging of pores can occur.
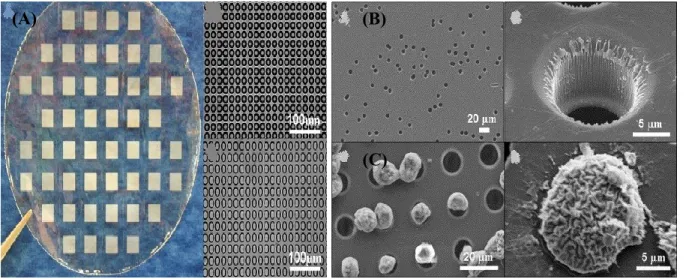
Although, optimized filter construction with microfabrication has led to the production of membrane pores with precise size, geometry, and density in order to overcome the major limitations associated with track etching, and has improved the recovery rate to 90% (Figure I-3) [37]. More recently, a 3D microfilter device has shown the ability to detect viable CTCs with a 90% capture efficiency from whole blood in 10 minutes [38].
Figure I.3. Comparison of microfabrication and track-etched membranes. Scanning electron
microscopy (SEM) imagining demonstrating (A) microfabrication with precise size and geometry compared to (B) track etching that can result in randomly placed and/or fused pores.
(C) SEM showing captured cells on microfabricated membrane. Reprinted from reference [37],
© 2007 with permission from Elsevier.
(A) (B)
8
1.2.3 Magnetic immunolabeling isolation
Epithelial cell adhesion molecule (EpCAM) is a transmembrane glycoprotein that mediates homotypic cell-cell adhesions on epithelial cells [39]. Antibodies targeting EpCAM have been used to isolate CTCs directly through a process called positive enrichment. In contrast, negative enrichment is used to deplete leukocytes from a heterogeneous population with antibodies targeting CD45, a cell surface antigen expressed by both leukocytes and lymphocytes.
The CellSearch® system (Veridex) is the only system approved by the FDA for the
detection of CTCs, and uses ferrofluid nanoparticles conjugated to anti-EpCAM antibodies to magnetically isolate epithelial cells. Enriched cells are then stained with DAPI (4′,6-diamidino-2-phenylindole) and for CD45 and/or cytokeratin 8, 18, or 19, and then analyzed with a CellTracks Analyzer. Cells positive for DAPI and cytokeratin, but negative for CD45, are considered CTCs. The system is semi-automated, fast, and has a detection sensitivity of 1 CTC/mL. This method is capable of detecting CTCs in 36% of tested patients, with 85% recovery and 0.1% purity [35, 40], however, it is subject to false positives as result of non-specific binding to Fc-receptor bearing cells, extraneous expression of epithelial antigens, inability to analyze cells, and false negatives for cancers that lack epithelial antigen expression due to EMT [35, 41-46]. Cells that are CD45 and CK positive are excluded from analysis and their prognostic value has not yet been evaluated; although, these cells can represent cancer stem cells or CTCs phagocytosed by leukocytes [47].
The AdnaTest is another platform to positively enrich CTCs using multiple markers immunomagnetically. RNA is then isolated from the enriched cells and used for a multiplex qRT-PCR to detect CTC based on the expression of tumor genes. AdnaTest has a sensitivity of 0.4 CTCs/mL of blood [48, 49].
Negative enrichment can be used to detect CTCs regardless of their surface antigen expression. Yang et al. recently evaluated multiple products to negatively enrich CTCs and found that an anti-CD45 tetrameric antibody complex manufactured by StemCell® provided
better enrichment than other products with average detection of 2.32 CTCs/mL of blood [50]. The variation in performance between different reagents can be explained by antibody binding capacity, as well as the size and composition of the magnetic particle [51]. Magnetic particles are bound to the antibody directly or indirectly through a secondary antibody. Indirect labeling by two-step binding was found to be more efficient and yields a higher affinity to cells [52]. The
9
loss of tumor cells due to leukocyte binding and their rarity within high background of leukocytes precludes the isolation of pure CTCs are disadvantages of negative enrichment-based analyses [53].
1.2.4 Microfludic systems for CTC isolation
Microfluidics is a system used to manipulate and process micro-volumetric fluids using microchannels. The advantages of microfluidic cell isolation include its high throughput, sensitivity, and resolution that facilitate CTC detection and separation at a low-cost with high efficiency. This process also provides for gene expression analysis at single cell level and integration with other technologies [54]. These features make it ideal for the detection and enrichment of CTCs with minimal cell loss. As such, multiple microfluidics-based platforms have been developed to isolate CTCs based on both physical and immunological characteristics.
1.2.4.1 Immunoaffinity based enrichment
Nagrath et al. developed a CTC-chip microfluidic device consisting of an array of 78,000 microposts coated with anti-EpCAM antibody embedded on silicon chip to capture CTCs [55]. Whole blood is passed through the chip at flow rate of 1-2 mL/h. CTCs were detected in 99% of cancer patients tested with an average purity of 55%, 80% recovery rate, and high experimental reproducibility. Enriched cells are 99% viable (Figure I-4) [55]. The same group reported on the detection and identification of CTCs with epidermal growth factor receptor (EGFR) genetic mutations in non-small-cell lung cancer using the Scorpion Amplification Refractory Mutation System (SARMS) technology designed to detect mutations involved in drug susceptibility or resistance. The CTC-chip detected CTCs in all tested patients with a median of 74 cells/mL of blood. Furthermore, EGFR mutations were identified from enriched CTCs in 95% of patients compared to 39% of patients from plasma examination [56]. The efficiency of the CTC-chip to enrich CTC is hindered with increasing the flow rate and shear force, and thus relies on laminar flow that reduce surface area of interaction.
Stott et al. developed the Herringbone (HB)-Chip that consists of a glass slide bonded to a polydimethylsiloxane (PDMS) structure, containing eight microchannels with patterned herringbones on their upper surface with their internal walls coated with anti-EpCAM antibody [57]. The herringbone structure generates passive microvortices that disrupt the laminar flow
10
streamlines that carries the cells to increase the number of cell-surface interactions (Figure I-5). This improves the capture efficiency by 40%, which can be maintained at flow rates up to 4.8 mL/h, compared to the 1-2 mL/h for CTC-chips.
Dickson et al. developed the Cell Enrichment and Extraction™ (CEE) channel composed
of 9000 randomly sized and positioned posts that are derivatized with streptavidin. Enriched cells are labeled with biotin-conjugated antibodies, which can then interact with streptavidin to capture CTCs. This allows for multiple surface markers to be targeted simultaneously with biotinylated antibodies to increase capture efficiency [58]. The capture efficiency of CEE is dependent on both antigen density and flow rate, and processing 8 to 10 mL of whole blood requires 7 to 9 hours.
Gleghorn et al. developed the geometrically enhanced differential immunocapture (GEDI) chip optimized to maximize interactions with large cells (15 to 25 µm) and reduce wall shear force to enhance the capture of CTCs in prostate cancer cells using prostate-specific membrane antigen-antibody [59]. This optimization resulted in a 40% increase in efficiency and CTC capture from whole blood.
Myung et al. further demonstrated the ability to capture CTCs through a functionalized epoxy glass immobilized with E-selectin and EpCAM antibodies [60].
11
Figure I.4. CTC-chip. (A) Whole blood is passed through the chip using pressure regulated
pump in laminar flow fashion. CTCs are captured against posts coated with anti-EpCAM antibody and can then be enumerated and characterized. Reprinted [61], © 2009 with permission from Wolters Kluwer Health . (B) SEM image demonstrating captured CTCs from a lung cancer patient. Reprinted from reference [55]. © 2007, with permission from Nature Publishing Group.
Figure I.5. HB-chip. (A-B) Microvorticies generated by the HB-chip that increases cell-surface
interactions compared to the CTC-chip (C-D) with laminar flow streamlines. Reprinted from reference [57]. © 2010, with permission from the National Academy of Sciences of the United States of America.
(B) (A)
(A) (B)
12
1.2.4.2 Immunomagnetic affinity
Kang et al. developed an integrated micromagnetic-microfluidic device to capture and culture CTCs from animal cancer models [62]. CTCs captured with Anti-EpCAM microbeads are directed toward a culture plate after enrichment with RBC lysis buffer. This method has 87% capture efficiency and enriched CTCs are >90% viable (Figure I-6).
Hoshino et al. later reported on a micromagnetic chip that captured CTCs with anti-EpCAM-conjugated ferrous nanoparticles from whole blood with average capture rate of 86% at 10 mL/h flow rate and sensitivity of 5 CTCs/mL of blood (Figure I-7) [63].
Chen et al. also described a negative enrichment of blood spiked with Jurkat T-cells into mononucleated cells (MNC) using a multistage magnetic-microfluidic disk [64]. Labeled cells are trapped and target cells collected in reservoir with successive increases in rotational speed. The average recovery of the device is 60%.
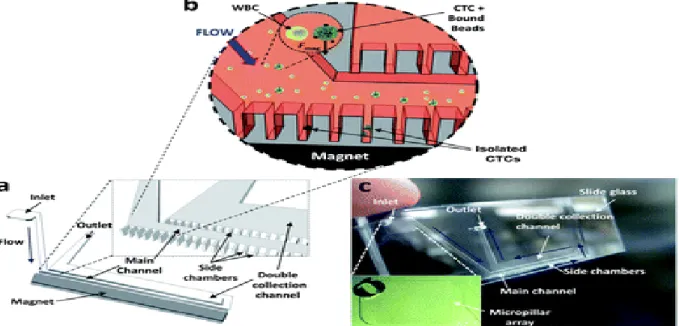
Figure I.6. Schematic presentation of the integrated micomagnetic-microfluidic device. The
devise is composed of a main channel and double collection channel lined by rows of dead-end side chambers. Magnetically labeled cells are collected when magnetic field is applied. Reproduced from reference [62]. © 2012, with permission from the Royal Society of Chemistry.
13
Figure I.7. Microchip design for immunomagnetic detection of cancer cells. Whole blood is
admixed with anti-EpCAM antibody functionalized Fe3O4 nanoparticles to label CTCs. The
blood then withdrawn using a regulated syringe pump through the chip where magnetic field collects labeled cells. Reproduced from reference [63]. © 2011, with permission from the Royal Society of Chemistry.
1.2.4.3 Sized based
Kuo et al. reported on a microchip optimized to detect spiked cancer cells based on size and deformability. The chip consists of a serpentine channel lined with rectangular apertures. This device captures CTCs with 90% or 50% recovery for fixed and unfixed cells from whole blood, respectively [65].
1.2.5 Flow cytometry
Advances in flow cytometry have allowed for the analysis of thousands of particles in a short amount of time and is currently used for cell sorting, counting, and biomarker detection. Fluorescence-activating cell sorting (FACS) separates cells based on their fluorescence following immunofluorescent labeling. Multi-parameter immunofluorescent labeling has demonstrated the ability to detect CTC [66], with Hu et al. reporting a sensitivity of one CTC for every 100,000 normal cells [67]. However, this platform lacks the sensitivity to isolate exceedingly rare cells, lengthy protocols to remove red blood cells and to stain the enriched population, as well as the high cost of the equipment [68].
14
Fiber-optic array scanning technology (FAST) combined with laser-printing optics can be used to excite 300,000 cells/second to achieve higher detection and sensitivity, and enables the processing of 100 million cells in 5 minutes [69]. Fixed cells are immunolabeled against cell surface markers and then read and analyzed with software to differentiate CTCs. However, this method lacks the capability to verify true positive cells. The author later improved the system by scanning isolated cells with automated digital microscopy (ADM). Despite these improvements, FAST/ADM only provides for the identification of viable CTCs, and not their enrichment, making it less conducive for clinical use necessitating the further characterization of CTCs [19].
Epithelial immuonSPOT (EPISPOT) is a technique to detect viable CTCs based on protein secretion. Negatively enriched cells are cultured for one to two days on plates coated with antibody-specific protein markers on a nitrocellulose membrane. Cells are then washed off and a secondary fluorochrome-tagged antibody is used to detect the captured protein [70]. CTCs are identified based on the immunospots. This technique allows for multiple markers to be evaluated simultaneously and provides for CTC quantification. It has also been used to detect CTCs in breast cancer patients [71, 72]. However, the process is lengthy and the protein markers must be actively secreted by the tumor in order for detection [70].
1.2.6 Dielectrophoresis
Dielectrophoresis (DEP) technology enables the detection of unlabeled cells based on their dielectric properties. As the cells are exposed to a non-uniform electrical field, they differentially migrate toward the electric-field maximum based on their membrane properties, size, morphology, density, metabolic activity [73].
Multiple DEP devices have been developed and optimized for the detection of CTCs [74]. Early technologies demonstrated a high recovery rate, purity, and viability [75-77], but was limited by its low throughput. Later, Gascoyne et al. developed dielectrophoretic field-flow fractionation (depFFF) to overcome these limitations, enabling the processing of up to 4.5 mL of blood with decreased time. [78]. However, the recovery efficiency ranged from 10-90% and was inversely related to PBMC concentration and chamber volume loading. Moreover, cell viability was dependent on immersion time, and most of the fractions collected first were non-viable; and could be the result of low voltage tolerance.
15
An integrated microfluidic-DEP device using multi-orifice flow fractionation (MOFF) and dielectrophoresis (DEP) was also developed by Moon et al [79]. MOFF is first used to enrich cancer cells based on size by hydrodynamic inertial force, and are then further sorted by DEP. The system enables continuous flow-through separation in contrast to other platforms based on non-continuous batch separation. The MOFF/DEP method has 78.81% recovery rate with high purity.
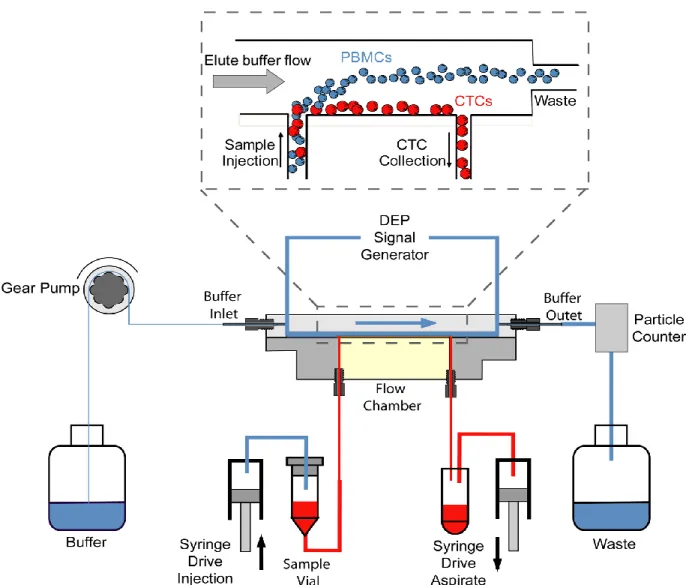
Gupta et al. introduced the ApoStream™ device comprised an integrated microfluidic
flow chamber-modified depFFF that isolates cells based on the crossover frequency in continuous flow mode (Fig. I-8) [80]. DEP exerts a force on levitating blood cells, leading to a transition from negative to positive force to pull cancer cells toward the chamber floor while other blood cells are repelled and exit the chamber. The device can process 1.2 × 10⁷
PBMCs/hour with an average recovery of 74.9%, high purity, and leaves 97.6% of the cells viable.
The major limitations of DEP in CTC enrichment are that whole blood cannot be processed, buffers must be optimized, purity issues resulting from some shared characteristics of CTCs and PBMC, and cells must be processed immediately to prevent early apoptotic changes that affect their dielectric properties [81, 82].
16
Figure I.8. Schematic diagram of the ApoStream device. Levitating PBMC are exposed to DEP
at a crossover frequency that separates PBMCs into waste chamber and CTCs into collection chamber. This crossover frequency ranges between 30-40 kHz for CTCs compared to 90-140 kHz for PBMCs. Reprinted from reference [80], © 2012, with permission from AIP Publishing LLC.
1.3 Detection and clinical applications in selected cancers
1.3.1 Breast
A prospective multi-center study reported that metastatic breast cancer patients with a detection of ≥0.67 CTCs/mL of blood using the CellSearch system had lower progression-free and overall survivals [83, 84]. Using the AdnaTest to detect and genetically profile CTCs, Tewes et al. was
17
able to predict treatment responses in 78% of cases [85]. Furthermore, the persistence of CTCs after treatment is associated with poor prognosis [14].
Multiple ongoing interventional trials evaluating the utility of CTCs in treatment selection [86]. STIC CTC METABREAST (NCT01710605) is designed to assess progression free survival and medico-economics in metastatic hormone-dependent breast cancer based on the baseline of CTCs count before treatment initiation. Following randomization, the CTC-driven decision cohort is treated with either hormonal therapy or chemotherapy based on cutoff of 5 CTCs/7.5 mL and compared to clinician choice cohort. In phase III trial, the SWOG 0500 (NCT00382018) randomizes metastatic breast cancer patients with persistent elevated CTCs at the first follow-up assessment to changing therapy versus maintaining therapy. The overall survival, progression-free survival and toxicity are the primary outcome measures of this trial. In innovative approach, The DETECT III study (EudraCT 2010-024238-46) is randomizing HER2-negative metastatic breast cancer to standard therapy versus standard therapy combined with anti-HER2 targeted therapy based on HER-2 status of detectable CTC to assess progression-free survival.
1.3.2 Colon
CTC persistence at 4 weeks post-surgical intervention in patients with stage II-III colorectal cancer is associated with earlier cancer recurrence, as determined by membrane-array and qRT-PCR analysis [87]. In a multi-institutional study, the qRT-qRT-PCR of multiple markers (CK/CEA/CD133) were used to detect CTCs in Dukes’ stage B and C found that CTC positivity was associated with lower disease-free and overall survival [88].
1.3.3 Lung
CTCs identified in NSCLC decreased in quantity with treatment when measured with the CTC-chip [55]. Maheswaran et al. described the detection of EGFR mutations in CTCs, which subsequently predicted drug response to EGFR tyrosine kinase inhibitor [56]. More interestingly, EGFR mutations were detected in 94% of patients with CTC analysis, compared to 34% by plasma testing.
1.3.4 Prostate
CTCs identified in 93% of castration-resistant prostate cancer patients with the CellSearch®
18
survival. Moreover, CTCs serial follow during treatment in castration-resistant prostate cancer served as surrogate marker to predict response to treatment and survival [90, 91]. In a randomized, double-blind, placebo-controlled, phase III trial assessing abiraterone acetate following docetaxel, CTCs enumeration was evaluated prospectively as surrogate efficacy response biomarker of overall survival in metastatic castration-resistant prostate cancer [92]. CTC conversion from unfavorable counts, defined as CTC ≥ 5/7.5 mL of blood, to favorable counts was predictive of overall survival.
CTCs have been detected in ovarian, hepatocellular carcinoma, bladder transitional carcinoma and many other types [93-95]. The field of CTCs detection and their clinical applications are evolving rapidly and provide insights into personalized medicine approach [96]. Isolating CTCs and successfully culturing them in ex-vivo enabled genomic profiling and assessing molecular pathways involved in tumorigenesis to predict sensitivity of targeted cancer therapy [97, 98]. In HER-2 negative breast cancer, 40% of patients with detectable CTC had HER-2 expression [99]. This finding has led to the initiation of The DETECT III study (EudraCT 2010-024238-46) that’s primary objective to evaluate treatment response targeting anti-HER-2 based on molecular characterization of detectable CTCs.
In summary, CTCs detection and characterization have a wide range of clinical applications; predict disease prognosis; evaluate response to treatment; genomic profiling; predict drug sensitivity and selection of patients for adjuvant systemic/targeted treatments.
1.4 Human papillomavirus
HPV is a non-enveloped, circular double-stranded DNA, epitheliotropic virus (Figure I-9). It belongs to the Papillomaviridae family and more than 100 types have been reported [100, 101]. HPV are classified into high and low risk types based on their oncogenic characteristics [102-104].
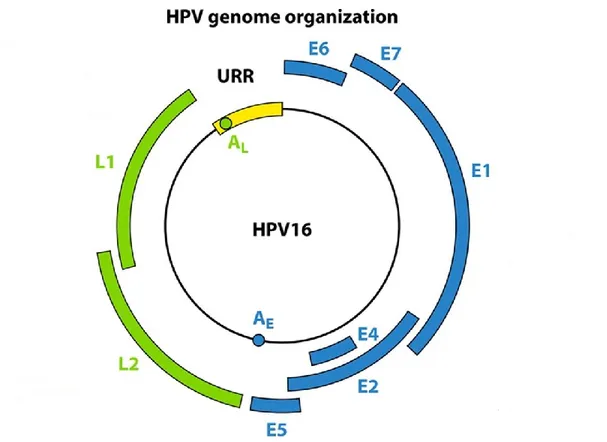
The genome is organized into the early, late, and long control regions (LCR) (Figure 1-10). The LCR has no protein coding function. The early region contains E1, E2, E4, E5, E6, E7 and E8 open reading frames (ORF). The late region encodes L1 and L2 capsid proteins [105-107]. The L1 ORF has the most conserved DNA sequence of the HPV genome, because of that it is widely used for viral typing. Differences of >10%, between 2% and 10%, and <2% constitutes new papillomaviruses isolates, subtypes, and variants respectively [101].
19
E6 and E7 oncogenes encode for the oncoproteins with the same name, E6 and E7 [108-110]. Together, the E6 and E7 expression are necessary and sufficient to induce cellular transformation and immortalization [111, 112]. Importantly, the oncoprotein E6 can bind p53 resulting in the p53 ubiquitin-mediated degradation, and can also induce BAK (Bcl-2-homologous antagonist/killer) degradation and telomerase activation. The oncoprotein E7 binds and inactivates retinoblastoma tumor suppressor (Rb) that leads to the release of the E2F transcriptional activator, which inhibits cyclin-dependent kinases (CDK) and indirectly induces p16INK4A.
During the progression of oncogenic HPV-infected lesion, the viral genome integrates into to the host genome [113]. The net effect is induction of genomic instability, cellular immortalization, and malignant transformation (Figure I-11) [109, 110, 114-117]. Abolishing E6 and E7 expression in cervical cancer cell lines leads to growth arrest, cellular senescence, and apoptosis [118-123].
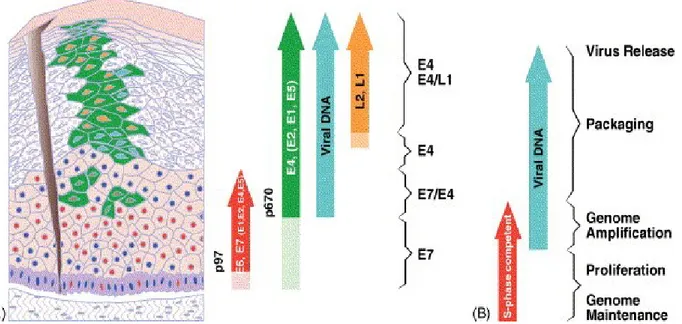
Figure I.9. HPV life cycle. HPV infection is confined to epithelial cells. Following access to
the basal cell layer, the viral promoter induces E6 and E7 expression to initiate S-phase entry, viral genome amplification, and protein expression during epithelial cell differentiation. Viral capsid proteins are formed at the uppermost layer leading to viral particle assembly and release. The viral genome is maintained at low copy number at the basal layers by the E1, E2, E6 and E7 proteins. E4 and E5 are necessary to aid E6 and E7 expression. Reprinted from reference [124]. © 2005, with permission from Elsevier.
20
Figure I.10. The HPV genome and ORF function. E1 and E2: viral DNA replication. E4: viral
release and packaging. E5: immune evasion, proliferation, and enhances E6 and E7. E6 and E7: oncoproteins. L1: major capsid protein. L2: minor capsid protein. The Upstream Regulatory Region (URR) that harbors the viral promoter and enhancer. Reprinted from Reference [125]. © 2012, with permission from the American society for Microbiology.
21
Figure I.11. E6 and E7 molecular mechanisms of inducing malignant transformation. E6
forms a complex with E6AP that functions as p53-specifc ubiquitin-protein ligase, leading to its degradation and the subsequent inhibition of the CDK inhibitor p21. The sequestration and/or degradation of p53 leads to cell cycle deregulation, DNA damage repair, and cellular senescence. The E6/E6AP complex additionally degrades NFX1, a transcriptional repressor of hTERT, resulting in cellular immortalization. E7 induces Rb degradation leading to liberation of the E2F-1 transcriptional factor. Furthermore, the p16 CDK inhibitor, which inhibits Rb phosphorylation, is indirectly induced through activation of E2F-1. E7 rescues the functional activity of E6 by inhibiting p21 and p27 CDK inhibitors, leading to activation of cyclin A and E. The net effect is induction of genomic instability, cellular immortalization, and proliferation. Reprinted from reference [126]. © 2009, with permission from AACR.
22
1.5 Uterine cervical Cancer
Uterine cervical cancer (UCC) is the fourth most common cancer affecting women worldwide, and the fourth leading cause cancer related deaths in women. There were 528,000 estimated new cases of UCC in 2012, with 85% occurring in developing countries [127].
HPV is an etiological risk factor for the development of cervical cancer and HPV DNA is detected in 99.7% of cervical carcinomas [128]. HPV is the most common sexually transmitted disease with a 79% estimated lifetime risk of cervical infection [129, 130]. Two high-risk HPV types, HPV16 and 18, account for 73% of cervical cancer cases; whereas HPV31, 33, 35, 39, 45, 51, 52, 56, 58, and 59 account for the remaining cases [131].
The International Federation of Gynecology and Obstetrics staging system (FIGO 2009) used to stage cervical cancer relies on clinical and basic radiological assessment [132, 133]. In developed countries, surgical staging and advanced radiological techniques are used to guide treatment [134-136]. The treatment of early stage cancer usually consists of surgery or primary radiotherapy with comparable outcomes [137]. Despite primary surgical treatment, approximately 50% of patients require adjuvant radiotherapy following the identification of further risk factors at final surgicopathological examination. This combined treatment is associated with increased morbidity [137]. In addition, risk factors that are detrimental for prognosis include pelvic lymph node metastasis, parametrial involvement, and positive resected margins [138, 139].
Pelvic lymph node metastasis is an independent prognostic factor associated with a decrease in disease-free and overall survival. Although the risk of nodal metastasis is about 21% in early stages [140], radiological assessment lacks the sensitivity to detect lymph node metastases [141]. The sensitivity of PET/CT scan, MRI, and CT to detect lymph node metastases is 75%, 56%, and 58%, respectively. Additionally, metastatic size <5 mm are below the detection limit of these technologies [142]. Approximately 15% of stage IB patients relapse, despite the absence of lymph node metastasis by routine histopathological examination and clear surgical margins [138]. Horn et al. retrospectively re-examined surgically resected pelvic lymph nodes and detected micrometastasis in 22.2% of patients and found a range between 3.8-23.9% in previously published literature [143]. In breast cancer, the reexamination of lymph nodes previously reported as negative with current methods of serial sectioning and
23
immunohistochemistry (IHC) detected occult metastasis in 20% of patients compared to 7% by haematoxylin and eosin (H&E), which correlated with poor prognosis [144].
Micrometastases are defined as tumor cell clusters more than 0.2 mm to and including 2 mm in size, whereas isolated tumor cells (ITC) are 0.2 mm or less. Using IHC and serial cuts, they are found in 10-90% of lymph nodes determined to be negative by routine histological examination [145, 146]. In cervical carcinoma, micrometastasis is an independent risk factor associated with reduced overall survival [147, 148]. Ultrastaging has improved the detection rate of lymph node metastasis [149, 150]; however, the technique is cumbersome and requires the examination of several histological slides.
Sentinel lymph node (SLN) mapping has emerged to improve detection rates and reduce the complications associated with complete pelvic lymphadenectomy [150-152]. The SLN is the first lymph node in the lymphatic pathway draining from a tumor and, if that lymph node is negative, then all others are also assumed to be negative. However, the performance of SLN depends on multiple factors including the technique used to detect the SLN [147, 153], surgical experience [154], tumor volume [155, 156], and pathological examination [147, 157]. In a large multicenter retrospective study, SLN and ultra-staging was able to identify micrometastases at a sensitivity of 91% with a false negative rate of 2.8% [158].
1.6 CTCs in UCC
Studies addressing CTC in UCC are scarce. Pao et al. used a Ficoll-Paque density gradient medium to enrich CTCs, which were then subjected to qRT-PCR analysis to detect HPV16 E6 expression. Notably, the E6 transcript was detected in 92% of stage IV-B UCC [159]. In follow-up publication by the same grofollow-up, HPV16 and/or 18 E6 oncogenes expression was detected in 51.4% of locally advanced UCC cases, and positivity was associated with higher recurrence risk, the presence of distant metastasis, and lower overall survival [160]. In addition, Weismann et al. was able to detect ≥25 spiked cells in 7.5 mL of blood after enrichment using Ficoll-Paque followed by a secondary positive enrichment with αEpCAM antibody; however, the average recovery was 50% and CTCs were undetectable if present at <25 cells/mL of blood. Nevertheless, the technique could detect CTCs in 23% of patients with early-state UCC [161].
24
Digital-Direct-RT-PCR of HPV16/18 E6 expression demonstrated a sensitivity of 1 CTC for every 500,000 normal cells, and a sensitivity of 5 CTCs/mL of blood, which was inversely related to the background number of PBMCs [162].
In contrast, nested RT-PCR for the cytokeratin-19 (CK19) transcript was sufficient to detect CTCs in 21.4% of stage IB-IIB patients; although, its expression did not correlate with any clinicopathological parameters [163].
Finally, Mitsuhashi et al. comparatively assessed the use of EGFR and CK19 qRT-PCR for the detection of CTCs. Notably, EGFR was expressed in 98% of primary tumors and was detected in the blood of 26.7% cancer patients, with no detectable levels in normal controls; whereas, CK19 was detected in 77.8% and 65% of patients and normal controls, respectively [164].
1.7 Hypothesis and Objective
Tumor markers expressed by cancer cells that can be used to detect them and to monitor their progression [165]. These markers can be organ-specific, tumor-specific, or tumor non-specific. The ideal marker should be exclusively expressed in tumor cells and be organ-specific. For instance, prostate cancer expresses prostate-specific antigen (organ-specific). Alfa-fetoprotein is expressed by hepatocellular carcinoma and yolk sac tumor (tumor-specific). Cytokeratin are variably expressed in epithelial cells and the most prevalent in tumor cells of epithelial origin (tissue-specific and tumor non-specific). CA-125 a common tumor marker that is expressed by epithelial ovarian cancer is also expressed by other tumors such as the breast, lung and gastrointestinal (organ non-specific and tumor non-specific) [166]. However, tumor markers are not entirely specific as they can be expressed in many benign conditions and by multiple tumors [165].
The current method used to detect RNA expression in tumor cells and has a wide range of clinical applications is the qRT-PCR, which indirectly assess genes expression [167, 168]. The qRT-PCR sensitivity is one target cell per 10 million, corresponding to approximately to one cell per 0.1-1 mL of blood [26]. Multiple studies have reported on the detection of CTCs using cytokeratin, prostate-specific antigen, and other tumor-specific markers using qRT-PCR [169-172].
25
Cytokeratin are a family of intermediate filament proteins that participate in the formation of the cellular cytoskeleton. The two types of CK proteins, acidic type I and neutral/basic type II, both of which are variably expressed in epithelial cells and are usually maintained during malignant transformation [173]. CK8, CK18, and CK19 are the most prevalent in tumor cells of epithelial origin [174]. A previous study assessing the use of CK19 qRT-PCR analysis for the detection of lymph node micrometastasis in cervical cancer found CK19 expression in ~50% of lymph nodes. Moreover, 44% of lymph nodes deemed negative by histological analysis were found positive for CK19 expression, a result that correlated with clinicopathological features [175]. In breast carcinomas, a one-step nucleic acid amplification assay (OSNA) for CK19 used for the rapid intraoperative detection of lymph node metastasis has a sensitivity of 93.3% [176]. In comparison, frozen section has 58% sensitivity for detecting nodal micrometastasis [177]. Similar findings have been reported for the analysis of frozen sections in cervical cancer with a sensitivity range of 20.7-56.2% [178-180]. This suggests that CK19 OSNAs may be of potential value in the management of UCC to avoid further unnecessary surgical procedures and quickly identify the proper standard of care.
HPV DNA can be detected in 99.7% of UCCs [128]. The E6 and E7 oncoproteins encoded by HPV are constitutively expressed and facilitate the development and maintenance of a malignant phenotype. Thus, they are ideal molecular markers to detect CTCs in UCC patients [118-123]. Notably, a previous study identified CTCs in 92% of stage IV-B UCC patients by analyzing HPV16 E6 oncogene expression [159]. In follow up study, the HPV16 and/or 18 E6 oncogenes expression were detected in 51.4% of locally advanced UCC cases, which was associated with a higher risk of recurrence, distant metastasis, and lower overall survival [160].
The cyclin dependent kinase (CDK) inhibitor p16INK4A functions as tumor suppressor
and regulates the G1/S cell cycle transition by binding CDKs to inhibit the phosphorylation of Rb. This prevents the release of E2F transcription factors and aberrant transition into S-phase [181, 182]. p16INK4A is indirectly overexpressed in cervical cancer as result of the functional
inactivation of Rb by E7 and can be used as biomarker for diagnosis [183].
Despite the numerous studies addressing CTCs in many other cancers, only a limited amount of information is available for the use of CTCs in UCC diagnostics. Due to their known roles in UCC etiology and lack of expression in normal cells, we hypothesize that HPV
26
oncogene expression will allow for the detection of CTCs and lymph node metastases with high sensitivity. These findings have the potential to improve current CTC detection methods for UCC and to determine the potential clinical impact of these cells in UCC management. Thus, we propose to use these markers to detect CTCs.
Objective #1:
Optimize, establish protocols and validate for the use of E6/E7, CK19 and p16INK4A
genes expression to detect CTCs and lymph node metastases in UCC.
Objective #2:
Develop a tumor bank consisting of tumor tissue biopsies, plasma, and PBMCs accompanied with HPV DNA genotyping and clinical data for UCC patients treated at the Centre Hospitalier de l'Université de Montréal (CHUM).
Objective #3:
Determine the capacity of CK19, p16INK4A, E6, and E7 expression analysis by qRT-PCR
27
CHAPTER II : MATERIALS AND METHODS
2.1 Cell Culture
The HeLa, HCA2-hTERT, U2OS, and AT3-OVA cell lines were cultured in Dulbecco's Modified Eagle Medium (DMEM). The CaSki cell line was cultured in RPMI media. TOV-1946, TOV-112D, and TOV-21G were cultured in OSE medium (Table II-I). All culture media were supplemented with 8% Fetal Bovine Serum (FBS), 100 IU/mL penicillin, and 100 g/mL streptomycin, and grown at 37°C in a humidified atmosphere of 5% CO2. Cells were passaged every two to three days prior to confluency with 0.05% trypsin supplemented with 0.53 mM EDTA.
Table II-I. Cell line
Cell Line Origin
HeLa Uterine cervical adenocarcinoma (HPV18 DNA-positive, about 10-50 copies per cell). Obtained from the American Type Culture Collection (Manassas, VA).
HCA2-hTERT Immortalized human fibroblast [184].
U2OS Human osteosarcoma [185].
AT3-OVA Mice breast carcinoma [186].
CaSki Uterine cervical squamous cell carcinoma (HPV16/18 DNA positive, about 60-600 copies per cell). However, HPV16 RNA is solely expressed [187]. Obtained from the American Type Culture Collection (Manassas, VA).
TOV-1946 High grade ovarian serous carcinoma [188]. TOV-112D High grade endometroid ovarian carcinoma [189]. TOV-21G Clear cell ovarian carcinoma [189].
2.2 Ficoll-Paque Density gradient enrichment
2.2.1 Validation
A solution containing 15 mL of each FBS and PBS was prepared and spiked with a pre-determined number of cells. It was then layered over 15 mL Ficoll-Paque in a 50 mL conical
28
tube. After centrifugation at 400g at 20°C for 30 minutes without breaking, the cell layer above the Ficoll-Paque was collected and transferred to a separate tube. In addition, the cell-free phases above the cell layer and below the Ficoll-Paque were collected and transferred into new tubes. Cells were washed twice with PBS and counted with a hemocytometer and TC20™ automated cell counter.
2.2.2 Enrichment of spiked cancer cells
Blood from healthy volunteers were collected in EDTA tubes. HPV16-positive CaSki-GFP cells were serially diluted and spiked into blood. The spiked blood was further diluted 2-4-fold with cold PBS containing 2 mM EDTA. After centrifugation at 400g at 20°C for 30 minutes without breaking, the following layer phases were formed from the bottom to the top: erythrocyte, granulocytes, Ficoll-Paque, PBMC, and plasma. The PBMC layer was collected and transferred to a separate tube and washed twice with cold PBS, and equally divided for RNA extraction and formalin fixation for flow cytometry.
2.3 Enrichment by RBC lysis
CaSki-GFP cells was serially diluted and spiked into blood collected from healthy donors. CTCs were then enriched by adding 10 mL of ACK RBC lysis buffer per mL of blood and incubating for 5 minutes at room temperature kept in gentle agitation. Incubations were extended for an additional 5 minutes if the RBC lysis was not complete [113]. Cells then were collected by centrifugation at 400g at 4°C for 5 minutes, washed once with cold PBS, and then split equally for RNA extraction and formalin fixation for flow cytometry.
2.4 Flow cytometry strategy for sorting and counting CTCs
GFP-tagged CaSki cells were used to differentiate target cells from normal PBMCs. Following enrichment, cells were fixed with 1% cold formalin for 10 minutes at 4°C and washed once with cold PBS. Fixed cells were preserved in 75% ethanol at −20°C. CountBright™ Absolute Counting Beads were used to determine the absolute number of recovered cells. Briefly, previously enriched fixed cells were washed once with PBS, resuspended in 1000 µL PBS, and 50 µL bead slurry (50,000 Beads in 50 µL) was then added to each suspension. The following formula was used to calculate cell concentration:
(Numberof cell events/Number of bead events) × (Assigned bead count /Volume of sample) = Cells/µL
29
Where the number of cell and bead events represent cells and beads detected following excitation.
Flow cytometry data was collected on a BD LSRFortessa™ cell analyzer and analyzed with FlowJo software (Figure II-1). Enriched cells were not stained with DAPI whereas the beads are positive when exited with the DAPI channel.
30
Figure II.1. Flow cytometry gating strategy to isolate GFP-positive spiked cancer cells. (A-C)
Fluorescence intensity histogram with indicated gate setting. GFP intensity and counts are plotted on the x- and y-axes, respectively. (A) CaSki (red) vs CaSki-GFP (green) vs CaSki cells based on GFP fluorescence. (B) PBMC (red), CaSki-GFP (green), and counting beads (blue) based on GFP fluorescence. (C) PBMC (red), CaSki-GFP (green), and counting beads (blue) based on DAPI fluorescence. (D) Forward scatter versus side scatter plot (FSC vs. SSC) on total, ungated events demonstrating the three populations as indicated. (E) Total events on GFP
CaSki CaSki-GFP
A
CaSki-GFP PBMC Beads GFP-Positive GFP-NegativeB
PBMC CaSki-GFP Beads DAPI-Positive DAPI-NegativeC
D
E
F
G
H
I
J
31
intensity histogram. (F) FSC vs. SSC on negative PBMCs (G) FSC vs. SSC on GFP-positive gating for CaSki-GFP cells and counting beads. (H) GFP-GFP-positive gating based on DAPI intensity. (I) FSC vs. SSC on GFP-positive/DAPI-negative CaSki-GFP cells. (J) FSC vs. SSC plot on GFP-positive/DAPI-positive counting beads. Note: enriched cells were not stained with DAPI whereas the beads are positive when exited with the DAPI channel.
32
2.5 Real-time quantitative reverse-transcription polymerase chain reaction
(qRT-PCR)
2.5.1 Reverse transcription
RNA was isolated by Trizol® extraction from the enriched cell pellet per the manufacturer’s
instructions. The RNA concentration and purity was determined spectrophotometrically based on absorbance at 260 nm and 280 nm. Equivalent amounts of RNA (≤1 μg) was reverse-transcribed into cDNA with Superscript® III First-Strand Synthesis SuperMix in a 20 µL
reaction volume. The reaction mix composed of 10 µL of 2xRT reaction mix, two µL of reverse transcriptase enzyme, RNA (maximum 8 µL) and water free RNase to complete the volume to 20 µL. The mixture was then subjected to the following thermocyling protocol: 10 minutes at room temperature, 50°C for 30 minutes, and 85°C for 5 minutes, followed by chilling on ice. Hereafter 1 µL RNase H was added to the reaction mix and incubated at 37°C for 20 minutes. The cDNA was stored at -20°C until further analysis.
2.5.2 Multiplex real-time PCR reactions
Multiplex real-time PCR reactions for HPV16 E6 and E7, CK19, and p16INK4A were performed
to detect CTCs. TaqMan® assays were used to assess E6, E7, CK19, and p16INK4A gene
expression. 18S ribosomal RNA and/or TATA-box binding protein (TBP) were used as internal references. The Oligo Analyzer 3.1 and BLAST software (Basic Local Alignment Search Tool) were used to verify the specificity of primers and probes sequences listed in Table II-II. Primers and probes were purchased from Integrated DNA Technologies. Real time quantitative PCR reactions were performed using Platinum® Quantitative PCR SuperMix-UGD in a 15-µL
reaction volume. Maximum 50 ng/µL of cDNA was used per reaction. The reaction mix composed of 3 µL of cDNA, 7.5 µL of master mix, 0.6 µL of MgCl2; to a final concentration of
4.0 mM, 0.3 µL of probe; to a final concentration of 0.2 µM and 0.3 µL of each primer; to a final concentration of 0.2 µM. RNase free water was used to complete the volume to 15 µL. PCR reactions were run on a StepOnePlus™ Real time PCR instrument with initial incubations
at 50°C for 2 minutes and 95°C for 10 minutes, followed by 40 cycles of 95°C for 15 seconds and 60°C for one minute. Reactions were performed in triplicates with positive, negative, and no template controls (NTC). Data was analyzed with StepOne™ Software by the comparative Ct