HAL Id: hal-03100259
https://hal.archives-ouvertes.fr/hal-03100259
Submitted on 6 Jan 2021
HAL is a multi-disciplinary open access
archive for the deposit and dissemination of
sci-entific research documents, whether they are
pub-lished or not. The documents may come from
teaching and research institutions in France or
abroad, or from public or private research centers.
L’archive ouverte pluridisciplinaire HAL, est
destinée au dépôt et à la diffusion de documents
scientifiques de niveau recherche, publiés ou non,
émanant des établissements d’enseignement et de
recherche français ou étrangers, des laboratoires
publics ou privés.
15 000 yr BP
Pedro Tarroso, José Carrión, Miriam Dorado-Valiño, Paula Queiroz, Luisa
Santos, Ana Valdeolmillos-Rodríguez, Paulo Célio Alves, José Carlos Brito,
Rachid Cheddadi
To cite this version:
Pedro Tarroso, José Carrión, Miriam Dorado-Valiño, Paula Queiroz, Luisa Santos, et al.. Spatial
cli-mate dynamics in the Iberian Peninsula since 15 000 yr BP. Clicli-mate of the Past, European Geosciences
Union (EGU), 2016, 12 (5), pp.1137-1149. �10.5194/cp-12-1137-2016�. �hal-03100259�
www.clim-past.net/12/1137/2016/ doi:10.5194/cp-12-1137-2016
© Author(s) 2016. CC Attribution 3.0 License.
Spatial climate dynamics in the Iberian Peninsula
since 15 000 yr BP
Pedro Tarroso1,2,3, José Carrión4, Miriam Dorado-Valiño5, Paula Queiroz6, Luisa Santos7, Ana Valdeolmillos-Rodríguez8, Paulo Célio Alves1,2, José Carlos Brito1, and Rachid Cheddadi3
1InBio/CIBIO, Centro de Investigação em Biodiversidade e Recursos Genéticos da Universidade do Porto,
Campus Agrário de Vairão, Vairão 4485-661, Portugal
2Departamento de Biologia da Faculdade de Ciências, Universidade do Porto, 4099-002 Porto, Portugal
3Institut des Sciences de l’Evolution, UMR CNRS5554, 34090 Montpellier, France
4Department of Plant Biology, University of Murcia, Campus de Espinardo, 30100 Murcia, Spain
5Research Group of Archaeobiology, History Institute, CCHS, CSIC, Albasanz 26-28, 28037 Madrid, Spain
6Terra Scenica, Centro para a criatividade partilhada das Ciências, Artes e Tecnologias, Lisbon, Portugal
7Facultad de Ciencias, Universidade da Coruña, Campus A Zapateira, 15071 A Coruña, Spain
8C/Teniente Ruiz 5, 2B, 28805 Alcalá de Henares, Madrid, Spain
Correspondence to: Pedro Tarroso ([email protected])
Received: 26 August 2014 – Published in Clim. Past Discuss.: 26 September 2014 Revised: 31 January 2016 – Accepted: 16 April 2016 – Published: 11 May 2016
Abstract. Climate changes in the Iberian Peninsula since the Last Glacial Maximum are associated with distribu-tional shifts of major Mediterranean and European temper-ate species. The dynamic relationship between climtemper-ate and species in the past may be retrieved from the fossil records available in the Iberian Peninsula. We have used an exten-sive set of pollen records to reconstruct spatial layers (1 kyr interval) of January minimum temperature, July maximum temperature, and annual precipitation over the time period between 15 and 3 ka. A functional principal component anal-ysis was used to summarise the spatial evolution of climate in areas that share similar climate trends. When compared be-tween them, the identified four areas show different climate trends over the studied period and are coherent with the exis-tence of multiple refugial areas within the Iberian Peninsula.
1 Introduction
The distribution pattern of biodiversity today is the result of a dynamic process driven by geological events and cli-matic oscillations at a broad temporal scale (Hewitt, 2000). The climate change since the last glacial period was tracked by species through major range shifts, migrations, and/or
ex-tinctions which may be analysed at the genetic level or from the fossil record (Hewitt, 2000; Taberlet and Cheddadi, 2002; Cheddadi et al., 2014). The relationship between climate and biodiversity will be maintained in the future with major con-sequences due to the current trend of climate warming related to anthropogenic activities, including range shifts (Parme-san and Yohe, 2003; Rebelo et al., 2010), diversity deple-tion (Araújo et al., 2006; Sinervo et al., 2010), and, more dramatically, species extinction (Thomas et al., 2004). The biodiversity hotspots retain high levels of endemism and are considered as the best candidates for preserving species di-versity for the future (Myers et al., 2000). The Mediterranean Basin hotspot, in particular, played the role of refugium to diverse ecosystems over several hundreds of millennia (Wi-jmstra, 1969; Wijmstra and Smith, 1976; Van der Wiel and Wijmstra, 1987a, b; Tzedakis et al., 2002). Often, those ar-eas where species have persisted during glacial times are re-ferred to as glacial refugia (Bennett and Provan, 2008; Car-rión et al., 2010b; Hewitt, 2000; Hu et al., 2009; MacDonald et al., 2008; Willis et al., 2010), and the predicted high levels of diversity found at species level in these areas are corrob-orated at molecular level (Hewitt, 2000; Petit et al., 2003). Understanding how the past processes impacted biodiversity patterns offers invaluable knowledge for the current species
conservation effort dealing with the ongoing global climate change (Anderson et al., 2006; Willis et al., 2010).
Species’ glacial refugia have been generally defined based on species survival with a strong relationship with climate (Hewitt, 2000; Bennett and Provan, 2008; Cheddadi and Bar-Hen, 2009; Médail and Diadema, 2009). Nevertheless, the term has been used recently with multiple definitions (Ben-nett and Provan, 2008; Ashcroft, 2010). The classic definition of refugia is related to the physiological limits of species that under an increasingly stressing environment experience dis-tributional shifts to near suitable areas (Bennett and Provan, 2008). Palaeoenvironmental and molecular data have proven useful to locate species diversity and migration routes (Petit et al., 2003; Cheddadi et al., 2006, 2014). However, the loca-tions and extension range of putative refugia still lack spatial consensus and quantification of the refugia’s dynamic nature. Reconstructing past environments from proxy data will help understand climate dynamics and how it may have affected biodiversity patterns. The past climate changes, species dis-tributions, and the interplay between them may be recon-structed from the fossil record. Fossil pollen records have proven to be an appropriate proxy for quantifying past cli-mate variables (Webb et al., 1993; Cheddadi et al., 1997; Guiot, 1997; Davis et al., 2003; Bartlein et al., 2010). Us-ing proxy data to derive a definition of refugia in terms of suitable climate in a spatial context may provide further in-sights into not only the persistence of species in the past but also the location of potential areas that may serve as future refugia for the species persistence.
Climate oscillations in Europe during the last 15 000 years exhibited latitudinal and longitudinal variations (Cheddadi et al., 1997; Davis et al., 2003; Roucoux et al., 2005; Ched-dadi and Bar-Hen, 2009; Carrión et al., 2010b). During the Last Glacial Maximum (LGM), several species persisted in refugia located in the southern peninsulas (Hewitt, 2000; Tzedakis et al., 2002; Petit et al., 2003; Weiss and Ferrand, 2007; Bennett and Provan, 2008; Hu et al., 2009; Médail and Diadema, 2009; Ohlemüller et al., 2012). The Iberian Penin-sula, with a milder climate than northern European latitudes (Renssen and Isarin, 2001; Carrión et al., 2010b; Perez-Obiol et al., 2011), served as a general refugium to several species that persisted in this area during the LGM. The current pat-terns of high biological diversity in the Iberian Peninsula derive partially from this favourable climate during harsh glacial conditions and highlight the importance of this area in the broader Mediterranean hotspot (Médail and Quézel, 1999; Cox et al., 2006). However, the Iberian Peninsula is not a geographically homogenous area. Currently Iberian Penin-sula is divided into two main climate zones: the temperate at the northern portion of the peninsula and the mediter-ranean, occupying most of the central and southern part (Ol-son et al., 2001). This pronounced difference in climate pat-terns in the Iberian Peninsula also promotes differentiation of the biodiversity patterns (Sillero et al., 2009). Additionally, the past vegetation and climate dynamics reveal a quite
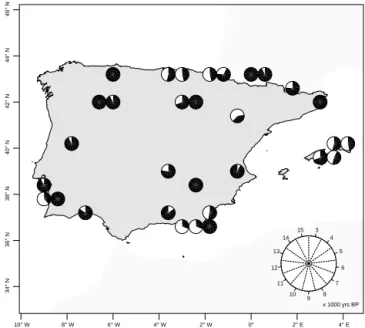
com-3 4 5 6 7 8 9 10 11 12 13 14 15 x 1000 yrs BP 10° W 8° W 6° W 4° W 2° W 0° 2° E 4° E 34° N 36° N 38° N 40° N 42° N 44° N 46° N
Figure 1.Study area with sample points. The black area inside each circle represents the ages available in each pollen sequence.
plex picture (Roucoux et al., 2005; Naughton et al., 2007; Perez-Obiol et al., 2011). Thus, multiple areas were identi-fied as small refugia which lead to the refugia-within-refugia “concept” (Weiss and Ferrand, 2007). Altogether it renders the Iberian Peninsula as a unique area for studying the late-Quaternary climate processes with a highly dynamic vegeta-tion response (Carrión et al., 2010b) which is of a high im-portance for biodiversity conservation.
Our main objective in this study is to define areas within the Iberian Peninsula (Balearic Islands included) that share similar climate trends and which may have served as a po-tential refugium. We reconstructed three climate variables and quantified their changes over the past 15 000 years. We also summarised the geographical areas that have undergone similar climate changes and analysed their spatial dynamics between 15 000 and 3000 years.
2 Methods
The study area extends throughout the Iberian Peninsula and the Balearic Islands (Fig. 1). The method used to re-construct past climate variables is based on the probabil-ity densprobabil-ity functions (PDFs) of plant taxa identified in fos-sil pollen records, and it requires a georeferenced distribu-tion of modern plant taxa and a database of modern cli-mate variables. PDFs for each taxon were built relating the modern distributions in the climate space geographically. The raw fossil pollen data were gathered from author’s con-tributions and from the European Pollen Database (www. europeanpollendatabase.net). Each selected site fits quality criteria regarding the number of radiometric dates (> 3 in each site) and a sampling resolution of at least 200 years.
Table 1.Origin and description of the data sources of fossil pollen used to reconstruct the climate in the Iberian Peninsula. Source is either the European Pollen Database (EPD) or author contribution. Longitude and latitudes correspond to the centroid of the nearest cell to the
site and altitude as extracted from WorldClim data set, all at 50spatial resolution. Each site has information about the number of14C dates
available, the temporal range covered (see also Fig. 1 for the spatial distribution) and the respective biome following the classification of Olson et al. (2001).
Name Source Longitude Latitude Altitude 14C Range Biome
Albufera Alcudia EPD; Burjachs et al. (1994) 3.125 39.792 11 4 3000–11 000 Mediterranean
Algendar EPD; Yll et al. (1997) 3.958 39.958 80 4 3000–9000 Mediterranean
Antas EPD; Pantaleón-Cano (1997) −1.792 37.208 14 6 3000–9000 Mediterranean
Barbaroxa Queiroz (1999) −8.792 38.042 38 4 3000–7000 Mediterranean
Cala Galdana EPD; Yll et al. (1995) 3.958 39.958 80 5 3000–8000 Mediterranean
Cala’n Porter EPD; Yll et al. (1997) 4.125 39.875 81 4 4000–9000 Mediterranean
CC-17 Dorado Valiño et al. (2002) −3.875 39.042 617 3 3000–12 000 Mediterranean
Charco da Candieira EPD; Van der Knaap and Van Leeuwen (1994) −7.542 40.375 1221 30 3000–14 000 Mediterranean
Gádor Carrión et al. (2003) −2.958 36.875 1413 6 3000–6000 Mediterranean
Golfo Queiroz (1999) −9.125 38.542 53 5 3000–14 000 Mediterranean
Guadiana Fletcher et al. (2007) −7.458 37.292 52 8 3000–13 000 Mediterranean
Hoya del Castilho EPD; Davis and Stevenson (2007) −0.542 41.292 271 3 6000–10 000 Mediterranean
Lago de Ajo EPD; McKeever (1984) −6.125 43.042 1744 6 3000–15 000 Temperate
Laguna de la Roya EPD; Allen et al. (1996) −6.792 42.208 1780 6 3000–15 000 Mediterranean
Lake Racou EPD; Guiter et al. (2005) 2.042 42.542 1906 8 3000–12 000 Mediterranean
Las Pardillas Lake Sánchez-Goñi and Hannon (1999) −3.042 42.042 23 5 3000–11 000 Mediterranean
Navarres 1 EPD; Carrión and Dupré (1996) −0.708 39.125 278 5 4000–15 000 Mediterranean
Puerto de Belate EPD; Peñalba Garmendia (1989) −2.042 43.042 622 3 3000–8000 Temperate Puerto de Los Tornos EPD; Peñalba Garmendia (1989) −3.458 43.125 893 4 3000–9000 Temperate Quintanar de la Sierra EPD; Peñalba Garmendia (1989) −3.042 42.042 1546 20 3000–15 000 Mediterranean
Roquetas de Mar EPD; Pantaleón-Cano (1997) −2.625 36.792 94 3 3000–6000 Mediterranean
Saldropo EPD; Peñalba Garmendia (1989) −2.708 43.042 645 3 3000–8000 Temperate
Sanabria Marsh EPD; Allen et al. (1996) −6.708 42.125 1220 8 3000–14 000 Mediterranean
San Rafael EPD; Pantaleón-Cano (1997) −2.625 36.792 94 6 3000–15 000 Mediterranean
Santo André Santos and Sánchez-Goñi (2003) −8.792 38.042 38 8 3000–15 000 Mediterranean
Siles Carrión (2002) −2.542 38.375 1246 12 3000–15 000 Mediterranean
Padul Pons and Reille (1988) −3.708 37.042 1236 17 5000–15 000 Mediterranean
Lourdes Reille and Andrieu (1995) −0.042 43.042 727 9 3000–15 000 Temperate
Monge Reille and Andrieu (1995) −0.042 43.042 727 15 3000–14 000 Temperate
Moura Reille (1993) −1.542 43.458 40 6 4000–12 000 Temperate
Banyoles EPD; Pèrez-Obiol and Julià (1994) 2.708 42.125 172 2 3000–15 000 Mediterranean
Using these criteria we selected a total of 31 records which cover different time spans between 15 000 and 3000 yr BP (Table 1; Fig. 1). Although having the LGM as a lower limit would have provided interesting data, the availability of sites for the spatial interpolation is very limited before the Holocene. Thus, we focused on the 15 000 years when there are still 10 sites available that are necessary for a reliable spa-tial data interpolation (Table 1; Fig. 1). For the climate recon-struction we assume that modern distributions are in equilib-rium with climate over the species range. This is a reasonable assumption when considering the spatial resolution of this study. Using georeferenced full plants distributions reduces the bias resulting from local or isolated presence of species. These biases are also balanced by the inclusion of multiple taxa identified in each core for the climate reconstruction.
2.1 Data sources
The current distribution data for 246 taxa were obtained by georeferencing the Atlas of Florae Europaeae (Jalas and
Suominen, 1972, 1973, 1976, 1979, 1980, 1983, 1986, 1989, 1991, 1994; Jalas et al., 1996, 1999; Laurent et al., 2004). We gathered additional occurrence data for the Mediterranean flora from the Global Biodiversity Information Facility data portal (http://www.gbif.org/). These data were checked and corrected by removing species’ presences from botanical and herbaria collections and/or observations with lower spatial
resolution than 300(∼ 55 km). The final taxa list and the
as-signment of pollen taxa to and modern taxa distributions is given in Table S1.
The georeferenced geographical distributions were
rescaled to the resolution of 300 (∼ 55 km). The global
observed climate data (1950–2000) for January minimum temperature (Tjan), July maximum temperature (Tjul) and
an-nual precipitation (Pann) data were obtained from WorldClim
database (Hijmans et al., 2005, www.worldclim.org) with
50 resolution (∼ 10 km). The climate data were downscaled
to the same spatial resolution of the plant distribution data
computing was performed using R (R Development Core Team, 2012) with the package rgdal (Keitt et al., 2012).
2.2 Reconstruction of past climate variables
The climate reconstruction method is based on the PDF of each taxon identified in a fossil dated pollen assemblage. Pollen taxa were assigned to georeferenced plant taxa (see Table S1). This approach was successfully used to recon-struct climate variables from fossil pollen data (Kühl et al., 2002; Cheddadi and Bar-Hen, 2009; Kühl and Gobet, 2010). Using the PDFs intersection of all taxa identified in a fos-sil sample we obtain the most likely climate value within which the fossil plant assemblage may occur (Kühl et al., 2002). It has been observed that normal and log-normal (right skewed) distributions fitted to temperature and precipitation, respectively, tend to better represent the data (Chevalier et al., 2014). To avoid sampling the climate spatial distribution in-stead of the species tolerance, we corrected for the potential bias by using binned climate within the species range as a weighting factor for each climate value (Kühl et al., 2002).
The chosen bin size is 2◦C for temperature variables and
20 mm for precipitation. This procedure decreases the weight of the most frequent climate values and increases those, in the distribution of the species, that occur less frequently in the study area (Kühl et al., 2002).
The reconstructed climate using the PDF method results from combining the individual PDFs of the species identi-fied in each pollen sample. The product of the PDFs provides the most likely climate value (Kühl et al., 2002; Chevalier et al., 2014). To identify a taxon as present in the sample, a threshold of three pollen grains was chosen. A minimum of five taxa present is required to reconstruct a climate value for each fossil sample.
Using presence data is seen as an advantage of the PDF method (Kühl et al., 2002) as well as a weakness due to the exclusion of the quantitative data resulting from the pollen abundances (Birks et al., 2010). Fluctuations in pollen abun-dances are related to multiple factors such as the species eco-physiology, differential pollen production, dispersal capacity, and other traits (Hicks, 2006). We have used the pollen pro-portions to weight the PDFs of the respective taxa. The min-imum positive pollen proportion corresponds to the presence of the taxon, while the maximum defines its highest abun-dance within the fossil record. Using pollen proportions of a taxon within a time series instead of within a sample avoids the bias of differential pollen production and thus allows es-timating the presence of a species relative to its maximum percentages in the whole record.
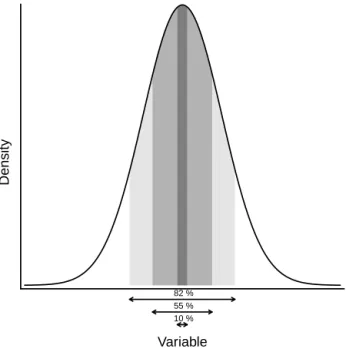
The pollen proportions were converted to alpha values, re-ducing the species climate tolerance towards the peak density values (Fig. 2). We assumed that the pollen proportion has an inverse relation to the proximity of near-optimal condi-tions. To avoid the selection of a unique climate value from the PDF when the maximum detection of a species occurs
Variable
Density
82 % 55 % 10 %
Figure 2.Example of the influence of pollen proportion (pp) on the calculation of the density of taxa presence intersection. The shades of grey indicate the effect of different pp when the pollen adjust-ment value (pa) is set to 0.9 and arrows indicate the assumed pres-ence range. The first case (dark grey) results from pp = 1.0, which represents the highest detectability and is assumed to be found near the core distribution area and, thus, near-optimum conditions. The presence is assumed in a narrow range around peak density with α =pp×pa2 (corresponding to 10 % of the area). When pp = 0.5 (medium grey) the corresponding area is 55 % and with pp = 0.2 (light grey) is used the widest presence range (82 % of the PDF area).
– i.e. when its pollen proportion is found to be 1, we use a pollen adjustment value set to 0.9. This means that, at the maximum taxon detection, the PDF will be reduced to the area of the density corresponding to 10 % of the probability (Fig. 2). The maximum detection of a taxon indicates a near-optimal climate niche and the adjustment value set to a value near but not equal to one allows some degree of uncertainty in the reconstruction. On the other hand, setting this value to zero will not allow any influence of the pollen proportion, resulting in a binary presence/absence reconstruction (Kühl et al., 2002). For each sample, the collection of the taxa tol-erance intervals built this way are added resulting in a taxon profile, showing where in the climate space the frequency of the taxon is higher, taking into account the proximity to optimal conditions. The final climate reconstruction value is the product of the climate PDF with the taxa profile. The reconstructed value and associated uncertainty are usually extracted from the PDF as the mean and standard deviation (Kühl et al., 2002; Kühl and Gobet, 2010). Assuming a nor-mal distribution, we extract the peak density value and the 95 % confidence interval from the density profile. The confi-dence interval range shows the uncertainty around the
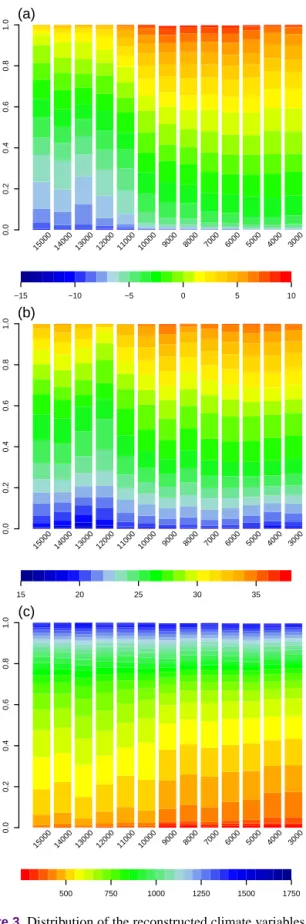
recon-0.0 0.2 0.4 0.6 0.8 1.0 15000 14000 13000 12000 11000 10000 9000 8000 7000 6000 5000 4000 3000 (a) −15 −10 −5 0 5 10 0.0 0.2 0.4 0.6 0.8 1.0 15000 14000 13000 12000 11000 10000 9000 8000 7000 6000 5000 4000 3000 (b) 15 20 25 30 35 0.0 0.2 0.4 0.6 0.8 1.0 15000 14000 13000 12000 11000 10000 9000 8000 7000 6000 5000 4000 3000 (c) 500 750 1000 1250 1500 1750
Figure 3.Distribution of the reconstructed climate variables in the Iberian Peninsula and Balearic Islands in the last 15 kyr. Colours show the proportion of area covered with each class of (a) min-imum temperature of January, (b) maxmin-imum temperature of July, and (c) annual precipitation.
structed value and is related to the standard deviation. The re-constructed values for each site were fitted with a smoothing spline to produce continuous time series, from which 1000-year time slices were extracted.
In order to evaluate the robustness of the reconstruction method, we have compared modern reconstructed and ob-served climate data (1950–2000) from WorldClim database. For reconstructing climate from pollen data, we have used all samples available within the last 500 years. Climate values were averaged for all sites with more than one sample. The correlation between the two data sets was tested using a Pear-son’s correlation score. To provide the significance of the cor-relation value, a set of 999 replicates were performed where the observed climate variable was shuffled without repeti-tion. Although this evaluation does not take into account nei-ther the climate oscillations during the last 500 years nor the human disturbances, it still provides a broad evaluation of the reconstruction method because (1) it depicts per site the relationship between observed climate data with recon-structed values and (2) the slope direction of the regression and the related correlation signal indicate that the reconstruc-tion is spatially coherent. A linear regression was used to es-timate a baseline for calculating the anomalies at each site using the observed climate. The pre-industrial period around AD 1850 is commonly used as reference climatology to com-pute anomalies. This period is also often used as a baseline in climate models, facilitating data–model comparisons, and it is less biased with recent climate warming allowing past warming to be better depicted (Davis et al., 2003; Mauri et al., 2015). Although a specific year is selected, the time frame often includes ±500 years (Mauri et al., 2015), which is equivalent to the period we have used in our study. The regression allows a climate baseline to be built without artifi-cially adding samples to compensate for differential number of samples available for recent periods in a 4-D (spatial plus time) interpolation (Mauri et al., 2015) and the linear equa-tions provide all the information to generate the baseline with the observed climate data.
2.3 Spatial analysis of past climate
Thirteen climate grids, ranging from 15 000 to 3 000 calendar years BP (hereafter, “ka”) with a 1000-year interval, were ob-tained for each reconstructed variable by spatial interpolation of the climate anomalies at each available site. The anoma-lies were computed for each site between the reconstructed climate and the modern reference climate. Anomalies were
projected onto a 300(∼ 55 km) resolution grid and
interpo-lated onto a 50(∼ 10 km) resolution grid using 3-D thin-plate
smoothing splines with two spatial dimensions including al-titude. This interpolation method generates accurate climate predictions (Jarvis and Stuart, 2001) and it was used for the WorldClim variables (Hijmans et al., 2005).
To further summarise the spatial and temporal variability of the data we applied a functional principal component
ysis (fPCA). The fPCA extends the exploratory data anal-ysis of the principal component analanal-ysis to functional data (Bickel et al., 2005), depicting both spatial and time patterns that are then summarised in a few components. Cheddadi and Bar-Hen (2009) applied a fPCA to nearly the same timescale as the present study to depict January temperature patterns from European pollen data. Here we have broadened the ap-proach to each climate time series available in each grid cell to produce gridded spatial components. The functional data were built by combining B-spline basis functions to fit the time series. We have retained the components that explain more than 90 % of the variance and rescaled the range from
−1 to 1. We used hierarchical cluster analysis over the
pro-duced first components grids of each variable to identify ar-eas in the Iberian Peninsula that share similar climate trends over the past 15 ka. Climate stability was computed for each variable as the mean absolute deviance from the current cli-mate as available in WorldClim data set.
All analysis were performed using the R Project for Sta-tistical Computing (R Development Core Team, 2012) with packages fields (Furrer et al., 2012), rgdal (Keitt et al., 2012), gstat (Pebesma, 2004), and fda (Ramsay et al., 2012). The climate reconstructions were performed with R scripts de-veloped by the authors and available at request.
3 Results
The modern climate reconstructions (500 years) show a high degree of agreement with the observed climate data
(RMSETjan=5.01; RMSETjul=3.85; RMSEPann=399.85;
Fig. S1). These data sets show a positive linear trend and a significant positive correlation (p ≤ 0.006 for all variables), revealing that the reconstruction method predicts well the spatial distribution of climate. The standard error associated with the climate reconstruction is on average low but in-creases with age (Fig. S2).
The reconstructed three climate variables exhibit high spa-tial variability between 15 and 3 ka (Fig. 3, Fig. S3). The uncertainty associated with the spatial interpolations is usu-ally low, suggesting a good sampling coverage, except in the northwestern area (Fig. S4). The Iberian Peninsula had
exten-sive areas with extremely low Tjanthat gradually increased
markedly after 10 ka. The pattern of Tjulover the same time
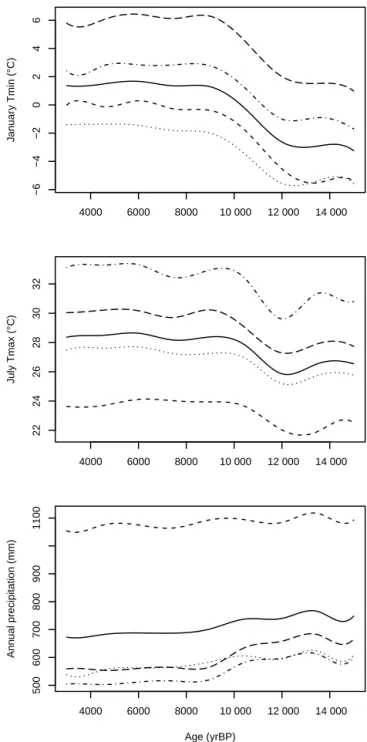
remains stable, with lower values before 12 ka. There is a de-creasing trend of precipitation, especially after 10 ka (Fig. 4), which is marked mostly in the south-eastern part of its area (Fig. S3). 4000 6000 8000 10 000 12 000 14 000 −6 −4 −2 0 2 4 6 J an uar y Tmin (°C) 4000 6000 8000 10 000 12 000 14 000 22 24 26 28 30 32 J uly Tmax (°C) 4000 6000 8000 10 000 12 000 14 000 500 600 700 800 900 1100 Age (yrBP) Ann ual precipitation (mm)
Figure 4.Minimum and maximum temperatures of January and July, respectively, and annual precipitation during the last 15 kyr. The solid line represents the average climate in the study area. The remaining lines are the average of each cluster found – C1: short-dash line; C2: dotted line; C3: short-dash-dot line; and C4: long-short-dash line.
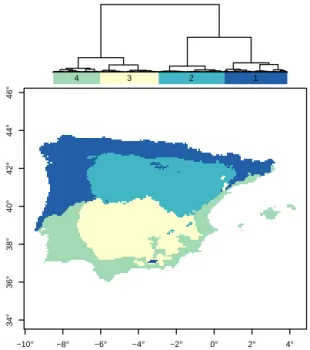
The clustering of the first fPCA component for the three reconstructed variables are spatially structured (Fig. 5), and allow their overall trends to be summarised (Fig. 4). The first component of each variable explains more than
95 % of the variation (Tjan: 95.5 %; Tjul: 99.2 %; Pann:
99.5 %). Cluster C1 (27 % of the total area) is located mostly in northern and western Iberia and includes part of
1 2 3 4 −10° −8° −6° −4° −2° 0° 2° 4° 34° 36° 38° 40° 42° 44° 46°
Figure 5.Hierarchical cluster analysis of the functional PCA
com-ponents of Tjan, Tjul, and Pannin the last 15 kyr found in the study
area. The top dendrogram represents the size of the clusters of simi-lar climate evolution and the relations between them. Numbers cor-respond to each identified cluster.
the north-Iberian mountain ranges but also low altitudinal coastal areas (average altitude is 679 ± 454 m). This is the
wettest cluster with Pann ranging from 1054 to 1115mm,
the coldest in July (21.7 < Tjul<24.2◦C) and with very
low January minimum temperatures (−5.5 < Tjan<0.2◦C).
The C2 cluster encompasses part of the Cantabrian moun-tain range and the central Iberian system (28 % of the to-tal area with an average altitude of 859 ± 303 m). It occu-pies most of the northern plateau, where it has the
low-est January temperature (−5.7 < Tjan< −1.3◦C), whereas
July (25.1 < Tjul<27.7◦C) is warmer than within C1.
This shows high seasonal amplitude with low
precipita-tion (537 < Pann<621 mm), similar to C3 and C4. The
dissimilarities between clusters C3 and C4 (25 and 20 % of the total area and average altitude of 613 ± 96 and 278 ± 232 m, respectively) concern mainly the temperature. Cluster C4 is warmer and wetter than C3. These are the
warmest areas for both January (C3: −1.7 < Tjan<3.0; C4:
1.0 < Tjan<6.4◦C) and July (C3: 29.4 < Tjul < 33.4; C4:
27.2 < Tjul<30.3◦C) and with low annual precipitation (C3:
504 < Pann<614; C4: 555 < Pann>682 mm). The Balearic
Islands are fully included in the C4 cluster (Fig. 5).
The mean absolute deviance from the current climate shows that the climate stability during the last 15 kyr was
not spatially uniform (Fig. 6). Tjanand Pannexhibited higher
stability in the southern Iberia, although Tjanhas lower
val-ues of deviance (higher stability) towards the eastern coast
and Panntowards the western coast. Tjulexhibited lower
de-viance at higher altitudes, particularly at the central system, northern mountains, and Pyrenees, but also in the southern Sierra Morena.
4 Discussion
Fossil pollen data provide a record of vegetation changes which constitutes a valuable proxy for reconstructing past climate changes, especially using large data sets (Bartlein et al., 2010). The method used here provides reliable climate reconstructions, despite the low number of sequences se-lected according to our quality criteria for spatial climate re-construction, both in terms of sampling resolution and
num-ber of14C dates. The western part of the peninsula has a
bet-ter data coverage which provides more robust spatial inbet-ter- inter-polations, particularly for the most recent to middle time pe-riods analysed. Nevertheless, the spatial uncertainty related to the interpolation shows a uniform variance for all time pe-riods (Fig. S4). The only exception is the north-western part of the study area, where the lack of data promotes higher un-certainty for the spatial interpolation. The residuals between observed climate and reconstructed climate were high, result-ing also in a low coefficient of determination for the linear re-gression (Fig. S1). However, this is expectable since we were comparing observed climate data with reconstructed values of the last 500 years and averaging the climate variation in this period tend to increase the residuals. In addition, the an-thropogenic impact on the ecosystems is likely also biasing the results. Nevertheless, a positive linear trend with a signif-icant positive correlation was found between reconstructed climate and observed climate that allows us to produce a ref-erence data set using this model and the observed climate. The results provided here reinforce the role of the Iberian Peninsula as a glacial refugium and holding enough climate variation (Fig. 5) to support a network of smaller refugial ar-eas (Weiss and Ferrand, 2007).
Climate of the last 15 kyr was dynamic, with oscillations of temperature and precipitation occurring mostly at the southern part of the peninsula. Given the link between cli-mate and species distributions (Hewitt, 2000), it is likely that these changes had an impact on the location, extent and evo-lution of the refugia and the recolonisation processes during the post-glacial period. Nonetheless, the reconstructed over-all trend is a noticeable warming in winter temperatures after 15 ka, particularly between 12 and 9 ka (Fig. 4) that is likely due to the increase in the summer insolation in the north-ern hemisphere (Berger, 1978). This warming trend tends to reduce the area in the Iberian Peninsula with very low tem-peratures (Fig. 3). Although insolation peaks at 9 ka and de-creases afterwards, it does not translate to a general cooling and in south-western Europe is seen an increase in insola-tion in both summer and winter (Davis et al., 2003). A strik-ing pattern is the partitionstrik-ing of the peninsula in spatially structured areas that shared similar climate trend over the late
January Tmin 0.7 1.6 2.2 3.2 6.4 July Tmax 0.3 1 1.1 1.2 1.8 Annual precipitation 35.1 51.8 65.4 85.5 121.5
Figure 6.Average differences between millennia for each of the climate variables. Calculation of the differences are computed between a given age and the previous one. Isolines in each map indicate the average value of change.
Quaternary (Fig. 5). The wettest and cold cluster C1 is pre-dominantly located at the northern and north-western Iberia and occupies most of the current temperate climate zone. Al-though very similar to C2, it contrasts in the seasonal am-plitude and precipitation amount. Interestingly, the pattern of current bioclimate zones in Iberian Peninsula is retrieved on the clusters scheme, suggesting the persistence of a transi-tion area between very different climate zones, although the magnitude of the differences have changed in the past.
Our results show that January temperatures exhibited a general warming trend over the last 15 000 years which
cor-responds on average to an increase of ∼ 5.5◦C. The southern
part of the peninsula is more resilient to change, particularly
for Tjanand Pann, whereas the northern part recorded major
changes. This pattern is less obvious for July temperatures, where variations showed a smaller amplitude even though this variable is markedly different between clusters, thus con-tributing to the climate split of the study area (Fig. 4, Fig. S5). The minimum winter temperatures constrain the physiologic ability of plants to further development and, thus, are a ma-jor factor restricting distributions (Sykes et al., 1996). Higher summer insolation provides enough energy to plant growth and July temperature in the Mediterranean is a less limiting
variable for growth than Tjanwhich makes the reconstruction
of summer months and its interpretation more complex.
4.1 The end of the Pleistocene
The 1000-year time interval provides enough resolution to analyse general patterns of climate evolution. However, abrupt climate events are not detectable. The end of the Old-est Dryas (OD; ending around 14.5 ka) is characterised in Iberia by a vegetation change compatible with cold and hu-mid conditions (Naughton et al., 2007, 2015) and is followed by the Bölling–Allerød warm period (B-A; ending around 13 ka). Our results show a similar pattern with colder condi-tions between 15 ka and 13 ka and a higher humidity (Fig. 4), particularly evident in the central and southern clusters. Al-though all clusters show a similar trend, the C1 and C2 are colder than average. The general pattern in the Iberian
Penin-sula is a contrast between a colder north and a warmer south but, nevertheless, an area dominated by low January temper-atures (Fig. 3, Fig. S3, S5). The evolution of precipitation during the last 15 kyr in the Iberian Peninsula shows a very stable pattern: northern areas comprised in C1 had high pre-cipitation values during the period analysed, while the south was wetter than today (Fig. S3, S5). The increase in the mois-ture availability during the B-A (Naughton et al., 2015) is in line with the slight increase in precipitation in all clusters be-tween 14 and 13 ka (Fig. 3).
As described earlier in Europe (Renssen and Isarin, 2001;
Heiri et al., 2004), Tjan shows wider changes in amplitude
than Tjul. The cold to warm transitions that occurred at ∼ 14.7
and 11.5 ka (Renssen and Isarin, 2001; von Grafenstein et al., 2012) in Europe had a spatial impact that is noticeable in the reconstructed temperatures (Fig. 3, Fig. S3, S5).
4.2 The Holocene
The B-A warm stage is followed by the cold Younger Dryas (YD; between ∼ 12.9 and ∼ 11.7 ka), marking the beginning of the Holocene. This period records a warming trend for
Tjan, while Tjandecreased abruptly (Fig. 4) with a reduction
of the warmer areas between 13 and 12 ka (Fig. 3).
The Holocene warm period (approximately between ∼ 8.2 and 5.6 ka, depending on the location in Europe) is charac-terised by increasing summer temperatures (Seppä and Birks, 2001). Such trend is more obvious in northern Europe and the Alps, while we rather observe a cooling at lower latitudes (Davis et al., 2003). Our results point to a slight decrease in
Tjanand Tjularound 7 ka, but the overall temperature pattern
is rather stable. This is likely affected by the temporal
resolu-tion of this study, failing to clearly detect rapid events. Pann
shows a slightly wetter climate at 7 ka (Fig. 3) which is con-sistent with earlier reconstruction for the southern European lowlands (Cheddadi et al., 1997).
Between 6 and 3 ka, areas with low precipitation expand in the Iberian Peninsula (Fig. 3), which allows the expansion of the Mediterranean taxa (Naughton et al., 2007; Carrión et al., 2010b, a). The increasing aridity trend in the south is
balanced by the high precipitation values in the north (Fig. 4, Fig. S3, S5), contributing to the shaping of the current Iberia pattern of two contrasting bioclimatic regions: the north is temperate and wet while the south is a dry and warm.
The behaviour of the reconstructed variables at 5 ka is likely to be influenced by non-natural ecosystem changes due to human activities such as the forest degradation that began in lowlands and later in mountainous areas (Carrión et al., 2010a). These human impacts add confounding effects in the fossil pollen record and may lead to slightly biased temperature reconstructions after 5 ka. On the other hand, hu-man impacts at larger scales, capable of leaving noticeable imprints on landscape, were likely to happen later (Carrión et al., 2010a) and, furthermore, there is evidence of a cooling and drier stage in the Iberian Peninsula after 5 ka (Dorado Valiño et al., 2002).
4.3 Climate role in Iberian refugia
The climate change since the LGM in the Iberian Penin-sula had an impact on the persistence of temperate species, migrating pathways, and on the overall recolonisation pro-cesses during the post-glacial period within the peninsula (Hewitt, 2000; Naughton et al., 2007; Carrión et al., 2010b). During this period, climate favoured migrations and expan-sion processes that culminated in secondary contacts for sev-eral lineages previously isolated in patches of suitable habi-tat (Branco et al., 2002; Godinho et al., 2006; Weiss and Ferrand, 2007; Miraldo et al., 2011). Particularly the B-A warming phase and the warming stage after the YD, which we show here and which have highly affected the spatial or-ganisation of the climate in the Iberian Peninsula, are likely favouring expansion processes of warmth-dependent organ-isms. Given the relationship between climate change and bio-diversity patterns, the clustering scheme (Fig. 5) depicting areas with different climate evolution is consistent with the molecular evidence of a network of putative refugia within Iberia (Weiss and Ferrand, 2007). Refugia have been asso-ciated with climate and habitat stability, with both playing complementary roles (Ashcroft, 2010). However, as shown by large-scale landscape analysis (Carrión et al., 2010b, a) and climate reconstructions (Davis et al., 2003; Cheddadi and Bar-Hen, 2009), both have a strong dynamic nature in the Iberian Peninsula and likely promoted the formation of patches of suitable habitat during harsh conditions. The highly structured populations that many species exhibit in the Iberian Peninsula have contributed decisively to the idea of refugia diversity (Hewitt, 2000; Weiss and Ferrand, 2007). Overall, the information included in the multidimensional climate data allowed us to define areas characterised by a cli-mate evolution during the late Quaternary with smaller am-plitude of change (clusters C3 and C4). These areas showed
higher stability of both Tjan and Pann (Fig. 6). Cluster C4
coincides at a great extent with areas that offered more re-silience to change between millennia (Fig. 5). Within these
areas, temperature and precipitation were suitable to support the survival of temperate trees, likely acting as glacial refu-gia. On the other hand, the cold areas of the first and sec-ond cluster also associated with faster changes cluster likely diminished the suitability for the long term persistence of species. One might infer that the defined clusters are asso-ciated with potential isolation or dispersal events of species throughout the studied time span. Particularly, the fourth cluster (Fig. 5) includes areas that have already been de-scribed as glacial refugia for several animal and plant species (Weiss and Ferrand, 2007; see chapter 5 for a review of refugia in the Iberian Peninsula). In the area represented by
this cluster, the reconstructed Tjan indicate a mild climate
with higher precipitation than currently, which is compatible with the persistence of species in these areas. The southern plateau, mostly comprised in the second cluster (Fig. 5), also recorded mild conditions which are often associated with
southern refugia; however, the rapid Tjul oscillations
asso-ciated with a cold Tjan and low precipitation may have
pre-vented long-term persistence but are likely compatible with a recolonisation process.
The pattern of stability indicates a southern Iberia with
less change, particularly Tjan and Pann. High altitudes offer
more resilience to change, particularly to July temperature, and lower areas may be swept rapidly with occurring changes (see Fig. S6). Our data suggest that, at the regional scale and with extensive time-series data, this relation is preserved. Ar-eas of lower velocity of change, which are hence more stable, are associated with high levels of endemicity at global scales (Sandel et al., 2011), and areas of high velocity are often as-sociated with species extinction (Nogués-Bravo et al., 2010). Our results indicate higher stability in the southern part of the Peninsula, similar to other studies based on climate data (Ohlemüller et al., 2012). However, our studied time frame extends to 15 ka, which does not cover the glacial maximum (∼ 21 ka). At that time period, a higher degree of fragmenta-tion of the stability is expected due to colder condifragmenta-tions, and areas compatible with refugia would be also less contiguous. These could be seen as a macrorefugia, offering conditions for large population during glacial times (Mee and Moore, 2014). Microrefugia are known to occur in the northern areas of the Iberian Peninsula (e.g. Fuentes-Utrilla et al., 2014), but the spatial scale used and the number of pollen sites available render microrefugia undetectable in this study.
5 Conclusions
The reconstruction of past climates using biological data is an invaluable resource for the study of the dynamics of glacial refugial areas. Although there is a limited number of available sites and time range coverage, the spatial combina-tion of fossil pollen data provides a continuous record with a climate signal that can be translated into spatially explicit analysis of climate dynamics.
The reconstructed climate variables for the post-glacial period show different patterns of evolution but are clearly marked by the lasting impact of climatic events. The Iberian Peninsula had areas that shared similar climate evolution dur-ing the late Quaternary. Some areas that we have suggested as potential refugia are consistent with those areas where ge-netic diversity was found to be high and which are often con-sidered as refugial areas for several animal and plant species. The analysis of these areas and the related climate pro-vides new insights into the dynamics of refugia through time and space, which helps in gaining a better understanding of the evolution of biodiversity hotspots both at the species and the intraspecific levels. Linking past climate and diversity in the Iberian Peninsula is a major issue for conservation issues, especially under the expected future climate change.
Data availability
The distribution data for Mediterranean species (Legind, 2011) were downloaded from GBIF portal (http://www.gbif. org). The raw fossil pollen data (Leydet, 2011) is acces-sible for most used sites at the European Pollen database (http://www.europeanpollendatabase.net). For the remaining sites, data is available by request to the author of the respec-tive publication (see Table 1 for a description of the data sets and sources). The climate data (Hijmans et al., 2011) is accessible at the WorldClim website (www.worldclim.org). The output reconstructions, anomalies and variance maps are available in NetCDF format as supplementary material.
The Supplement related to this article is available online at doi:10.5194/cp-12-1137-2016-supplement.
Acknowledgements. Pedro Tarroso was funded through a PhD grant (SFRH/BD/42480/2007) and a post-doc grant (SFRH/BPD/93473/2013) and José Carlos Brito is supported by a contract (IF/00459/2013), both from Fundação para a Ciência e Tecnologia. José Carrión’s contribution was funded by the project Paleoflora y Paleovegetación ibérica, Plan Nacional de I+D+i, Ref. CGL-2009-06988/BOS. Luisa Santos acknowledges the contribution of M. C. Freitas and C. Andrade (University of Lisbon), who provided the cores. The authors would like to acknowledge all contributors of the European Pollen Database and the Global Biodiversity Information Facility for making their data sets publicly available to the scientific community. We are very grateful to Basil Davis for his kind support and comments. We also thank William Fletcher and Maria Sanchez-Goñi for data contribution and comments, and also Penélope González-Sampériz for contributions. We are also grateful to Graciela Gil Romera, Ana Ortega, and an anonymous referee for the extensive reviews that greatly improved the quality of the manuscript. This is ISEM contribution no. 2016-076.
Edited by: V. Rath
References
Allen, J., Huntley, B., and Watts, W.: The vegetation and climate of northwest Iberia over the last 14 000 years, J. Quaternary Sci., 11, 125–147, 1996.
Anderson, N. J., Bugmann, H., Dearing, J. A., and Gaillard, M.-J.: Linking palaeoenvironmental data and models to understand the past and to predict the future, Trends Ecol. Evol., 21, 696–704, 2006.
Araújo, M. B., Thuiller, W., and Pearson, R. G.: Climate warm-ing and the decline of amphibians and reptiles in Europe, J. Bio-geogr., 33, 1712–1728, 2006.
Ashcroft, M. B.: Identifying refugia from climate change, J. Bio-geogr., 37, 1407–1413, 2010.
Bartlein, P. J., Harrison, S. P., Brewer, S., Connor, S., Davis, B. A. S., Gajewski, K., Guiot, J., Harrison-Prentice, T. I., Hender-son, A., Peyron, O., Prentice, I. C., Scholze, M., Seppä, H., Shu-man, B., Sugita, S., Thompson, R. S., Viau, A. E., Williams, J., and Wu, H.: Pollen-based continental climate reconstruction at 6 and 21 ka: a global synthesis, Clim. Dynam., 37, 775–802, 2010. Bennett, K. and Provan, J.: What do we mean by “refugia”?,
Qua-ternary Sci. Rev., 27, 2449–2455, 2008.
Berger, A.: Long-term variations of caloric insolation resulting from the Earth’s orbital elements, Quaternary Res., 9, 139–167, 1978. Bickel, P., Diggle, P., Fienberg, S., Gather, U., Olkin, I., Zeger, S., Ramsay, J., and Silverman, B.: Functional data analysis, Springer, New York, 2nd Edn., 2005.
Birks, H., Heiri, O., Seppä, H., and Bjune, A.: Strengths and weak-nesses of quantitative climate reconstructions based on Late-Quaternary biological proxies, The Open Ecology Journal, 3, 68– 110, 2010.
Branco, M., Monnerot, M., Ferrand, N., and Templeton, A. R.: Post-glacial dispersal of the European rabbit (Oryctolagus
cunicu-lus) on the Iberian peninsula reconstructed from nested clade
and mismatch analyses of mitochondrial DNA genetic variation, Evolution, 56, 792–803, 2002.
Burjachs, F., Pérez-Obiol, R., Roure, J. M., and Julia, R.: Dinámica de la vegetación durante el Holoceno en la isla de Mallorca, Tra-bajos de Palinología básica y aplicada, 199–210, 1994.
Carrión, J. S.: Patterns and processes of Late Quaternary environ-mental change in a montane region of southwestern Europe, Qua-ternary Sci. Rev., 21, 2047–2066, 2002.
Carrión, J. S. and Dupré, M.: Late Quaternary vegetational history at Navarres, Eastern Spain. A two core approach, New Phytol., 134, 177–191, doi:10.1111/j.1469-8137.1996.tb01157.x, 1996. Carrión, J. S., Sánchez-Gómez, P., Mota, J. F., Yll, R., and Chaín,
C.: Holocene vegetation dynamics, fire and grazing in the Sierra de Gádor Spain, Holocene, 13, 839–849, 2003.
Carrión, J. S., Fernández, S., Jiménez-Moreno, G., Fauquette, S., Gil-Romera, G., González-Sampériz, P., and Finlayson, C.: The historical origins of aridity and vegetation degradation in south-eastern Spain, J. Arid Environ., 74, 731–736, 2010a.
Carrión, J. S., Fernández, S., González-Sampériz, P., Gil-Romera, G., Badal, E., Carrión-Marco, Y., López-Merino, L., López-Sáez, J. A., Fierro, E., and Burjachs, F.: Expected trends and surprises in the Lateglacial and Holocene vegetation history of the Iberian Peninsula and Balearic Islands, Rev. Palaeobot. Palyno., 162, 458–475, 2010b.
Cheddadi, R. and Bar-Hen, A.: Spatial gradient of temperature and potential vegetation feedback across Europe during the late Qua-ternary, Clim. Dynam., 32, 371–379, 2009.
Cheddadi, R., Yu, G., Guiot, J., Harrison, S., and Prentice, I. C.: The climate of Europe 6000 years ago, Clim. Dynam., 13, 1–9, 1997. Cheddadi, R., Vendramin, G. G., Litt, T., François, L., Kageyama, M., Lorentz, S., Laurent, J.-M., de Beaulieu, J.-L., Sadori, L., Jost, A., and Lunt, D.: Imprints of glacial refugia in the modern genetic diversity of Pinus sylvestris, Global Ecol. Biogeogr., 15, 271–282, 2006.
Cheddadi, R., Birks, H. J. B., Tarroso, P., Liepelt, S., Gömöry, D., Dullinger, S., Meier, E. S., Hülber, K., Maiorano, L., and Laborde, H.: Revisiting tree-migration rates: Abies alba (Mill.), a case study, Veg. Hist. Archaeobot., 23, 113–122, 2014. Chevalier, M., Cheddadi, R., and Chase, B. M.: CREST (Climate
REconstruction SofTware): a probability density function (PDF)-based quantitative climate reconstruction method, Clim. Past, 10, 2081–2098, doi:10.5194/cp-10-2081-2014, 2014.
Cox, N., Chanson, J., and Stuart, S.: The status and distribution of reptiles and amphibians of the Mediterranean Basin, IUCN, Gland, Switzerland and Cambridge, UK, 2006.
Davis, B. A. S. and Stevenson, A. C.: The 8.2 ka event and Early-Mid Holocene forests, fires and flooding in the Central Ebro Desert, NE Spain, Quaternary Sci. Rev., 26, 1695–1712, doi:10.1016/j.quascirev.2007.04.007, 2007.
Davis, B. A. S., Brewer, S., Stevenson, A. C., Guiot, J., and Contrib-utors, D.: The temperature of Europe during the Holocene recon-structed from pollen data, Quaternary Sci. Rev., 22, 1701–1716, 2003.
Dorado Valiño, M., Rodríguez, A. V., Zapata, M. B. R., García, M. J. G., and Gutiérrez, I. D. B.: Climatic changes since the Late-glacial/Holocene transition in La Mancha Plain (South-central Iberian Peninsula, Spain) and their incidence on Las Tablas de Daimiel marshlands, Quatern. Int., 93–94, 73–84, 2002. Fletcher, W. J., Boski, T., and Moura, D.: Palynological evidence for
environmental and climatic change in the lower Guadiana valley, Portugal, during the last 13 000 years, Holocene, 17, 481–494, 2007.
Fuentes-Utrilla, P., Venturas, M., Hollingsworth, P. M., Squirrell, J., Collada, C., Stone, G. N., and Gil, L.: Extending glacial refugia for a European tree: genetic markers show that Iberian popula-tions of white elm are native relicts and not introducpopula-tions, Hered-ity, 112, 105–13, 2014.
Furrer, R., Nychka, D., and Sain, S.: fields: Tools for spatial data, R package version 8.3-6, https://CRAN.R-project.org/package= fields, 2016.
Godinho, R., Mendonça, B., Crespo, E. G., and Ferrand, N.: Ge-nealogy of the nuclear beta-fibrinogen locus in a highly struc-tured lizard species: comparison with mtDNA and evidence for intragenic recombination in the hybrid zone, Heredity, 96, 454– 63, 2006.
Guiot, J.: Palaeoclimatology: Back at the last interglacial, Nature, 388, 25–27, 1997.
Guiter, F., Andrieu-Ponel, V., Digerfeldt, G., Reille, M., De Beaulieu, J. L., and Ponel, P.: Vegetation history and lake-level changes from the Younger Dryas to the present in Eastern Pyre-nees (France): Pollen, plant macrofossils and lithostratigraphy from Lake Racou (2000 m a.s.l.), Veg. Hist. Archaeobot., 14, 99– 118, doi:10.1007/s00334-005-0065-z, 2005.
Heiri, O., Tinner, W., and Lotter, A. F.: Evidence for cooler Eu-ropean summers during periods of changing meltwater flux to the North Atlantic, P. Natl. Acad. Sci. USA, 101, 15285–15288, 2004.
Hewitt, G.: The genetic legacy of the Quaternary ice ages, Nature, 405, 907–13, 2000.
Hicks, S.: When no pollen does not mean no trees, Veg. Hist. Ar-chaeobot., 15, 253–261, 2006.
Hijmans, R. J., Cameron, S. E., Parra, J. L., Jones, P. G., and Jarvis, A.: Very high resolution interpolated climate surfaces for global land areas, Int. J. Climatol., 25, 1965–1978, 2005.
Hijmans, R. J., Cameron, S. E., Parra, J. L., Jones, P. G., and Jarvis, A.: WorldClim – Global Climate Data, available at: http://www. worldclim.org, last access: July 2011.
Hu, F. S., Hampe, A., and Petit, R. J.: Paleoecology meets genetics: deciphering past vegetational dynamics, Front. Ecol. Environ., 7, 371–379, 2009.
Jalas, J. and Suominen, J. (Eds.): Atlas Florae Europaeae. Distribu-tion of vascular plants in Europe, The Committee for Mapping the Flora of Europe and Societas Biologica Fennica Vanamo, Helsinki, Finland, 1972, 1–10, 1973, 1976, 1979, 1980, 1983, 1986, 1989, 1991, 1994.
Jalas, J., Suominen, J., and Lampinen, R. (Eds.): Atlas Florae Eu-ropaeae. Distribution of vascular plants in Europe, The Commit-tee for Mapping the Flora of Europe and Societas Biologica Fen-nica Vanamo, Helsinki, Finland, Vol. 11, 1996.
Jalas, J., Suominen, J., Lampinen, R., and Kurtto, A. (Eds.): Atlas Florae Europaeae. Distribution of vascular plants in Europe, The Committee for Mapping the Flora of Europe and Societas Bio-logica Fennica Vanamo, Helsinki, Finland, Vol. 12, 1999. Jarvis, C. H. and Stuart, N.: A Comparison among Strategies for
Interpolating Maximum and Minimum Daily Air Temperatures, Part II: The Interaction between Number of Guiding Variables and the Type of Interpolation Method, J. Appl. Meteorol., 40, 1075–1084, 2001.
Keitt, T. H., Bivand, R., Pebesma, E., and Rowlingson, B.: rgdal: Bindings for the Geospatial Data Abstraction Library, R package version 1.1-8, https://CRAN.R-project.org/package=rgdal, 2016. Kühl, N. and Gobet, E.: Climatic evolution during the Middle Pleis-tocene warm period of Bilshausen, Germany, compared to the Holocene, Quaternary Sci. Rev., 29, 3736–3749, 2010.
Kühl, N., Gebhardt, C., Litt, T., and Hense, A.: Probability Den-sity Functions as Botanical-Climatological Transfer Functions for Climate Reconstruction, Quaternary Res., 58, 381–392, 2002. Laurent, J. M., Bar-Hen, A., François, L., Ghislain, M., and Ched-dadi, R.: Refining vegetation simulation models: from plant func-tional types to bioclimatic affinity groups of plants, J. Veg. Sci., 15, 739–746, 2004.
Legind, J.: Global Biodiversity Information Facility, http://www. gbif.org, last access: July 2011.
Leydet, M.: European Pollen Database, available at: http://www. europeanpollendatabase.net, last access: July 2011.
MacDonald, G., Bennett, K., Jackson, S., Parducci, L., Smith, F., Smol, J., and Willis, K.: Impacts of climate change on species, populations and communities: palaeobiogeographical insights and frontiers, Prog. Phys. Geog., 32, 139–172, 2008.
Mauri, A., Davis, B. A. S., Collins, P., and Kaplan, J.: The climate of Europe during the Holocene: a gridded pollen-based
recon-struction and its multi-proxy evaluation, Quaternary Sci. Rev., 112, 109–127, 2015.
McKeever, M. H.: Comparative palynological studies of two lake sites in western Ireland and north-western Spain, PhD thesis, Trinity College, Dublin, Ireland, 1984.
Médail, F. and Diadema, K.: Glacial refugia influence plant diver-sity patterns in the Mediterranean Basin, J. Biogeogr., 36, 1333– 1345, 2009.
Médail, F. and Quézel, P.: Biodiversity hotspots in the Mediter-ranean Basin: setting global conservation priorities, Conserv. Biol., 13, 1510–1513, 1999.
Mee, J. A. and Moore, J.-S.: The ecological and evolutionary impli-cations of microrefugia, J. Biogeogr., 41, 837–841, 2014. Miraldo, A., Hewitt, G. M., Paulo, O. S., and Emerson, B. C.:
Phylogeography and demographic history of Lacerta lepida in the Iberian Peninsula: multiple refugia, range expansions and secondary contact zones, BMC Evol. Biol., 11, 170, doi:10.1186/1471-2148-11-170, 2011.
Myers, N., Mittermeier, R., Mittermeier, C., Da Fonseca, G., and Kent, J.: Biodiversity hotspots for conservation priorities, Nature, 403, 853–858, 2000.
Naughton, F., Sanchez-Goñi, M., Desprat, S., Turon, J.-L., Duprat, J., Malaizé, B., Joli, C., Cortijo, E., Drago, T., and Freitas, M.: Present-day and past (last 25 000 years) marine pollen signal off western Iberia, Mar. Micropaleontol., 62, 91–114, 2007. Naughton, F., Sanchez Goñi, M., Rodrigues, T., Salgueiro, E.,
Costas, S., Desprat, S., Duprat, J., Michel, E., Rossignol, L., Zaragosi, S., Voelker, A., and Abrantes, F.: Climate variability across the last deglaciation in NW Iberia and its margin, Quatern. Int., in press, doi:10.1016/j.quaint.2015.08.073, 2015.
Nogués-Bravo, D., Ohlemüller, R., Batra, P., and Araújo, M. B.: Climate predictors of late quaternary extinctions, Evolution, 64, 2442–2449, 2010.
Ohlemüller, R., Huntley, B., Normand, S., and Svenning, J.-C.: Po-tential source and sink locations for climate-driven species range shifts in Europe since the Last Glacial Maximum, Global Ecol. Biogeogr., 21, 152–163, 2012.
Olson, D. M., Dinerstein, E., Wikramanayake, E. D., Burgess, N. D., Powell, G. V. N., Underwood, E. C., D’amico, J. A., Itoua, I., Strand, H. E., Morrison, J. C., Loucks, C. J., Allnutt, T. F., Ricketts, T. H., Kura, Y., Lamoreux, J. F., Wettengel, W. W., Hedao, P., and Kassem, K. R.: Terrestrial Ecoregions of the World: A New Map of Life on Earth, BioScience, 51, 933–938, 2001.
Pantaleón-Cano, J.: Estudi palinològic de sediments litorals de la provincia dAlmería, PhD thesis, Universitat Autònoma de Barcelona, Barcelona, Spain, 1997.
Parmesan, C. and Yohe, G.: A globally coherent fingerprint of cli-mate change impacts across natural systems, Nature, 421, 37–42, 2003.
Pebesma, E. J.: Multivariable geostatistics in S: the gstat package, Comput. Geosci., 30, 683–691, 2004.
Peñalba Garmendia, M. C.: Dynamique de végétation tardiglaciaire et holocène du centre-nord de l’Espagne d’après l’analyse pollinique, PhD thesis, Université dAix-Marseille, Marseille, France, 1989.
Perez-Obiol, R., Jalut, G., Julia, R., Pelachs, A., Iriarte, M. J., Otto, T., Hernandez-Beloqui, B., and Pérez-Obiol, R.:
Mid-Holocene vegetation and climatic history of the Iberian Penin-sula, Holocene, 21, 75–93, 2011.
Pèrez-Obiol, R. and Julià, R.: Climatic change on the Iberian Penin-sula recorded in a 30,000-yr pollen record from Lake Banyoles, Quaternary Res., 41, 91–98, 1994.
Petit, R. J., Aguinagalde, I., de Beaulieu, J.-L., Bittkau, C., Brewer, S., Cheddadi, R., Ennos, R., Fineschi, S., Grivet, D., Las-coux, M., Mohanty, A., Müller-Starck, G., Demesure-Musch, B., Palmé, A., Martín, J. P., Rendell, S., and Vendramin, G. G.: Glacial refugia: hotspots but not melting pots of genetic diversity, Science, 300, 1563–1565, 2003.
Pons, A. and Reille, A.: The Holocene and Upper Pleistocene pollen record from Padul (Granada, Spain): a new study, Palaeogeogr. Palaeoecl., 66, 243–263, 1988.
Queiroz, P.: Ecologia Histórica da Paisagem do Noroeste Alente-jano, PhD thesis, Lisbon University, 1999.
R Development Core Team: R: A Language and Environment for Statistical Computing, R Foundation for Statistical Computing, Vienna, Austria, 2012.
Ramsay, J. O., Wickham, H., Graves, S., and Hooker, G.: fda: Func-tional Data Analysis, R package version 2.4.4, https://CRAN. R-project.org/package=fda, 2014.
Rebelo, H., Tarroso, P., and Jones, G.: Predicted impact of climate change on European bats in relation to their biogeographic pat-terns, Glob. Change Biol., 16, 561–576, 2010.
Reille, M.: L’interface Tardiglaciaire-Holocène dans un site du lit-toral atlantique sud-européen: le Moura (Pyrénées Atlantiques, France), Comptes rendus de l’Académie des sciences, Série 3, Sciences de la vie, 316, 463–468, 1993.
Reille, M. and Andrieu, V.: The late Pleistocene and Holocene in the Lourdes Basin, western Pyrenees, France: new pollen: analytical and chronological data, Veg. Hist. Archaeobot., 4, 1–21, 1995. Renssen, H. and Isarin, R. F. B.: The two major warming phases of
the last deglaciation at 14.7 and 11.5 ka cal BP in Europe: climate reconstructions and AGCM experiments, Global Planet. Change, 30, 117–153, 2001.
Roucoux, K., Abreu, L. D., Shackleton, N. J., and Tzedakis, P. C.: The response of NW Iberian vegetation to North Atlantic cli-mate oscillations during the last 65kyr, Quaternary Sci. Rev., 24, 1637–1653, 2005.
Sánchez-Goñi, M. F. and Hannon, G. E.: High-altitude vegetational pattern on the Iberian Mountain Chain (north-central Spain) dur-ing the Holocene, Holocene, 9, 39–57, 1999.
Sandel, B., Arge, L., Dalsgaard, B., Davies, R. G., Gaston, K. J., Sutherland, W. J., and Svenning, J.-C.: The influence of Late Quaternary climate-change velocity on species endemism, Sci-ence, 334, 660–664, 2011.
Santos, L. and Sánchez-Goñi, M. F.: Lateglacial and Holocene en-vironmental changes in Portuguese coastal lagoons 3: vegetation history of the Santo André coastal area, Holocene, 13, 459–464, 2003.
Seppä, H. and Birks, H.: July mean temperature and annual precipi-tation trends during the Holocene in the Fennoscandian tree-line area: pollen-based climate reconstructions, Holocene, 11, 527– 539, 2001.
Sillero, N., Brito, J. C., Skidmore, A. K., and Toxopeus, A. G.: Biogeographical patterns derived from remote sensing variables: the amphibians and reptiles of the Iberian Peninsula, Amphibia-Reptilia, 30, 185–206, 2009.
Sinervo, B., Méndez-de-la Cruz, F., Miles, D. B., Heulin, B., Bas-tiaans, E., Cruz, M. V.-S., Lara-Resendiz, R., Martínez-Méndez, N., Calderón-Espinosa, M. L., Meza-Lázaro, R. N., Gadsden, H., Avila, L. J., Morando, M., la Riva, I. J. D., Sepulveda, P. V., Rocha, C. F. D., Ibargüengoytía, N., Puntriano, C. A., Massot, M., Lepetz, V., Oksanen, T. A., Chapple, D. G., Bauer, A. M., Branch, W. R., Clobert, J., and Sites Jr., J. W.: Erosion of lizard diversity by climate change and altered thermal niches, Science, 328, 894–9, 2010.
Sykes, M. T., Prentice, I. C., and Cramer, W.: A Bioclimatic Model for the Potential Distributions of North European Tree Species Under Present and Future Climates, Blackwell Publishing Stable, J. Biogeogr., 23, 203–233, 1996.
Taberlet, P. and Cheddadi, R.: Quaternary refugia and persistence of biodiversity, Science, 297, 2009–2010, 2002.
Thomas, C. D., Cameron, A., Green, R. E., Bakkenes, M., Beau-mont, L. J., Collingham, Y. C., Erasmus, B. F. N., de Siqueira, M. F., Grainer, A., Hannah, L., Hughes, L., Huntley, B., van Jaarsveld, A. S., Midgley, G. F., Miles, L., Ortega-Huerta, M. A., Peterson, A. T., Phillips, l. L., and Williams, S. E.: Extinction risk from climate change, Nature, 427, 145–148, 2004.
Tzedakis, P. C., Lawson, I. T., Frogley, M. R., Hewitt, G. M., and Preece, R. C.: Buffered tree population changes in a quaternary refugium: evolutionary implications, Science, 297, 2044–2047, 2002.
Van der Knaap, W. O. and Van Leeuwen, J. F. N.: Holocene vegeta-tion, human impact, and climatic change in the Serra da Estrela, Portugal, Dissertationes Botanicae, 234, 497–535, 1994. Van der Wiel, A. M. and Wijmstra, T. A.: Palynology of the lower
part (78–120 m) of the core Tenaghi Philippon II, Middle Pleis-tocene of Macedonia, Greece, Rev. Palaeobot. Palyno., 52, 73– 88, 1987a.
Van der Wiel, A. M. and Wijmstra, T. A.: Palynology of the 112.8–197.8 m interval of the core Tenaghi Philippon III, middle Pleistocene of Macedonia, Rev. Palaeobot. Palyno., 52, 89–108, 1987b.
von Grafenstein, U., Erlenkeuser, H., Brauer, A., Jouzel, J., Johnsen, S. J., and von Grafenstein, U.: A Mid-European Decadal Isotope-Climate Record from 15, 500 to 5000 Years BP, Science, 1654, 1654–1657, 2012.
Webb, R. S., Anderson, K. H., and Webb III, T.: Pollen response-surface estimates of late-Quaternary changes in the moisture bal-ance of the northeastern United States, Quaternary Res., 40, 213– 227, 1993.
Weiss, S. and Ferrand, N. (Eds.): Phylogeography of Southern Eu-ropean Refugia, Springer, 2007.
Wijmstra, T.: Palynology of the first 30 m of a 120 m deep section in northern Greece, Acta Bot. Neerl., 18, 511–527, 1969. Wijmstra, T. A. and Smith, A.: Palynology of the middle part (30–
78 metres) of the 120 m deep section in northern Greece (Mace-donia), Acta Bot. Neerl., 25, 297–312, 1976.
Willis, K. J., Bailey, R. M., Bhagwat, S. A., and Birks, H. J. B.: Biodiversity baselines, thresholds and resilience: testing predic-tions and assumppredic-tions using palaeoecological data, Trends Ecol. Evol., 25, 583–91, 2010.
Yll, E. I., Pérez-Obiol, R., Pantaleón-Cano, J., and Roure, J. M.: Dinámica del paisaje vegetal en la vertiente mediterránea de la Península Ibérica e Islas Baleares desde el Tardiglaciar hasta el presente, Reconstrucción de Paleoambientes y cambios climáti-cos durante el Cuaternario, 3, 319–328, 1995.
Yll, E.-I., Perez-Obiol, R., Pantaleon-Cano, J., and Roure, J. M.: Palynological evidence for climatic change and human activity during the Holocene on Minorca (Balearic Islands), Quaternary Res., 48, 339–347, 1997.