HAL Id: inserm-00760269
https://www.hal.inserm.fr/inserm-00760269
Submitted on 1 Oct 2013HAL is a multi-disciplinary open access archive for the deposit and dissemination of sci-entific research documents, whether they are pub-lished or not. The documents may come from teaching and research institutions in France or abroad, or from public or private research centers.
L’archive ouverte pluridisciplinaire HAL, est destinée au dépôt et à la diffusion de documents scientifiques de niveau recherche, publiés ou non, émanant des établissements d’enseignement et de recherche français ou étrangers, des laboratoires publics ou privés.
Development of gene expression-based score to predict
sensitivity of multiple myeloma cells to DNA
methylation inhibitors.
Jérôme Moreaux, Thierry Rème, Wim Leonard, Jean-Luc Veyrune, Guilhem
Requirand, Hartmut Goldschmidt, Dirk Hose, Bernard Klein
To cite this version:
Jérôme Moreaux, Thierry Rème, Wim Leonard, Jean-Luc Veyrune, Guilhem Requirand, et al.. De-velopment of gene expression-based score to predict sensitivity of multiple myeloma cells to DNA methylation inhibitors.. Molecular Cancer Therapeutics, American Association for Cancer Research, 2012, 11 (12), pp.2685-92. �10.1158/1535-7163.MCT-12-0721�. �inserm-00760269�
Development of gene expression based score to predict
sensitivity of multiple myeloma cells to DNA methylation
inhibitors
Jerome Moreaux*‡, Thierry Rem *‡, Wim Leonard‡, Jean-luc Veyrune*‡, Guilhem Requirand*, Hartmut Goldschmidtº&, Dirk Hoseº, Bernard Klein*†‡
* CHU Montpellier, Institute of Research in Biotherapy, Montpellier, FRANCE; ‡
INSERM, U1040, Montpellier, F-34197 France; º
Medizinische Klinik und Poliklinik V, Universitätsklinikum Heidelberg, Heidelberg, Germany
†
Université MONTPELLIER1, UFR Médecine, Montpellier, France; & Nationales Centrum für Tumorerkrankungen, Heidelberg, Germany
Running Title: Gene expression based score to predict sensitivity of MM cells to DNMT inhibitor.
Corresponding author: Bernard KLEIN
INSERM U1040, Institute of Research in Biotherapy CHU Montpellier, Av Augustin Fliche
34285 Montpellier cedex, FRANCE Tel 33-(0)467337888
Fax 33-(0)467337905
Mail: [email protected]
http://irb.chu-montpellier.fr/index.htm Conflict of interest:
The authors have no conflict of interest to declare. Grant Support
This work was supported by grants from ARC (SL220110603450, Paris France, B Klein), the European Community (FP7- OVERMYR, B Klein), from the Hopp- Foundation, Germany (H Goldschmidt), the University of Heidelberg, Germany, the National Centre for Tumor Diseases, Heidelberg, Germany, the Tumorzentrum Heidelberg/Mannheim, Germany, and the Deutsche Krebshilfe, Bonn, Germany, the Deutsche Forschungsgemeinschaft, Bonn, Germany (H Goldschmidt). We thank the
Microarray Core Facility of IRB (http://irb.montp.inserm.fr/en/index.php?page=Plateau&IdEquipe=6) and the
cytometry platform of the Institute of Research in Biotherapy (http://irb.montp.inserm.fr/en/index.php?page=Plateau&IdEquipe=3, Montpellier Rio Imaging).
Abstract word count: 196 words Text word count: 2948 words
Abstract
Multiple myeloma (MM) is a plasma cell cancer with poor survival, characterized by the clonal expansion of multiple myeloma cells (MMCs), primarily in the bone marrow. Novel compounds are currently tested in this disease, but partial or minor patients’ responses are observed for most compounds used as a single agent. The design of predictors for drug efficacy could be most useful to better understand basic mechanisms targeted by these drugs and design clinical trials. In the current study, we report the building of a DNA methylation score (DM Score) predicting for the efficacy of decitabine, an inhibitor of DNA methyltransferase (DNMT), targeting methylation-regulated gene expression. DNA methylation score (DM Score) was built by identifying 47 genes regulated by decitabine in human myeloma cell lines, and whose expression in primary MMCs of previously-untreated patients is predictive for overall survival. A high DM score predicts for patients’ poor survival, and, of major interest, for high sensitivity of primary MMCs or human myeloma cells lines to decitabine in vitro. Thus, DM Score could be useful to design novel treatments with DMNT inhibitor in MM and has highlighted 47 genes whose gene products could be important for MM disease development.
Introduction
Malignant transformation requires oncogenic activation and inactivation of tumor suppressor genes, which help cancer cells overriding the normal mechanisms controlling cellular survival and proliferation (1, 2). These molecular events are caused by genetic alterations (translocations, amplification, mutations) and also by epigenetic modifications (3). Epigenetic modifications include methylation of DNA cytosine residues and histone modifications and have been shown to be critical in the initiation and progression of cancers(4). DNA methyltransferase inhibitors and HDAC inhibitors are now being used in the treatment of several hematologic malignancies including MM(5-8).
Multiple myeloma (MM) is a plasma cell neoplasm characterized by the accumulation of malignant plasma cells, termed Multiple Myeloma Cells (MMCs) within the bone marrow (BM). Despite the recent introduction of therapies such as Lenalidomide and Bortezomib, MM remains an almost incurable disease. MM arises through the accumulation of multiple genetic changes that include an aberrant or overexpression of a D-type cyclin gene, cyclin D1 (CCND1) in the case of t(11;14) translocation or gain in 11q13, cyclin D3 (CCND3) in the case of the rare t(6;14) translocation, or cyclin D2 (CCND2) on the background of a translocation involving c-maf (t(14;16)) or MMSET/FGFR3 (t(4;14)) (9, 10).
Recent studies have shown that epigenetic changes such as DNA methylation play a role by silencing various cancer-related genes in MM. Most of these studies have been performed on limited number of genes using methylation specific PCR (11-18). Among the genes identified with promoter hypermethylation in MM, cyclin-dependent kinase inhibitor 2A (CDKN2A) and transforming growth factor beta receptor 2 (TGFBR2) have been shown to be associated with a poor prognosis in MM patients
with discrepant results for CDKN2A(12). Heller at al. have identified several cancer related genes inactivated through methylation in 3 human myeloma cell lines (HMCLs) and validated the relevance of 10 of these genes in 6 additional HMCLs, premalignant PCs from 24 MGUS patients and MMCs from 111 patients with MM(19). A methylation of the promoter of the genes coding for secreted protein acidic and rich in cysteine (SPARC) or for Bcl2/adenovirus E1B 19kDa interacting protein 3 (BNIP3) promoters was associated with poor overall survival of MM patients(19). SOCS3 promoter methylation was found to be associated with extramedullary manifestations, plasma cell leukemia and significant shortened survival in MM patients(20). More recently, Morgan et al have shown that the transition of normal PC and MGUS stage to MM stage is associated with DNA hypomethylation, but the transition of intramedullary MM stage to plasma cell leukemia or HMCL stage is associated with DNA hypermethylation(21). They described 2 specific subgroups of hyperdiploid MM on the basis of their methylation profile, which had a significantly different overall survival(21).
DNMT inhibitors can be sub-divided into nucleoside analogue and non-nucleoside analogue families. 5-Azacytidine (azacytidine) or 5-Aza-2’-deoxycytidine (decitabine) are both nucleoside analogues with approval for use in myelodysplastic syndrome by Food and Drug Administration. Clinical trials in myeloma combining these demethylating agents with chemotherapy or other agents are underway(8). An important objective for optimizing these clinical trials will be the identification of biomarkers predictive for sensitivity of MMCs to DNMTi. In the present study, we used gene expression profiling of Multiple Myeloma Cells (MMCs) to build a novel
“DNA methylation gene expression score” that makes it possible identification of patients whose MMCs will be targeted by DNMT inhibition.
Materials and methods
Human Myeloma Cell Lines (HMCLs)
XG-1, XG-2, XG-3, XG-4, XG-5, XG-6, XG-7, XG-10, XG-11, XG-12, XG-13, XG-14, XG-16, XG-19, XG-20 and XG-21 human myeloma cell lines were obtained as previously described(22-26). JJN3 was kindly provided by Dr Van Riet (Bruxelles, Belgium), JIM3 by Dr MacLennan (Birmingham, UK) and MM1S by Dr S. Rosen (Chicago, USA). AMO-1, LP1, L363, U266, OPM2, and SKMM2 were from DSMZ (Germany) and RPMI8226 from ATTC (USA). All HMCLs derived in our laboratory were cultured in the presence of recombinant IL-6. Gene expression profiling data from HMCLs have been deposited in the ArrayExpress public database under accession numbers E-TABM-937 and E-TABM-1088. The myeloma cell lines were authenticated in our laboratory.
Primary multiple myeloma cells
Bone marrow samples were collected after patients’ written informed consent in accordance with the Declaration of Helsinki and institutional research board approval from Heidelberg and Montpellier University hospital. In particular, bone marrow were collected from 206 patients treated with high dose Melphalan (HDM) and autologous stem cell transplantation (ASCT) (27) and this cohort is termed in the following Heidelberg-Montpellier (HM) cohort (Supplementary Table S1). The .CEL files and MAS5 files have been deposited in the ArrayExpress public database (E-MTAB-372). The structural chromosomal aberrations including t(4;14)(p16.3;q32.3) and t(11;14)(q13;q32.3), as well as numerical aberrations including 17p13 and 1q21 gain, were assayed by fluorescence in situ hybridization (iFISH)(28). We also used Affymetrix data of a cohort of 345 purified MMC from previously untreated patients from the University of Arkansas for Medical Sciences (UAMS, Little Rock, AR). The
patients were treated with total therapy 2 including HDM and ASCT (29) and termed in the following UAMS-TT2 cohort. These data are publicly available via the online Gene Expression Omnibus (Gene Expression Profile of Multiple Myeloma, accession number GSE2658). As iFISH data were not available for UAMS-TT2 patients, t(4;14) translocation was evaluated using MMSET spike expression(30) and del17p13 surrogated by TP53 probe set signal(31). After Ficoll-density gradient centrifugation, plasma cells were purified using anti-CD138 MACS microbeads (Miltenyi Biotech, Bergisch Gladbach, Germany).
Cell culture and treatment for gene expression profiling
The human MM cell lines (HMCLs) XG-5, XG-6, XG-7, XG-20 and LP1 were grown in RPMI 1640 supplemented with 10% fetal bovine serum. Two ng/ml recombinant IL-6 was added to IL-6 dependent HMCLs (XG-5, XG-6, XG-7 and XG-20). Cells (2 x 10⁵/mL) were treated without (control) or with 0.5 µmol/L 5-Aza-2’-deoxycytidine (decitabine, Sigma, St Louis, MO, Figure 1) for 7 days as described by Heller et
al(19). At day 3, half the culture medium without (control) or with 0.5 µmol/L decitabine was renewed. This decitabine concentration is the starting one inducing minor decrease in HMCL viability at day 7 of culture (Supplementary Table S2).
Growth assay for myeloma cells
HMCLs were cultured for 4 days in 96-well flat-bottom microtiter plates in RPMI 1640 medium, 10% FCS, 2 ng/ml IL-6 culture medium (control), with graded decitabine concentrations. Cell growth was evaluated by quantifying intracellular ATP amount with a Cell Titer Glo Luminescent Assay (Promega, Madison, WI) with a Centro LB 960 luminometer (Berthold Technologies, Bad Wildbad, Germany).
Mononuclear cell culture
Mononuclear cells from tumor samples of 12 patients with MM were cultured for 4 days at 2 x 10⁵ cells/ml in RPMI 1640 medium, 10% FCS, 2 ng/ml IL-6, with or without graded concentrations of decitabine. In each culture group, viability and cell counts were assayed and MMCs were stained with an anti-CD138-PE mAb (Immunotech, Marseille, France) as previously described(32).
Preparation of complementary RNA (cRNA) and microarray hybridization
RNA was extracted using the RNeasy Kit (Qiagen, Hilden, Germany) as previously described(33, 34). Biotinylated cRNA was amplified with a double in vitro transcription and hybridized to the human U133 2.0 plus GeneChips, according to the manufacturer’s instructions (Affymetrix, Santa Clara, CA). Fluorescence intensities were quantified and analyzed using the GECOS software (Affymetrix).
Gene expression profiling and statistical analyses
Gene expression data were normalized with the MAS5 algorithm and analyzed with our bioinformatics platforms – RAGE(35) and Amazonia(36) - or SAM (Significance Analysis of Microarrays) software(37). The statistical significance of differences in overall survival between groups of patients was calculated by the log-rank test. Multivariate analysis was performed using the Cox proportional hazards model. Survival curves were plotted using the Kaplan-Meier method. All these analyses have been done with R.2.10.1 and bioconductor version 2.5. Gene annotation and networks were generated through the use of Ingenuity Pathways Analysis (Ingenuity® Systems, Redwood City, CA)(38).
Results
Modulation of gene expression by decitabine in HMCLs: identification of prognostic genes
Five HMCLs were treated with 0.5 µM of decitabine for 7 days. This was the starting concentration yielding to 10% loss in myeloma cell viability, with the aim to avoid performing gene expression in apoptotic cells (Supplementary Table S2)(19). Using SAM supervised paired analysis, the expression of 48 genes was found to be significantly upregulated and that of 79 genes downregulated by decitabine treatment (FDR < 5%; Supplementary Table S3 and S4). Decitabine-regulated genes are significantly enriched in genes related to “Cancer” and “Cell death” pathways (FDR < 5%; Ingenuity pathway analysis, data not shown). Investigating the expression of these 127 decitabine-regulated genes in primary MMCs of a cohort of 206 newly-diagnosed patients (HM cohort), 22 genes had bad prognostic value and 25 a good one after Benjamini-Hochberg multiple testing correction (Supplementary Table S5). These genes are enriched in genes encoding for interferon signaling pathway (Supplementary Figure 1). The prognostic information of decitabine-regulated genes was gathered within an DNA methylation score (DM Score), which is the sum of the beta coefficients of the Cox model for each prognostic gene, weighted by ± 1 according to the patient MMC signal above or below the probe set maxstat value as previously described(38). The value of DM Score in normal, pre-malignant or malignant plasma cells is displayed in Figure 2A. DM Score was similar between normal BMPCs and pre-malignant plasma cells from MGUS patients. MMCs of patients had a significantly higher DM Score than normal BMPCs or plasma cells from MGUS-patients (P < .01), and HMCLs the highest score (P < .001) (Figure 2A). Investigating the DM Score in the 8 groups of the molecular classification of multiple
myeloma(39), DM Score was significantly higher in the proliferation, t(4;14) and MAF subgroups (P < .001) associated with a poor prognosis(39) and significantly lower in the low bone disease subgroup (P < .001)(39) (Figure 2B).
Prognostic value of DM score compared to usual prognostic factors
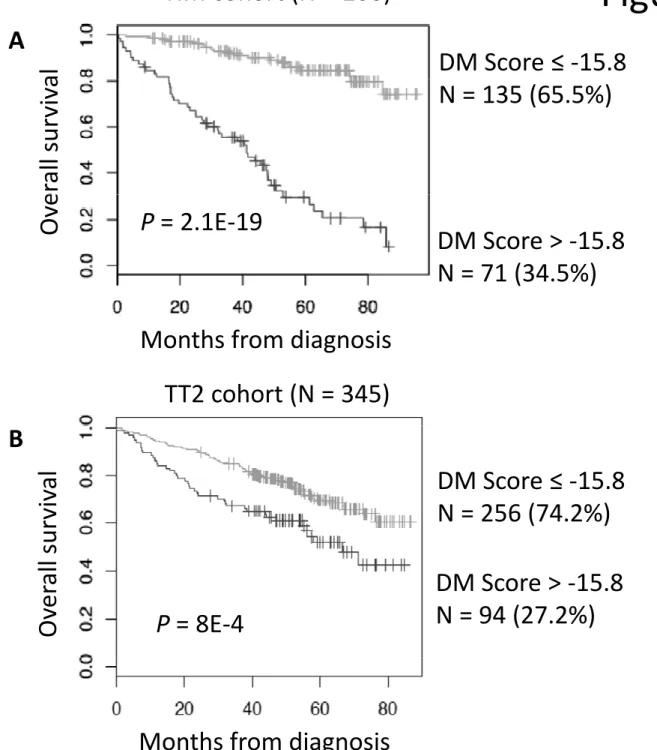
Using patients’ HM cohort, DM Score had prognostic value when used as a continuous variable (P ≤ 10-4, results not shown), or by splitting patients into two groups using Maxstat R function(38). A maximum difference in overall survival (OS) was obtained with DM Score = -15.8 splitting patients in a high-risk group of 34.5% patients (DM Score > - 15.8) with a 42.1 months median OS and a low risk group of 65.5% patients (DM Score ≤ -15.8) with not reached median survival (Figure 3). Using univariate Cox analysis, DM Score, UAMS-HRS, IFM-score and GPI had prognostic value as well as t(4;14), del17p, β2m, albumin and ISS (Supplementary Table S6). When compared two by two, DM Score tested with β2m remained significant. When these parameters were tested together, DM Score, β2m and t(4;14) kept prognostic value. DM Score was also prognostic for the UAMS-TT2 cohort of 345 patients treated with TT2 therapy(29). For each patient of UAMS-TT2 cohort, DM Score was computed using parameters defined with patients’ HM cohort only. The median OS of patients within high score group (DM Score > - 15.8) was 53.7 months and not reached for patients with low DM Score (P = .0008) (Figure 3). Using Cox univariate analysis, UAMS-HRS, IFM and GPI scores as well as t(4;14) and del17p had prognostic value. Comparing these prognostic factors two by two, DM Score remained significant compared to GPI, t(4;14), and del17p in the UAMS-TT2 cohort (Supplementary Table S6). When these parameters were tested together, UAMS-HRS, t(4;14) and del17p kept prognostic value.
DM Score is predictive for sensitivity of human myeloma cell lines or patients’ primary MMCs to Decitabine in vitro.
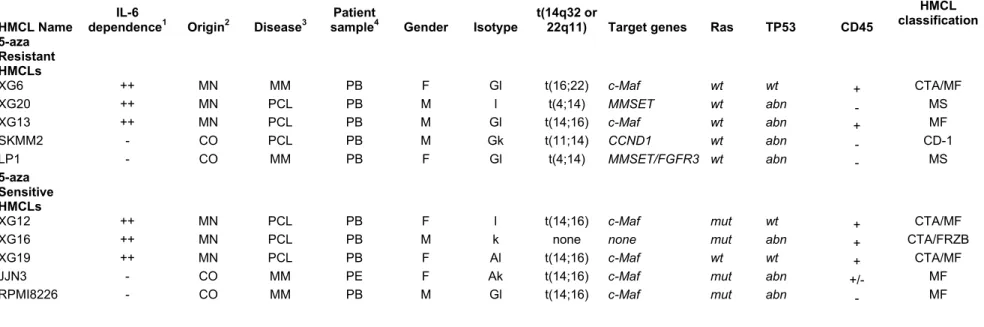
We sought to determine whether DM Score could predict for the sensitivity of 10 HMCLs to DNMT inhibitor. Starting from a large cohort of 40 HMCLs (22), the 10 HMCLs with the highest or lowest DM Score were selected to assay decitabine sensitivity. The 5 HMCLs with the highest DM Score exhibited a significant 11-fold higher decitabine sensitivity (median IC50 = 0.68 µM; range: 0.15 to 2.22 µM) than the 5 HMCLs with low DM Score (P = .01; median IC50 = 7.94 µM; range: 2.92 to 60.81 µM) (Figure 4). Four of the 5 HMCLs with the highest DM Score and higher decitabine sensitivity have ras mutations, contrary to the 5 HMCLs with the lowest DM Score and poorly sensitive, which have no ras mutations (Table 1).
In order to determine whether DM Score could predict for the sensitivity of primary MMCs to DNMT inhibitor, we used the maxstat cutoff (DM Score = -15.8) defined in Figure 3 to separate MM patients with high DM Score from patients with low DM Score. Primary MMCs from 12 patients were cultured together with their BM environment, recombinant IL-6 and graded concentrations of decitabine for 4 days. Primary MMCs of patients with a DM Score above maxstat cutoff (-15.8, Figure 2A) exhibited a significant (P < .01) 2.2-fold higher decitabine sensitivity than MMCs with DM Score below maxstat cutoff (Figure 5).
Discussion
In this study, we have identified a gene expression-based DNA methylation score (DM Score) which is predictive for patients’ survival and for the in vitro sensitivity of human myeloma cell lines or patients’ primary myeloma cells to decitabine, a DNMT inhibitor. Given the clinical development of DNMT inhibitors in patients with MM (8), it
is of major interest to investigate whether this DM Score could predict for patients’ response to these inhibitors. Besides a potential interest of DM Score in selecting patients who could benefit from DNMTi therapies, the current study highlights pathways which could be involved in the development of multiple myeloma cells. Heller at al. have identified several cancer related genes inactivated through methylation in 3 human myeloma cell lines(19). Among the 127 genes deregulated by decitabine treatment in our HMCL cohort, about one fifth (28 genes) was commonly identified by Heller et al. (Supplementary Tables S7 and S8), including in particular some IFN-regulated genes. Indeed, decitabine treatment induced overexpression of some genes, whose expression is regulated by IFN - OAS1, IFI27,
IFI35, G1P2, MX1 and STAT1 (Supplementary Figure 1). Zhan et al. identified an
overexpression of several interferon-induced genes found in that study, including
OAS2, IFI27, and IFI35, as a characteristic of patients with hyperdiploid MMCs(39,
40). This observation indicates that the expression of these genes is repressed by promoter methylation and suggests IFN could activate them, partly by inducing demethylation of CpG islands as shown recently for IFITM3 gene(41). The biological or clinical role of IFN in MM is controversial. Our group has shown IFN-α is a survival factor for MMCs and protect MMCs from dexamethasone-induced apoptosis(42), whereas other groups found it inhibited MM cell growth(43). IFN-α was used for several years as a maintenance therapy in patients with MM (44) but its use was stopped in reason of lack of reproducible clinical efficacy(45, 46). It could be of interest to investigate whether IFN could control the methylation of some genes in MMCs.
All HMCLs but one with the highest DM Score and higher decitabine sensitivity have ras mutations, contrary to the 5 HMCLs with the lowest DM Score and poorly
sensitive, which have no ras mutations (Table 1). The prevalence of activating mutations of K- and N-Ras in MM ranges is approximately 15% each in newly-diagnosed MM (47, 48) and is independent of clinical stage (49, 50). But the prevalence of RAS mutations increases with disease progression, in association with shorter survival(47, 48, 50), suggesting decitabine could be useful to treat these patients.
RECQ1 (ATP-dependent DNA helicase Q1) and KIF21B (kinesin family member
21B) are 2 of the 22 genes downregulated by decitabine treatment and associated with a poor prognosis. RECQ helicases constitute a ubiquitous family of DNA unwinding enzymes involved in the maintenance of chromosome stability(51-53). Mutations in the RECQ genes are linked with genetic disorders associated with genomic instability, cancer predisposition and features of premature ageing(52). Consistent with their ability to unwind DNA, several functions have been attributed to RECQ proteins, including roles in stabilization and repair of damaged DNA replication forks, telomere maintenance, homologous recombination, and DNA damage checkpoint signaling(51-53). Recent reports supported a role for RECQ1 in oncogenesis(54-56). RECQ1 silencing in cancer cells resulted in mitotic catastrophe and injection of siRNA targeting RECQ1 prevented tumor growth in murine models(54-56). More recently, it was demonstrated that RECQ1 is highly expressed in various types of solid tumors including colon carcinoma, thyroid cancer, lung cancer and brain glioblastoma tissues(57). In glioblastoma cell lines, depletion of RECQ1 by RNAi results in a significant reduction of cellular proliferation, perturbation of S-phase progression, spontaneous γ-H2AX foci formation and hypersensitivity to hydroxyurea and temozolomide treatments(57). KIF21B is a kinesin family member. Kinesins are a conserved class of microtubule-dependent molecular motor proteins
that have adenosine triphosphatase activity and motion characteristics(58). Kinesins support several cellular functions, such as mitosis, meiosis and the transport of macromolecules. In mitosis of eukaryotic cells, kinesins participate in spindle formation, chromosome congression and alignment, and cytokinesis(59). Abnormal expression and function of kinesins are involved in the development or progression of several kinds of human cancers(60, 61). Interestingly, KIF21B maps to chromosome 1q arm (1q32.1), whose is amplified in MMCs of patients with high-risk MM (62). More recently, KIF21B gene was found in a critical neighbor-gene model associated with a poor prognosis across independent data sets of respectively, 559, 247 and 264 patients with MM(63). These data suggest that decitabine treatment could synergize with DNA-damaging agents, targeting genes involved in DNA-repair and maintenance of chromosome stability in MMCs. In conclusion, we reported here the identification of genes regulated by a DNMT inhibitor in multiple myeloma cells and predictive for patients’ survival, whose information could be summed within a single DNA methylation score. This finding could help to better organize treatments with DNMTi inhibitors in patients with MM, to highlight proteins involved in multiple myeloma oncogenesis, and could be extended to other cancers.
Author contributions:
MJ performed research, bioinformatic studies, and participated in the writing of the paper.
HD, and GH collected bone marrow samples and clinical data and participated in the writing of the paper.
RT and VJL participated in the bioinformatic studies and participated in the writing of the paper.
LW and RG provided with technical assistance.
References
1. Hahn WC, Weinberg RA. Rules for making human tumor cells. N Engl J Med. 2002;347:1593-603.
2. Vogelstein B, Kinzler KW. Cancer genes and the pathways they control. Nat Med. 2004;10:789-99.
3. Baylin SB. DNA methylation and gene silencing in cancer. Nat Clin Pract Oncol. 2005;2 Suppl 1:S4-11.
4. Kondo Y. Epigenetic cross-talk between DNA methylation and histone modifications in human cancers. Yonsei Med J. 2009;50:455-63.
5. Issa JP. DNA methylation as a therapeutic target in cancer. Clin Cancer Res. 2007;13:1634-7.
6. Issa JP, Garcia-Manero G, Giles FJ, Mannari R, Thomas D, Faderl S, et al. Phase 1 study of low-dose prolonged exposure schedules of the hypomethylating agent 5-aza-2'-deoxycytidine (decitabine) in hematopoietic malignancies. Blood. 2004;103:1635-40.
7. Oki Y, Jelinek J, Shen L, Kantarjian HM, Issa JP. Induction of hypomethylation and molecular response after decitabine therapy in patients with chronic myelomonocytic leukemia. Blood. 2008;111:2382-4.
8. Smith EM, Boyd K, Davies FE. The potential role of epigenetic therapy in multiple myeloma. Br J Haematol. 2009.
9. Bergsagel PL, Kuehl WM. Molecular pathogenesis and a consequent classification of multiple myeloma. J Clin Oncol. 2005;23:6333-8.
10. Hideshima T, Bergsagel PL, Kuehl WM, Anderson KC. Advances in biology of multiple myeloma: clinical applications. Blood. 2004;104:607-18.
11. Chen G, Wang Y, Huang H, Lin F, Wu D, Sun A, et al. Combination of DNA methylation inhibitor 5-azacytidine and arsenic trioxide has synergistic activity in myeloma. Eur J Haematol. 2009;82:176-83.
12. de Carvalho F, Colleoni GW, Almeida MS, Carvalho AL, Vettore AL. TGFbetaR2 aberrant methylation is a potential prognostic marker and therapeutic target in multiple myeloma. Int J Cancer. 2009;125:1985-91.
13. Galm O, Yoshikawa H, Esteller M, Osieka R, Herman JG. SOCS-1, a negative regulator of cytokine signaling, is frequently silenced by methylation in multiple myeloma. Blood. 2003;101:2784-8.
14. Hatzimichael E, Dranitsaris G, Dasoula A, Benetatos L, Stebbing J, Crook T, et al. Von Hippel-Lindau methylation status in patients with multiple myeloma: a potential predictive factor for the development of bone disease. Clinical lymphoma & myeloma. 2009;9:239-42.
15. Hodge DR, Peng B, Cherry JC, Hurt EM, Fox SD, Kelley JA, et al. Interleukin 6 supports the maintenance of p53 tumor suppressor gene promoter methylation. Cancer Res. 2005;65:4673-82.
16. Ng MH, Chung YF, Lo KW, Wickham NW, Lee JC, Huang DP. Frequent hypermethylation of p16 and p15 genes in multiple myeloma. Blood. 1997;89:2500-6. 17. Seidl S, Ackermann J, Kaufmann H, Keck A, Nosslinger T, Zielinski CC, et al. DNA-methylation analysis identifies the E-cadherin gene as a potential marker of disease progression in patients with monoclonal gammopathies. Cancer. 2004;100:2598-606.
18. Tshuikina M, Jernberg-Wiklund H, Nilsson K, Oberg F. Epigenetic silencing of the interferon regulatory factor ICSBP/IRF8 in human multiple myeloma. Exp Hematol. 2008;36:1673-81.
19. Heller G, Schmidt WM, Ziegler B, Holzer S, Mullauer L, Bilban M, et al. Genome-wide transcriptional response to 5-aza-2'-deoxycytidine and trichostatin a in multiple myeloma cells. Cancer Res. 2008;68:44-54.
20. Wilop S, van Gemmeren TB, Lentjes MH, van Engeland M, Herman JG, Brummendorf TH, et al. Methylation-associated dysregulation of the suppressor of cytokine signaling-3 gene in multiple myeloma. Epigenetics. 2011;6:1047-52.
21. Walker BA, Wardell CP, Chiecchio L, Smith EM, Boyd KD, Neri A, et al. Aberrant global methylation patterns affect the molecular pathogenesis and prognosis of multiple myeloma. Blood. 2010.
22. Moreaux J, Klein B, Bataille R, Descamps G, Maiga S, Hose D, et al. A high-risk signature for patients with multiple myeloma established from the molecular classification of human myeloma cell lines. Haematologica. 2011;96:574-82.
23. Zhang XG, Gaillard JP, Robillard N, Lu ZY, Gu ZJ, Jourdan M, et al. Reproducible obtaining of human myeloma cell lines as a model for tumor stem cell study in human multiple myeloma. Blood. 1994;83:3654-63.
24. Rebouissou C, Wijdenes J, Autissier P, Tarte K, Costes V, Liautard J, et al. A gp130 interleukin-6 transducer-dependent SCID model of human multiple myeloma. Blood. 1998;91:4727-37.
25. Tarte K, Zhang XG, Legouffe E, Hertog C, Mehtali M, Rossi JF, et al. Induced expression of B7-1 on myeloma cells following retroviral gene transfer results in tumor-specific recognition by cytotoxic T cells. J Immunol. 1999;163:514-24.
26. Gu ZJ, Vos JD, Rebouissou C, Jourdan M, Zhang XG, Rossi JF, et al. Agonist anti-gp130 transducer monoclonal antibodies are human myeloma cell survival and growth factors. Leukemia. 2000;14:188-97.
27. Goldschmidt H, Sonneveld P, Cremer FW, van der Holt B, Westveer P, Breitkreutz I, et al. Joint HOVON-50/GMMG-HD3 randomized trial on the effect of thalidomide as part of a high-dose therapy regimen and as maintenance treatment for newly diagnosed myeloma patients. Ann Hematol. 2003;82:654-9.
28. Cremer FW, Bila J, Buck I, Kartal M, Hose D, Ittrich C, et al. Delineation of distinct subgroups of multiple myeloma and a model for clonal evolution based on interphase cytogenetics. Genes Chromosomes Cancer. 2005;44:194-203.
29. Barlogie B, Tricot G, Rasmussen E, Anaissie E, van Rhee F, Zangari M, et al. Total therapy 2 without thalidomide in comparison with total therapy 1: role of intensified induction and posttransplantation consolidation therapies. Blood. 2006;107:2633-8.
30. Sprynski AC, Hose D, Caillot L, Reme T, Shaughnessy JD, Jr., Barlogie B, et al. The role of IGF-1 as a major growth factor for myeloma cell lines and the prognostic relevance of the expression of its receptor. Blood. 2009;113:4614-26. 31. Xiong W, Wu X, Starnes S, Johnson SK, Haessler J, Wang S, et al. An analysis of the clinical and biologic significance of TP53 loss and the identification of potential novel transcriptional targets of TP53 in multiple myeloma. Blood. 2008;112:4235-46.
32. Mahtouk K, Jourdan M, De Vos J, Hertogh C, Fiol G, Jourdan E, et al. An inhibitor of the EGF receptor family blocks myeloma cell growth factor activity of HB-EGF and potentiates dexamethasone or anti-IL-6 antibody-induced apoptosis. Blood. 2004;103:1829-37.
33. Hose D, Reme T, Meissner T, Moreaux J, Seckinger A, Lewis J, et al. Inhibition of aurora kinases for tailored risk-adapted treatment of multiple myeloma. Blood. 2009;113:4331-40.
34. Moreaux J, Cremer FW, Reme T, Raab M, Mahtouk K, Kaukel P, et al. The level of TACI gene expression in myeloma cells is associated with a signature of microenvironment dependence versus a plasmablastic signature. Blood. 2005;106:1021-30.
35. Reme T, Hose D, De Vos J, Vassal A, Poulain PO, Pantesco V, et al. A new method for class prediction based on signed-rank algorithms applied to Affymetrix microarray experiments. BMC bioinformatics. 2008;9:16.
36. Tanguy Le Carrour SA, Sylvie Tondeur, Ludovic Lhermitte, Ned Lamb, Thierry Reme, Veronique Pantesco, Samir Hamamah, Bernard Klein, John De Vos. Amazonia!: An Online Resource to Google and Visualize Public Human whole Genome Expression Data. The Open Bioinformatics Journal. 2010;4:5-10.
37. Cui X, Churchill GA. Statistical tests for differential expression in cDNA microarray experiments. Genome Biol. 2003;4:210.
38. Kassambara A, Hose D, Moreaux J, Walker BA, Protopopov A, Reme T, et al. Genes with a spike expression are clustered in chromosome (sub)bands and spike (sub)bands have a powerful prognostic value in patients with multiple myeloma. Haematologica. 2011.
39. Zhan F, Huang Y, Colla S, Stewart JP, Hanamura I, Gupta S, et al. The molecular classification of multiple myeloma. Blood. 2006;108:2020-8.
40. Zhou Y, Barlogie B, Shaughnessy JD, Jr. The molecular characterization and clinical management of multiple myeloma in the post-genome era. Leukemia. 2009;23:1941-56.
41. Scott R, Siegrist F, Foser S, Certa U. Interferon-alpha induces reversible DNA demethylation of the interferon-induced transmembrane protein-3 core promoter in human melanoma cells. J Interferon Cytokine Res. 2011;31:601-8.
42. Ferlin-Bezombes M, Jourdan M, Liautard J, Brochier J, Rossi JF, Klein B. IFN-alpha is a survival factor for human myeloma cells and reduces dexamethasone-induced apoptosis. J Immunol. 1998;161:2692-9.
43. Arora T, Jelinek DF. Differential myeloma cell responsiveness to interferon-alpha correlates with differential induction of p19(INK4d) and cyclin D2 expression. J Biol Chem. 1998;273:11799-805.
44. Mandelli F, Avvisati G, Amadori S, Boccadoro M, Gernone A, Lauta VM, et al. Maintenance treatment with recombinant interferon alfa-2b in patients with multiple myeloma responding to conventional induction chemotherapy. N Engl J Med. 1990;322:1430-4.
45. Barlogie B, Kyle RA, Anderson KC, Greipp PR, Lazarus HM, Hurd DD, et al. Standard chemotherapy compared with high-dose chemoradiotherapy for multiple myeloma: final results of phase III US Intergroup Trial S9321. J Clin Oncol. 2006;24:929-36.
46. Cunningham D, Powles R, Malpas J, Raje N, Milan S, Viner C, et al. A randomized trial of maintenance interferon following high-dose chemotherapy in multiple myeloma: long-term follow-up results. Br J Haematol. 1998;102:495-502. 47. Chng WJ, Gonzalez-Paz N, Price-Troska T, Jacobus S, Rajkumar SV, Oken MM, et al. Clinical and biological significance of RAS mutations in multiple myeloma. Leukemia. 2008;22:2280-4.
48. Steinbrunn T, Stuhmer T, Gattenlohner S, Rosenwald A, Mottok A, Unzicker C, et al. Mutated RAS and constitutively activated Akt delineate distinct oncogenic pathways, which independently contribute to multiple myeloma cell survival. Blood. 2011;117:1998-2004.
49. Rasmussen T, Kuehl M, Lodahl M, Johnsen HE, Dahl IM. Possible roles for activating RAS mutations in the MGUS to MM transition and in the intramedullary to extramedullary transition in some plasma cell tumors. Blood. 2005;105:317-23.
50. Liu P, Leong T, Quam L, Billadeau D, Kay NE, Greipp P, et al. Activating mutations of N- and K-ras in multiple myeloma show different clinical associations: analysis of the Eastern Cooperative Oncology Group Phase III Trial. Blood. 1996;88:2699-706.
51. Chu WK, Hickson ID. RecQ helicases: multifunctional genome caretakers. Nat Rev Cancer. 2009;9:644-54.
52. Harrigan JA, Bohr VA. Human diseases deficient in RecQ helicases. Biochimie. 2003;85:1185-93.
53. Hickson ID. RecQ helicases: caretakers of the genome. Nat Rev Cancer. 2003;3:169-78.
54. Arai A, Chano T, Futami K, Furuichi Y, Ikebuchi K, Inui T, et al. RECQL1 and WRN proteins are potential therapeutic targets in head and neck squamous cell carcinoma. Cancer Res. 2011;71:4598-607.
55. Futami K, Kumagai E, Makino H, Goto H, Takagi M, Shimamoto A, et al. Induction of mitotic cell death in cancer cells by small interference RNA suppressing the expression of RecQL1 helicase. Cancer Sci. 2008;99:71-80.
56. Futami K, Kumagai E, Makino H, Sato A, Takagi M, Shimamoto A, et al. Anticancer activity of RecQL1 helicase siRNA in mouse xenograft models. Cancer Sci. 2008;99:1227-36.
57. Mendoza-Maldonado R, Faoro V, Bajpai S, Berti M, Odreman F, Vindigni M, et al. The human RECQ1 helicase is highly expressed in glioblastoma and plays an important role in tumor cell proliferation. Mol Cancer. 2011;10:83.
58. Miki H, Okada Y, Hirokawa N. Analysis of the kinesin superfamily: insights into structure and function. Trends Cell Biol. 2005;15:467-76.
59. Hirokawa N. Kinesin and dynein superfamily proteins and the mechanism of organelle transport. Science. 1998;279:519-26.
60. Yu Y, Feng YM. The role of kinesin family proteins in tumorigenesis and progression: potential biomarkers and molecular targets for cancer therapy. Cancer. 2010;116:5150-60.
61. Zhu C, Zhao J, Bibikova M, Leverson JD, Bossy-Wetzel E, Fan JB, et al. Functional analysis of human microtubule-based motor proteins, the kinesins and dyneins, in mitosis/cytokinesis using RNA interference. Mol Biol Cell. 2005;16:3187-99.
62. Avet-Loiseau H, Li C, Magrangeas F, Gouraud W, Charbonnel C, Harousseau JL, et al. Prognostic significance of copy-number alterations in multiple myeloma. J Clin Oncol. 2009;27:4585-90.
63. Agnelli L, Forcato M, Ferrari F, Tuana G, Todoerti K, Walker BA, et al. The reconstruction of transcriptional networks reveals critical genes with implications for clinical outcome of multiple myeloma. Clin Cancer Res. 2011;17:7402-12.
HMCL Name
IL-6
dependence1 Origin2 Disease3
Patient
sample4 Gender Isotype
t(14q32 or
22q11) Target genes Ras TP53 CD45
HMCL classification 5-aza Resistant HMCLs XG6 ++ MN MM PB F Gl t(16;22) c-Maf wt wt + CTA/MF XG20 ++ MN PCL PB M l t(4;14) MMSET wt abn - MS XG13 ++ MN PCL PB M Gl t(14;16) c-Maf wt abn + MF SKMM2 - CO PCL PB M Gk t(11;14) CCND1 wt abn - CD-1 LP1 - CO MM PB F Gl t(4;14) MMSET/FGFR3 wt abn - MS 5-aza Sensitive HMCLs
XG12 ++ MN PCL PB F l t(14;16) c-Maf mut wt + CTA/MF XG16 ++ MN PCL PB M k none none mut abn + CTA/FRZB XG19 ++ MN PCL PB F Al t(14;16) c-Maf wt wt + CTA/MF JJN3 - CO MM PE F Ak t(14;16) c-Maf mut abn +/- MF RPMI8226 - CO MM PB M Gl t(14;16) c-Maf mut abn - MF
Table 1. Characteristics of HMCLs5-aza sensitive and HMCLs5-aza resistant
1
++ if growth is strictly dependent on adding exogenous IL-6, + if dependent on adding exogenous IL-6, - if not; 2Origin of the HMCL, MN Montpellier or Nantes, CO collected; 3Disease at diagnosis: MM multiple myeloma, PCL plasma cell leukemia, PCT plasmacytoma; 4Origin of the sample: AF ascitic fluid, BM bone marrow, PE pleural effusion, PB peripheral blood.
Figure legends:
Figure 1: Decitabine structure.
Figure 2: DNA methylation Score in normal and malignant plasma cells
(A). DNA methylation Score in normal bone marrow plasma cells (7 donors), in premalignant plasma cells of 5 patients with monoclonal gammopathy of undetermined significance (MGUS), in multiple myeloma cells of 206 patients with intramedullary MM (HM cohort) and in 40 human myeloma cell lines. ** Indicate that the score value is significantly different with a P value at least < .01. (B). The DM Score was computed for MMCs of patients belonging to the 8 groups of the UAMS molecular classification of multiple myeloma, using UAMS-TT2 cohort. PR: proliferation, LB: low bone disease, MS: MMSET, HY: hyperdiploid, CD1: Cyclin D1, CD2: Cyclin D2, MF: MAF, MY: myeloid. * Indicate that the score value is significantly higher in the group compared to all the patients of the cohort (P < .05). ** Indicate that the score value is significantly lower in the group compared to all the patients of the cohort (P < .05).
Figure 3: Prognostic value of DM Score in multiple myeloma.
(A). Patients of HM cohort were ranked according to increased DM Score and a maximum difference in OS was obtained with DM Score = -15.8 optimally splitting patients in a high risk (34.5%) and low risk (65.5%) groups. (B). The prognostic value of DM Score was tested on an independent UAMS-TT2 cohort of 345 patients from treated with TT2 therapy. The parameters to compute DM Score for patients of UAMS-TT2 cohort and the DM Score cut-off delineating the 2 prognostic groups were those defined with HM cohort only.
Figure 4: DM Score predicts for sensitivity of human myeloma cell lines to decitabine.
HMCLs with high DM Score (N = 5) exhibit significant higher decitabine sensitivity compared to HMCLs with low DM Score (N = 5). HMCLs were cultured for 4 days in 96-well flat-bottom microtiter plates in RPMI 1640 medium, 10% FCS, 2 ng/ml IL-6 culture medium (control), and graded decitabine concentrations. Data are mean values ± standard deviation (SD) of 5 independent experiments.
Figure 5: DM Score predicts for decitabine sensitivity of primary myeloma cells of patients.
Mononuclear cells from tumor samples of 12 patients with MM were cultured for 4 days in the presence of IL-6 (2 ng/ml) with or without graded decitabine concentrations. At day 4 of culture, the cell count and the viability were determined and the percentage of CD138+ viable plasma cells was determined by flow cytometry. Black color represents patients with high DM Score (N = 6; DM Score > -15.8) and white represents patients with low DM Score values (N = 6; DM Score ≤ 15.8).