HAL Id: tel-03259844
https://tel.archives-ouvertes.fr/tel-03259844
Submitted on 14 Jun 2021
HAL is a multi-disciplinary open access
archive for the deposit and dissemination of sci-entific research documents, whether they are pub-lished or not. The documents may come from teaching and research institutions in France or abroad, or from public or private research centers.
L’archive ouverte pluridisciplinaire HAL, est destinée au dépôt et à la diffusion de documents scientifiques de niveau recherche, publiés ou non, émanant des établissements d’enseignement et de recherche français ou étrangers, des laboratoires publics ou privés.
Essays on foreign aid and governance
Ana Mie Horigoshi Reis
To cite this version:
Ana Mie Horigoshi Reis. Essays on foreign aid and governance. Economics and Finance. Université Paris sciences et lettres, 2020. English. �NNT : 2020UPSLD022�. �tel-03259844�
Préparée à l’Université Paris-Dauphine
Essays on foreign aid and governance
Soutenue par
Ana Mie HORIGOSHI
REIS
Le 8 decémbre 2020
Ecole doctorale n° ED 543
Ecole doctorale SDOSE
Spécialité
Sciences Économiques
Composition du jury :
Mme. Lisa, CHAUVET
Professor, Université Paris 1 - Sorbonne Directrice de thèse
M. Shanta, DEVARAJAN
Professor, Georgetown University Président
M. Andreas, FUCHS
Professor, University of Göettingen Rapporteur
Mme. Mathilde, MAUREL Directrice de Recherche,
Paris Sciences & Lettres
PH.D THESIS
Submitted for the degree of Doctor of Philosophy in Economics
Prepared at Universit´e Paris Dauphine and IRD-DIAL and defended at Universit´e Paris Dauphine on Dec. 8, 2020
by
Ana Mie HORIGOSHI REIS
Essays on foreign aid and governance
Thesis advisor: Lisa CHAUVET
Jury:
President : Shanta DEVARAJAN Georgetown University Reviewers: Andreas FUCHS University of G¨oettingen
Acknowledgements
I am deeply grateful to my supervisor, Lisa Chauvet, for her incredibly helpful guidance and endless support throughout my PhD. Lisa encouraged me to apply when I was hesitant whether that was the right choice and maintained her confidence in me throughout this journey, particularly when I doubted myself. I would like to express my sincere gratitude to Andreas Fuchs and Mathilde Maurel, who agreed to be my referees. My thanks also go to Shanta Deverajan for agreeing to participate on my thesis jury.
I am also indebted to my co-authors Miguel Nin˜o-Zaraz`ua and Rachel Gilssenquist, for giving me the opportunity to participate on the UNU-WIDER project that culminated in one of the papers in this thesis. Their guidance and support was also crucial.
I thank all my colleagues at Dial for the support. I won’t name everyone as I would inevitably forget someone, but special thanks go to my office-mates (which changed a bit over the years): Marin, Bj¨orn, Thomas, Siyavash, Quynh, Tijan, Santiago, Yvan, and Antoine. I also thank L¨oic, Anne and Danielle for all the help with multiple the administrative issues, particularly organizing conference trips. The friendly work environment at Dial was an essential part of my years there, and the coffee breaks, occasional drinks, and end of the year parties were the best of it. Special thanks to Michelle for being a great conference companion and often my work buddy for weekends in the office.
I would also like to thank my friends outside the office, who helped me through the years. To my dear friends Makbule and Walter, thanks for the immense support, even from afar. You were kind and patient with the many crises throughout the course of my PhD and were great hosts in Brussels and Zurich on multiple occasions. To Liana, thanks for always receiving me at your house with a glass of wine to listen to my sorrows, and also for occasionally letting me borrow Lola for sessions of much needed dog therapy.
I also thank Vincent Fertey and Marine Larinay for the opportunity to teach at Sciences Po in Le Havre and Reims, and Charles Oman for taking me as the teaching assistant for his course.
who were very supportive from the beginning to the end; my brother, Pedro, who provided immense support from miles away; and my husband, Tyler, who was endlessly patient, unwaveringly confident, and tirelessly supportive. I am certain could not have finished this journey without you.
Contents
General Introduction 1
Chapter 1: Aid, administrative unit creation, and elections: Evidence
from Uganda 9
Chapter 2: Can aid reduce corruption?: Evidence from World Bank aid
and firm-level corruption 37
Chapter 3: Effects of international democracy support 70
References 131
List of Figures 141
List of Tables 141
General Introduction
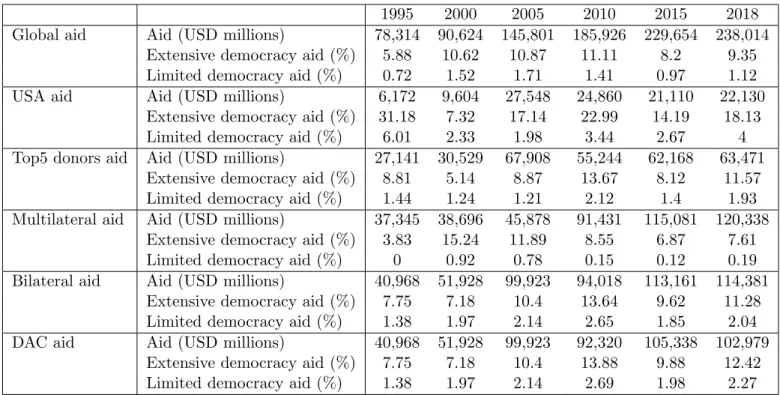
Consistent global economic growth over time has raised living standards and lifted people out of poverty at an incredible rate. From 1990 to 2015 the portion of the world’s population living in extreme poverty was reduced from nearly 36 percent to about 10 percent, according to World Bank (2018). This is impressive progress, however, that still translated to 736 million living in extreme poverty in 2015. Moreover, while the previous trend on poverty reduction was very encouraging, the Covid-19 pandemic is expected to result in economic contractions worldwide. Mahler et al. (2020) predicts this unprecedented event will push between 71 and 100 million people into extreme poverty in the baseline or downside scenarios, respectively. This would be the first increase in extreme poverty since 1990 and, depending on the poverty line used, would mean a reversal of approximately a decade’s worth of gains (Sumner et al.,2020). Therefore, raising living standards for the poorest of the poor remains a pressing challenge in today’s world.
A large part of this challenge is how to finance it, given the high costs of development1.
Despite the increase in private financial flows, official developmental aid (ODA)2 remains
a useful instrument to support developing countries. The large majority of these aid flows come from the Organization for Economic Co-operation and Development (OECD) members. With limited public resources and the considerable challenges present in developing countries, the effectiveness of aid is a matter of great interest from both the general public and academia.
1This is not a consensual perspective, however. It is most notably contested byEasterly(2003,2006) 2The OECD defines ODA as flows to countries and territories on the Development Assistance
Committe’s (DAC) list of ODA recipients and to multilateral institutions which are: (i) provided by official agencies, including state and local governments, or by their executive agencies; and (ii) each transaction is administered with the promotion of the economic development and the welfare of developing countries as its main objective and is concessional in character and conveys a grant of a minimum percentage, depending on whether its bilateral or multilateral, and on the recipient’s income classification.
Following a surge in international development cooperation during the 1960’s (OECD, 2020), interest in aid effectiveness was driven by the recognition that aid to governments that would implement ineffective policies was wasteful (Kaufmann, 2009). The commitment to aid effectiveness can be seen on the Aid Effectiveness High Level Forum (HLF) process initiated in Rome in 2003, followed by the Paris Declaration in 2005, Accra in 2008, and Busan in 2011.
The existing literature initially focused exclusively on the link between foreign aid and economic growth, but has since evolved. The debate, which originally centered on a macro perspective, widened to include a more micro approach in order to reach a clearer picture. Furthermore, the notion of aid effectiveness has expanded, with researchers investigating the effects of aid not only on growth, but also on sectoral outcomes (education, health, agriculture), or on institutions, by examining various dimension of governance issues.
This thesis consists of three essays on the impacts of foreign aid on governance, covering issues related to elections, corruption, and democracy. Below I provide the motivation to focus on these three dimensions, identify the literature gaps, and finally summarize the chapters.
Motivation
According to United Nations (2012)’s definition of governance, “governance refers to the exercise of political and administrative authority at all levels to manage a country’s affairs. It comprises the mechanisms, processes and institutions, through which citizens and groups articulate their interests, exercise their legal rights, meet their obligations and mediate their differences”. While this is only one of many definitions of governance, it fits the conceptualization of governance at the core of this thesis. Moreover, while there is no consensus on the definition of governance, the disagreements are largely overstated as “most definitions appropriately emphasize the importance of a capable state accountable to its citizens and operating under the rule of law” (Kaufmann and Kraay, 2007).
donors, and aid recipients, that governance is important for development (Kaufmann
and Kraay, 2007). Furthermore, the existing research suggests a rather large impact of
governance on development. For example, Kaufmann (2005) claims that countries can derive a large “development dividend” from better governance, estimating that a country that improves its governance from a relatively low level to an average level could almost triple the income per capita of its population in the long term. Kaufmann et al. (2000) find that “a reduction in corruption from the very high level prevalent in Indonesia to the lower level in Korea leads to between a two and fourfold increase in per capita incomes, a decline in infant mortality of similar magnitude, and an improvement of 15-25 percentage points in literacy levels.” The magnitude of this effect elucidates how necessary good governance is for development.
In this thesis I look into the following aspects of governance: elections, corruption, and democratic government.
Elections are a defining feature of a democracy, but regular fair and clean elections are not always observed, particularly in countries that were in the ‘third wave of democratization’ during the 1980’s and 1990’s when many countries transitioned to electoral democracies (UNDP, 2009). Elections without the legitimacy of the wider institutional context do not result in the expected democratic participation that would support equitable and sustainable development.
Kofi Annan has characterized corruption as “an insidious plague that has a wide range of corrosive effects on societies. It undermines democracy and the rule of law, hampers the provision of public services and the poor’s access to them, leads to violations of human rights, distorts markets, erodes the quality of life and allows organized crime, terrorism and other threats to human security to flourish”.3 Given the plentiful evidence of how
damaging it can be to development, it is essential to understand how to effectively curb it.
Finally, a broader aspect of governance, democracy, will be explored in this thesis. While there is an ongoing debate regarding the impact of aid on democratic outcomes, democracy in itself is a generally recognized as a highly desirable outcome. For this reason
3Kofi Annan, former United Nations Secretary-General, in his foreword to the UN Convention against
it is critical to understand how democracy interacts with aid.
By what means could aid impact these governance aspects? First, there may be direct effects, such as by having a governance issue as the direct target of an intervention. Additionally, there could be indirect “side-effects” which may or may not be desirable. With respect to corruption, there would be the direct effects of anti-corruption measures, which have the explicit objective of combating corruption, as well as the potential indirect effects from changes in social norms, procurement practices within a project, or simply the income effect from aid as a windfall resource. Regarding elections and democracy, there are the direct effects of aid targeting democratic underpinnings such as elections, freedom of media, and civil society organizations, as well as the inadvertent effects of both developmental aid and aid to those specific activities in the democratic outcomes.
Given the importance of aid as a financing mechanism for development and of governance as a magnifier of development, understanding the connection between aid and governance is critical to supporting development efforts worldwide and alleviating global poverty.
Literature gaps
While the literature on foreign aid and governance has examined many of the key issues in the past decades, there are still unanswered questions regarding the impacts of aid in governance. The increased availability of sub-nationally allocated or project-level aid data in recent years has expanded the opportunity to address these topics.
Foreign aid has been shown to have potentially positive or negative effects on corruption (See e.g. Knack (1999); Tavares (2003)). Knack (1999) first shows empirical evidence of the potential undesirable effect of aid, finding that higher aid levels erode bureaucratic quality, corruption, and rule of law. Okada and Samreth (2012) argues that foreign aid generally lessens corruption, particularly in large countries with low levels of corruption, while Asongu (2012) finds evidence that those results do not hold for Africa, and in that continent aid fuels corruption.
circumstances, promotes democratic pillars (Finkel et al., 2007; Carnegie and Marinov,
2017). However others have found a null or even negative effect (Ahmed, 2012; Knack,
2004).
Moreover, the existing literature largely focuses on the country-level analysis, which limits the potential findings, as it does not capture within-country variations. Within-country variations are highly relevant from a political economy perspective of favoritism.
As Hodler and Raschky (2014) shows, sub-national regions have more intense nighttime
light—a proxy for economic development—when being the birth region of the current political leader. Furthermore, Dreher et al. (2019) find that Chinese foreign aid is susceptible to political capture in the recipient countries, being more likely to be allocated at the birth region of the political leaders.
The relative lack of sub-national evidence—which is growing but still trails behind the decades of country-level research—might be at least part of the reason behind the predominance of the macro paradox observed on aid effectiveness. The micro-macro paradox refers to the inconsistency in observed effects of aid at the micro and macro levels. It is common to find positive effects of foreign aid at the project-levels, however researchers have had difficultly finding the same evidence with aggregated levels of foreign aid.
Furthermore, when looking into intermediary outcomes, rather than simply economic growth, there is a need for more research on the impacts of foreign aid in specific governance aspects. While the matter of aid and corruption has already been investigated, there are still unexplored aspects. Moreover, there are other equally important aspects of governance that have received much less attention such as elections and democratic outcomes.
Recent literature has embraced the use of geo-localized data, which has greatly increased the possibilities for research (BenYishay, 2017). Parks and Strange (2019) provides an overview of this movement on the matter of democracy and aid.
In this thesis I aim to contribute to these gaps using sub-national data to improve the understanding of the mechanisms linking aid and governance, and, from an econometric point of view, I aim to strengthen the identification strategy with the use of various levels
of fixed effects.
Chapter Summaries
This thesis is comprised of three essays on foreign aid and governance across the world. These chapters can be considered individually; however, jointly they provide a broader view of how foreign aid can have implications to different aspects of governance and in different levels, such as the country-level, sub-national-level or firm-level.
Each paper takes a novel approach in order to overcome limitations found in previous literature and contribute to a better understanding of the implications of foreign aid on different governance aspects.
The first chapter investigates the potential impact of foreign aid in elections. The second chapter examines whether foreign aid may have an impact on firm-level corruption in recipient countries. The third chapter explores the relationship between democracy aid and democratic outcomes. The remainder of this introduction provides a summary of each chapter.
Chapter 1, co-written with Lisa Chauvet (Universit´e Paris 1 - Panth´eon Sorbonne) deals with the question of how aid can affect electoral outcomes. Focusing on the impact of local aid in Uganda, we aim to contribute to a better understanding of how semi-democracies or semi-autocracies work, and particularly how these regimes interact with aid. Furthermore, looking into the potential mechanism of administrative unit creation we contribute to a better understating of this phenomenon, which was very noticeable in Uganda in 1990’s and 2000’s and also observed across Africa.
We examine the creation of new districts as a mechanism through which aid can be used by the incumbent to his/her electoral advantage, combining geolocalized aid data from multiple donors at the county level, information on administrative unit creation from
Grossman and Lewis (2014), and electoral outcomes from presidential elections from the
Ugandan Electoral Commission.
that effect?
We use an ordinary least squares (OLS) model with multiple fixed effects in a “difference-in-difference”-like model. This allows us to look into the effect of aid in the following elections and to verify for the non-existence of a previous trend. We find that local aid—at the county-level or lower—has a very small impact on electoral outcomes and that the effect can be amplified when found in combination with administrative unit creation, particularly on counties that move to the newly created unit, rather than those that remain in the former district structure.
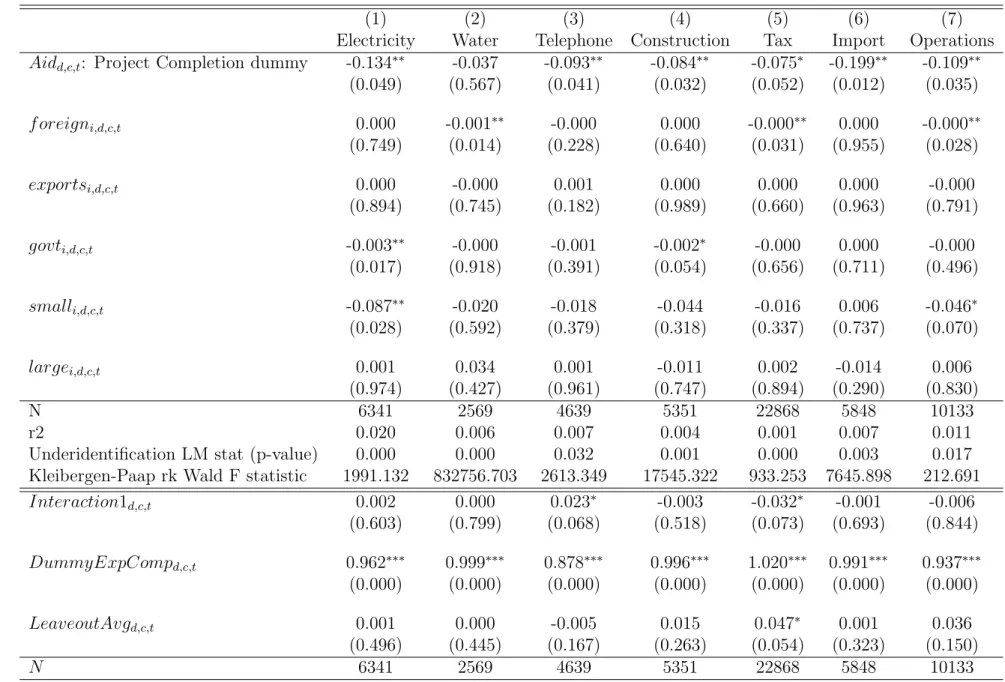
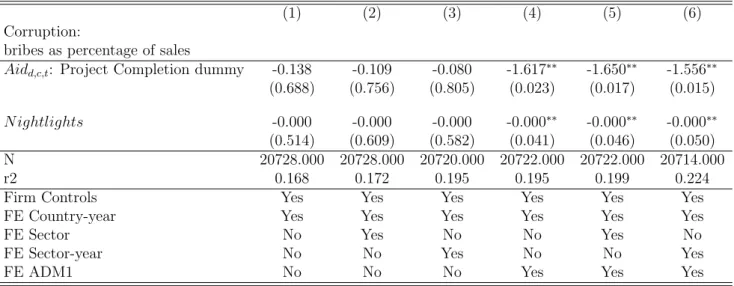
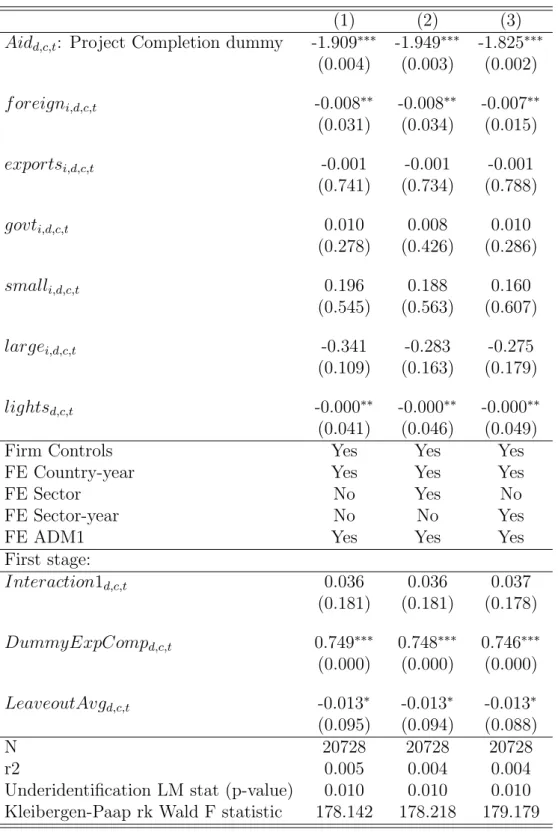
Chapter 2 investigates the potential impact of foreign aid in corruption. There are multiple channels through which aid can impact corruption and ambiguous evidence. Understanding this relationship is fundamental given how corruption has been shown to be detrimental to economic development, which is largely the end goal of foreign aid.
In this chapter I investigate the impact of multilateral aid allocated locally on firm-level reported corruption worldwide. The contribution of this paper relies largely on the investigation being at a lower level of aggregation and on the fact that the survey data used asks for actual reported corruption, rather than corruption perception.
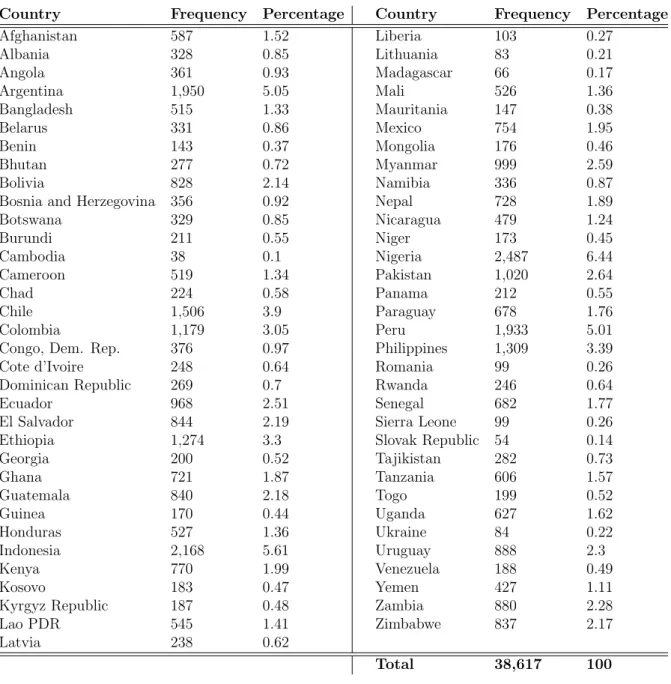
I use sub-national geocoded aid from the World Bank projects and a series of World Bank Enterprise Surveys ranging from 2006 to 2014 and analyse the effect of aid implemented at the sub-national level in firms spread across 67 countries and over an 8 year period. With a 2SLS model that exploits expected project completion dates and project manager’s workload to instrument for project completionMarx (2017), I find evidence that World Bank aid does indeed reduce corruption in firms located in the same administrative unit in which the aid projects were implemented.
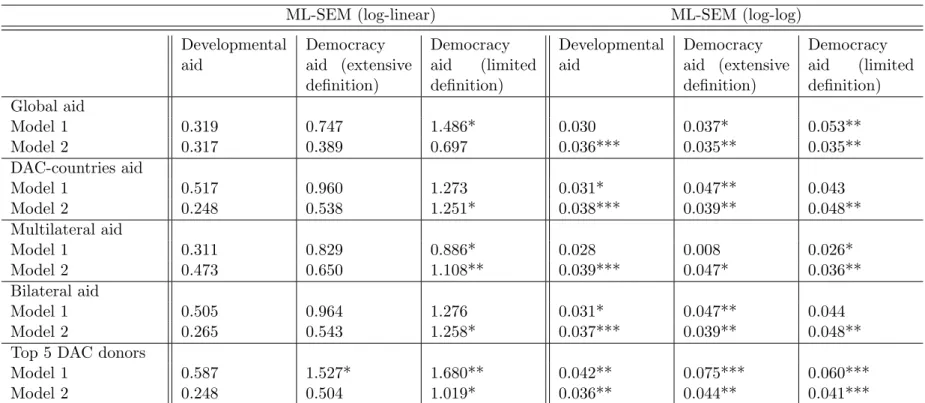
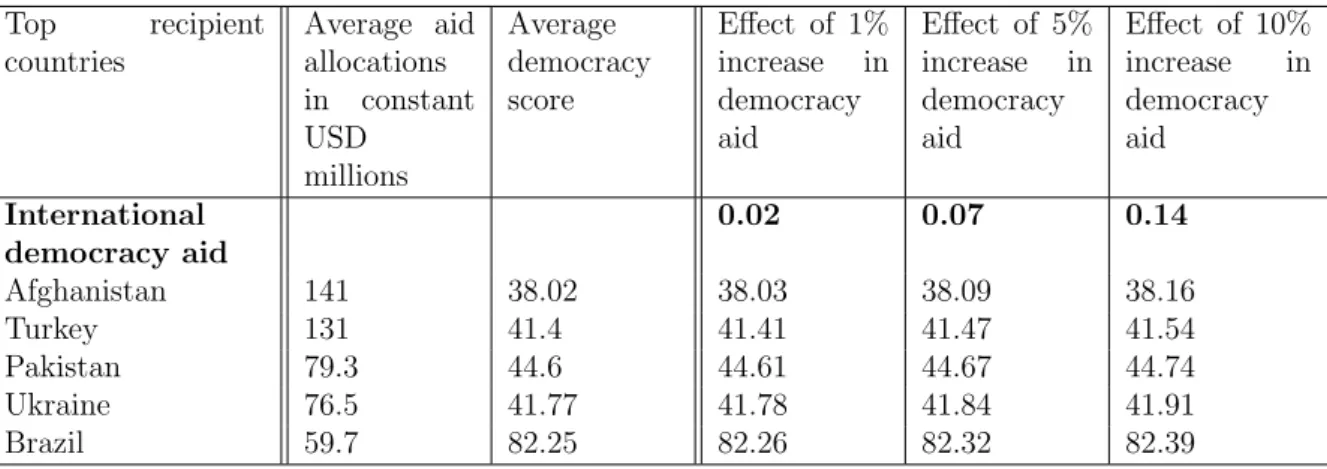
Chapter 3 co-written with Miguel-Nin˜o-Zaraz´ua (UNU-WIDER) and Rachel Guisselquist (UNU-WIDER) looks into democracy aid and democratic outcomes. We use DAC aid data from an OECD database and democracy outcomes from the Varieties of Democracy (V-Dem) project.
We consider different definitions of democracy aid and using a panel of countries from 1995 to 2018 and a ML-SEM dynamic panel model—as well as a fixed-effects model as a robustness check—we find suggestive evidence of a very small effect of democracy
aid on democratic outcomes and strongly rejects any suggestion of a negative impact of democracy aid on democratic outcomes. Moreover, our evidence suggests the effects of aid on democracy stem from aid directed specifically to activities considered as democratic underpinnings.
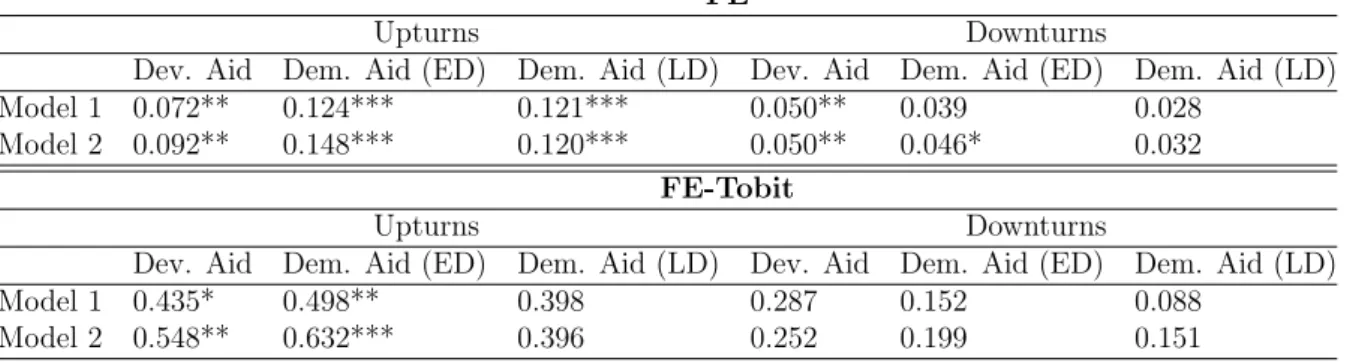
In order to better understand the dynamics of the relationship between aid and democracy we tackle two more questions. Firstly, we investigate the effects of aid on movements towards democratization (upturns) and democratic backsliding (downturns) using both an OLS fixed effects and a Tobit-Fixed effects models. Secondly, we explore the effect of aid on the likelihood of regime change using a Fixed-effects ordered logit model.
Chapter 1
Aid, administrative unit creation,
and elections: Evidence from Uganda
co-written with Lisa Chauvet
Abstract
This paper analyzes the potential impact of foreign aid on electoral outcomes of presidential elections in Uganda. We use geocoded aid data and electoral results at the county-level, as well as redistricting data, also at the county-level. A simple ordinary least squares (OLS) model in combination with a series of fixed effects is used to evaluate the impact of foreign aid in counties that were reallocated to a newly created district in the same period in which they received aid. A simultaneous regressions model is used as a robustness check and to understand the mechanisms at play. We find a positive impact of joint aid and redistricting on the share of votes received by the incumbent. Our results suggest that administrative unit proliferation might function as a mechanism through which aid is used by the incumbent to gain electoral support.
1.1
Introduction
Africa has experienced an unprecedented wave of democratization since the 1990’s. Previously, leaders often lost power violently, however, since then it has become more
common for the change of power to happen through an electoral process. According to the Freedom House, the number of African countries considered “not free” went from 33 in 1990 to 22 in 2018. Nevertheless, the transition is not always directly towards perfect democracies. A large fraction of African countries are still considered only “partly free”, despite holding regular elections. Therefore, it is important to understand factors that might influence electoral outcomes in order to better understand how democracy works in countries considered semi-democratic (semi-authoritarian), such as Uganda.
At the same time that Africa went through this democratization process, it has also been receiving large flows of Official Development Assistance (ODA). According to the OECD, the continent received nearly 50 billion dollars in net ODA in 2016. Uganda was the 8th largest recipient in 2016, receiving approximately 1.75 billion dollars in net disbursements. This amount represents over 22 percent of the country’s budget for the 2016/2017 fiscal year, which was of about 7.9 billion dollars. Given the significant reliance of African countries on foreign aid, it is also important to better understand if and how aid can impact these fragile democracies.
On foreign aid and democracy, a strand of the foreign aid literature initiated by
Knack (2004) looks into the impact of foreign aid on democracy promotion and finds
no evidence of that effect, but on more recent research Kilby and Dreher (2010) finds a significant positive relationship, and presents evidence that donors allocate aid in response to democratization and recipient countries respond to this incentive for democratic reform. Furthermore, Wright (2009) suggests that the promise of higher aid for democratization only works for political leaders that expect to remain in office after the democratization occurs. Those that have a high chance of winning elections respond to aid by democratizing, but for the others, aid helps them hold power.
We investigate the specific link between foreign aid and presidential elections at the local level, particularly whether foreign aid can be used as part of the incumbent’s electoral strategy. We raise the possibility that administrative unit proliferation, which was widespread in Africa during the 1990’s and 2000’s, is one mechanism through which aid affects the incumbent’s share of votes. It is not clear how foreign aid impacts elections. One could expect aid to be provided with support for democratic institutions and to
incumbent’s favor as part of their electoral strategy, thus reducing competition. A better understanding of this link would inform donors and policy-makers on ways to ensure that aid contributes to fair elections and therefore to democracy itself. Furthermore, we suggest a sophisticated commitment mechanism that would explain how the explosive administrative unit creation process, joined with higher foreign aid allocated at the local level, impacted electoral results in Uganda.
More globally, this paper contributes to the literature on the impact of foreign aid. Earlier contributions focused primarily on aid effectiveness, measured as the impact of aid on growth, and generated a lot of controversy, with disagreement among esteemed economists. In theory, aid could lead to economic growth, as it reduces the financing gap and relaxes capital constraints (Chenery and Strout, 1966). However, aid can also lead to a ’Dutch disease’ problem, due to its macroeconomic impact on the exchange rate and competitivity; and to a deterioration of political and economic institutions, through its governance impact (Younger, 1992). Disagreement between these positions leads to some economists asking for scaling up of aid (Sachs, 2006), and others warning about its potential disastrous effects (Easterly, 2006).
The empirical literature provided no relief, showing mixed results and adding to the controversy. Results varied from basically a negative or null impact (Rajan and
Subramanian, 2008), to positive (Arndt et al., 2015), or heterogeneous (Clemens et al.,
2012). Furthermore, the debate on aid effectiveness has linked aid impact with donor’s practices (Djankov et al., 2009), motivation (Kilby and Dreher, 2010), and aid type
(Clemens et al., 2012), but overall no consensus has been reached on the growth effects
of aid in recipient countries.
In an attempt to properly identify a causal relationship between aid and growth, different authors have focused on different types of instruments, such as the size of recipient country (Rajan and Subramanian,2008), past values of aid (Minoiu and Reddy,
2010), and political connections with donors (Bjørnskov and Schr¨oder, 2013). A more recent approach is the use of interacted instruments, which combine a time-variant variable that affects the amount of aid given by a donor and a time-invariant variable that captures the proximity between the donor country and the recipient country. Nunn and Qian(2014) use US wheat production, interacted with the proportion of years a country receives
a positive amount of US food aid in 1971-2006 as the instrument for the amount of aid received by a country in a given year; Dreher and Langlotz (2017) interact donor country government fractionalization and the probability of receiving aid; and Chauvet
and Ehrhart(2015),Chauvet and Ehrhart(2018) interact donor tax revenue with colonial
history. Finally, Galiani et al. (2017) use a quasi-experiment approach exploiting IDA’s threshold and find a positive, significant, and economically sizable effect of aid on growth.
The literature on aid effectiveness has recently gone through two major revolutions: one political, and the other spatial.1 When looking into political economy impacts, the aid literature is once again failing to reach a consensus. Some authors have drawn a parallel between oil and aid, which, as non-tax revenues, may reduce government accountability. For example,Djankov et al. (2008) and Kalyvitis and Vlachaki(2012) find that aid tends to decrease the probability of a regime being democratic and reduces accountability. It is also argued that aid may finance inertia, that is, allow dictators to buy political support and remain in power longer than they would have without aid (Morrison,2009). Wright
(2009) provides more mixed evidence of the impact of aid on the probability of a regime change: aid may increase democratization if the autocrat feels he or she has good prospects for staying in power, while otherwise it may decrease the probability of democratization. Similarly, Dutta et al.(2013) show that aid increases democratization in regimes that are already democratic, while pushing autocratic regimes to become even more dictatorial, a hypothesis they call the amplification hypothesis. Other authors have argued that aid may even have a positive influence on political institutions: aid may notably improve education and contribute to development outcomes that are preconditions for a democracy to function well. In that case, the impact of aid on democracy would then play out over a longer period of time. Such a long-run positive effect of total aid on the quality of political institution was found by Goldsmith (2001), Heckelman(2010) andKersting and
Kilby (2014) using a cross-section of countries. Aid may also increase the probability of
1It has also gone sectoral. The recent literature has provided some initial insights on the effects of
sector aid on educational and health outcomes, which are believed to affect growth, but in the long term only. On the education front, Michaelowa and Weber (2006) find a positive, though small impact of aid to the education sector on education outcomes. Dreher et al. (2008) use indicators for governance and child mortality to instrument aid and also find a positive, and larger, impact of aid on growth, with each additional dollar of per capita aid increasing school enrollment by 0.3 percent. On the health front,Chauvet et al.(2013) look into the impacts of health aid on infant mortality instruments from the
democratization in the short run, notably by creating incentives through the conditionality setup (Kersting and Kilby, 2014).
From the spatial perspective,Dreher and Lohmann(2015) have recently examined the impact of World Bank aid on growth outcome measured at the sub-national level using nightlights data. Dreher et al.(2019) investigate the use of aid by political leaders for their own political or personal interests by verifying if Chinese aid is allocated to the political leader’s birth regions and regions populated by their ethnic groups; and Marx (2017) estimates the effect of project implementation on electoral outcomes, exploiting variation on portfolio size of World Bank project team leaders as an instrument and finding that the completion of projects coincides with pre-election years.
Our analysis embraces these new trends to examine aid with a political and spatial perspective. We rely on geocoded foreign aid and electoral data at the county-level (ADM2 level) and exploit the panel data to compare counties that received aid and were broken up in sub-districts in the same period with a control group of those that did not receive aid, or did receive aid but did not breakup in the period of interest. We use district-year and county fixed effects as controls. Furthermore, we use a simultaneous equations model as a robustness check and to understand the mechanisms.
The results obtained suggest that aid increases the electoral support to the incumbent, particularly in counties that are part of a district that is divided and are allocated to a newly created district. The administrative unit creation and the aid commitments may work as a joint commitment device to present a strong signal of commitment from the central government to this new administrative unit. We analyze this as potential evidence that aid can impact electoral outcomes through the process of administrative unit division, as it is used to compensate loss of support stemming from being a “splinter” county, signaling that being a “splinter” will not lead to marginalization.
1.2
Political Context
Uganda has a largely decentralized political system, which has been implemented since the National Resistance Movement (NRM) came to power in 1986. The Local Councils
(LCs)—originally Resistance Councils (RCs)—were part of a governance system developed when the NRM was still a rebel group. The system has evolved and today exists as a five-tiered system with districts (LC5), counties (LC4), sub-counties (LC3), parishes (LC2), and villages (LC1).
During the 1990’s Uganda went through a process of fiscal and political decentralization in which the district governments (LC5) particularly gained much power. On the fiscal side, a series of acts granted the district governments’ responsibility for all funds channeled from the central government and greater power to generate revenue as well as to distribute it to the lower local government levels. On the political side, LC executive positions became either locally elected or appointed by local officials.
Additionally, or perhaps in response to it, during the 1990’s Uganda has also seen a large proliferation of sub-national administrative units, meaning a political process with several local governments being split into two or more units over a relatively short period. This followed a global trend that was even more emphasized in Sub-Saharan Africa where the number of administrative units increased since the 1990’s. In a set of 25 African countries, Grossman and Lewis (2014) find that the number of administrative units was increased by between 25 percent to 100 percent2. In the particular case of Uganda, this
happened at the district level, which was multiplied by more than three, from mere 34 districts in 1990 to 112 in 2010. Figure1.1below shows the split categories of each county for the periods 2002-2006 and 2007-2011. The grey line shows the county boundaries and the thicker black lines show the district boundaries at the beginning of the period. The number of districts evolved from 56 in 2002, to 80 in 2007, and 109 in 2011.
The new districts are created through a political process that is initiated through a vote at the district council for the separation of one or more of its counties, and ends with the Ugandan parliament approving, or not, the separation. Once it is approved a new district is created, receiving a new headquarter complex and several elected and appointed government positions. Each new district has eleven administrative departments that are staffed by numerous civil servants.
Figure 1.1: Re-districting in 2006 and 2011
2002-2006 2007-2011
boundaries. A new district is created from the separation of a part of its counties to form a new, separate, district. In this paper, followingGrossman and Lewis (2014), we call the process of re-districting the “split”, which generates two types of counties. The counties that post-split still belong to the original district are considered part of the “mother” district; and those that post-split belong to the newly created district are considered “splinters”. Essentially, what defines the county as a “mother” or a “splinter” is whether it has maintained the old district headquarters or if it is under the newly created structure. In addition to those two types some counties belong to unmodified districts. On Figure1.1
the dark green counties represent the “mother” counties, and the light green counties are the “splinter” counties, those that were removed from the original district and reallocated to a newly created one.
The proliferation of districts has been largely explained in the existing literature by the interests of the national government—particularly the president (Green, 2008, 2010;
Awortwi and Helmsing, 2014b,a). On the other side, Tabaro et al.(2018);Grossman and
Lewis (2014) emphasize the role of local actors, while still recognizing that the central
government has the final say in the creation of new districts.
Since we include district-year fixed effects (with the 2001 district division) in all of our specifications, our analysis only compares counties that in 2001 belonged to the same district and that later will be “breakups” or not. When later on we restrict the
comparison to “splinters” and “no breakups”, we are only comparing counties that again, belonged to the same district in 2001, and this original 2001 district suffered more than one division until 2011. That is because we do not consider counties that were “mothers”, only “splinters” and “no breakups”. In the case of a district division during a certain period, all counties are in this period classified as “mothers” or “splinters”. Therefore, we can only compare the “splinters” of a period, with others that were on the same original 2001 district, but are now already in a different district that did not suffer a division in 2011.
1.3
Mechanisms
The creation of a new district could impact electoral results in the “splinter” and “mother” counties in different ways, which also depend on what leads to the creation of new districts itself. Theoretically, administrative unit creation could be beneficial to the counties that are allocated in the new administrative unit because of the establishment of the new bureaucratic apparatus, which citizens link with better access to services. However, another possibility is that the “splinter” counties would be further marginalized if the central government used this process to isolate dissident counties in order to focus their efforts in getting or maintaining support from the “mother” counties. Furthermore, while a new district would likely shorten the proximity to vital services, its impact in the quality of the services is more ambiguous (Grossman and Lewis, 2014). On the “mother” side, redistricting could have a negative effect on public funds and consequently on electoral support if the “mother” counties see the divisions as a loss of political or economic power; or a positive effect, if the population expects to continue receiving the same amount of funds to be distributed to a smaller population.
Grossman and Lewis (2014) suggest that administrative unit creation happens when
the interests of the national executive and of local elites in marginalized areas—politically, economically, and ethnically—are aligned, which would imply that administrative unit creation is beneficial for the “splinter” counties, as those would receive more public funds. Focusing on the “splinter” counties, they find that the incumbent president receives an
Figure 1.2: Incumbent’s share of votes in 2006 and 2011
2006 2011
et al. (2019) argue that administrative unit creation could be used as a strong signal of
commitment for electoral groups that do not have a history of reciprocal relationships, as the creation of a new administrative unit entails an increase in stable fiscal transfers due to the stickiness of administrative boundaries. They hypothesize that the electoral reward to the incumbent post-split could also benefit “mother” areas, but not as much as splinters. Their argument also supports the idea that “splinter” counties benefit from this process and that could translate in an increase in electoral support for the incumbent.
Awortwi and Helmsing(2014a) conduct qualitative research on the motivations behind
administrative unit creation in Uganda, concluding that the main reason is patronage and a variant of gerrymandering. Anecdotally, they mention the case of Ngora county in Kumi district, a stronghold of the opposition that demanded district status. Museveni signaled the possibility of district status in a political rally in 2008 and following that local politicians pledged to support his fourth term bid in exchange for district status. As a result, Ngora was given district status in 2010 and in the 2011 elections Museveni won the majority of votes in the district. This evidence supports the idea of administrative unit creation as a vote-buying instrument.
In this context, aid flows come as an additional external source of revenue that could be used by the incumbent. Theories of political agency suggest that politicians prioritize
Figure 1.3: Dummy for counties that received aid between the 2006 and 2011 elections
policies that voters are most likely to reward in the polls and aid, as a windfall resource, is a potential tool for this process. Figure 1.2 shows the distribution of the share of votes for the incumbent on the 2006 and 2011 elections. In the first period the share of votes on the Northern region is very low in comparison with other parts of the country, and in the 2011 elections the results are much closer to those of other regions, while remaining the region with lowest support.
Marx(2017) finds evidence that project completion leads to electoral benefits and that consequently completion is expedited around election dates in response to these incentives.
Jablonski (2014) argues that governments successfully influence the distribution of aid in
favor of strategically important voters hence increasing the probability of reelection of the incumbent. Furthermore, Briggs (2015) claims that aid changes can influence the odds of incumbents winning reelections, but only when the change happens in the year immediately before the election.
Combining these two effects, namely the administrative unit creation and the receipt of foreign aid commitments, one could expect that aid would increase support for the incumbent, and this effect could be stronger or weaker in “splinter” counties or “mother” counties, depending on whether the redistricting process is accompanied by efforts to gain
of aid and administrative unit creation could be seen as a signal of strong commitment from the side of the central government. While splintering by itself could be negative to the county if it is neglected by the central government, aid commitments could signal that this would not be the case.
It is important to notice that whether the central government really has all this leeway to allocate foreign aid is critical to our argument. According toDreher et al.(2019) in the case of Chinese aid this would be true, but not so much for World Bank aid. We argue that the national government does have that power, as our foreign aid data contains all donors, with a majority of bilateral donors which are potentially more vulnerable to this type of influence than multilateral aid—such as World Bank aid. From the total number of projects over 71 percent are from bilateral donors.
Figure1.3 shows the counties that did received an aid project between the 2006 and 2011 elections in blue and those counties that did not receive any aid project in red. Approximately 70 percent of the counties received at least one project in the period and those are well distributed between the regions.
1.4
Empirical Strategy
We estimate the effect of aid received by constituencies on their electoral outcomes using Uganda as a case study. However, whether or not a constituency receives aid is not random and is the outcome of a negotiation between the government and the donors. Hence aid may target constituencies depending on the previous electoral outcomes in order to ensure the incumbent with more votes. To deal with the endogeneity bias stemming from reverse causality and potential confounding factors, we will adopt a sequential empirical strategy.
The initial model is an Ordinary Least Squares (OLS) with a series of fixed effects in an effort to isolate the effects in which we are interested, namely receiving or not aid, being or not a “breakup” county, and the interaction of these two variables. Despite the inclusion of district-year and county fixed effects, the model is still susceptible to endogeneity at the county-year level. Equation1.1 estimates our main electoral outcome,
the share of votes received by the incumbent (V oteSharec,d,t) in constituency c of district d in election t as a function of the following variables:
• Aidc,d,(t,t−1), aid received in the five years preceding the election t—which comprises the entire “between elections” period, measured as commitments per capita or disbursements per capita);
• Breakupc,d,(t,t−1), a binary variable on whether the county was a “breakup” county (mother or splinter) in the five years preceding the election t;
• and an interaction term of these two variables.
Additionally, we control for nightlights, county fixed effects, and district-year fixed effects, with the district division in place in 2001; and we cluster the standard errors at the county-level, which is the level of the treatment.
V oteSharec,d,t = α + βAidc,d,(t,t−1)+ γDBreakupc,d,(t,t−1) +δAidc,d,(t,t−1)∗ DBreakupc,d,(t,t−1)+ ζc+ ηd,t+ εc,d,t
(1.1)
In a second step, we distinguish the effects of being a “mother” county or a “splinter” county. In order to do so, we adjust the sample to ensure we compare “mother” or “splinters” exclusively with “no breakups” to avoid confounding the effects of “mother” or “splinter” with each other. Therefore, when focusing on “splinters” we run a similar regression but exclude all counties that were mothers either in 2006 or in 2011, and when focusing on “mother” counties we exclude from the sample counties that were “splinters” either in 2006 or 2011. This reduces the sample from 322 observations to 182 observations when focusing on “splinters” and to 164 when focusing on “mothers”. Equations 1.2 and
1.3 are listed below.
V oteSharec,d,t = α + βAidc,d,(t,t−1)+ γDSplinterc,d,(t,t−1) +δAidc,d,(t,t−1)∗ DSplinterc,d,(t,t−1)+ ζc+ ηd,t+ εc,d,t
(1.2)
This model resembles a difference-in-differences model, and as such, the identifying assumption requires that the treated constituencies would have followed a trend in electoral outcomes similar to that observed in their non-treated counterparts, had they not had any aid or district division. We provide indirect evidence on this parallel trend assumption by testing whether treated and control constituencies were already experiencing different trends in terms of electoral outcomes before the treatment occurrence (i.e., between 2001 and 2006). When running the parallel trend we use a very similar set of equations, but exclude the interaction term and run it on the past values of the electoral outcome, as seen on equations 1.4, 1.5, and 1.6, below3.
V oteSharec,d,t−1= α + βAidc,d,(t,t−1)+ γDBreakupc,d,(t,t−1)+ ζc+ ηd,t+ εc,d,t (1.4)
V oteSharec,d,t−1 = α + βAidc,d,(t,t−1)+ γDSplinterc,d,(t,t−1)+ ζc+ ηd,t+ εc,d,t (1.5)
V oteSharec,d,t−1 = α + βAidc,d,(t,t−1)+ γDM otherc,d,(t,t−1)+ ζc+ ηd,t+ εc,d,t (1.6)
Our main dependent variable, V oteSharec,d,t, is the share of votes for President Yoweri Museveni during the presidential elections calculated as the number of votes received by Museveni divided by the number of total votes. Furthermore, we run the same three models described above on a second electoral outcome variable, the winning margin -W inM arginc,d,t, which is the distance between the first and second runners divided by the sum of the votes of both candidates. This can be considered a measure of competitiveness of the elections, which would be higher when the winning margin is lower—the first two candidates were close in terms of votes, or lower if the winning margin is higher—there is a larger gap between the first and second candidates. The descriptive statistics comparing
3Alternatively we also run the same model including both “mother” and “splinter” dummies as well
Table 1.1: Descriptive Statistics - outcomes in 2006
Breakup11 No Breakup11 Diff. Std. Error Obs. V oteSharec,2006 0.5110 0.5983 0.0873∗∗ 0.0390 161 W inM arginc,2006 0.4828 0.4989 0.0161 0.0415 161
Splinter11 No Breakup11 Diff. Std. Error Obs. V oteSharec,2006 0.5348 0.5983 0.0635 0.0497 123 W inM arginc,2006 0.5241 0.4989 -0.0253 0.0519 123
Mother11 No Breakup11 Diff. Std. Error Obs. V oteSharec,2006 0.4897 0.5983 0.1087∗∗ 0.0468 127 W inM arginc,2006 0.4457 0.4989 0.0531 0.0517 127
Splinter11 Mother11 Diff. Std. Error Obs. V oteSharec,2006 0.5348 0.5658 0.0310 0.0482 161 W inM arginc,2006 0.5241 0.4830 -0.0412 0.0505 161
these outcomes in 2006 between counties in the three “split” categories in 2011 are shown on Table 1.1.
The electoral data used was obtained directly from the Ugandan Electoral Commission website and covers three waves of presidential elections: 2001, 2006, and 2011. The data was initially available in PDF format, which was transferred to excel and matched to the ArcGIS shapefile with the administrative divisions at the county level4.
The literature on the impacts of aid at sub-national level is still in its early stages due to the limited data below the country-level. In order to conduct this analysis, we use the database AidData 3.0. AidData, managed by AidData Center for Development Policy, a research lab at William and Mary College that partners with multiple international organizations to provide more comprehensive data on foreign assistance projects. This dataset represents the most accessible and complete database to study and evaluate foreign aid at the sub-national level.
For our main independent variable, Aidc,d,(t,t−1), we use a subset of data covering all
Table 1.2: Descriptive Statistics - aid in 2011
Breakup11 No Breakup11 Diff. Std. Error Obs.
AIDComP cc,(06,11) 7.7153 5.2966 -2.4187 2.5068 161
AIDDisbP cc,(06,11) 1.8009 2.3000 0.4991 1.7271 161
Splinter11 No Breakup11 Diff. Std. Error Obs.
AIDComP cc,(06,11) 1.7517 5.2966 3.5449 2.3288 123
AIDDisbP cc,(06,11) 0.4552 2.3000 1.8448 2.3310 123
Mother11 No Breakup11 Diff. Std. Error Obs.
AIDComP cc,(06,11) 13.0511 5.2966 -7.7545∗∗ 3.3294 127
AIDDisbP cc,(06,11) 3.0049 2.3000 -0.7049 2.3731 127
Mother11 Splinter11 Diff. Std. Error Obs.
AIDComP cc,(06,11) 13.0511 1.7517 -7.7545∗∗ 3.3294 127
AIDDisbP cc,(06,11) 3.0049 0.4552 -0.7049 2.3731 127
geocoded data from the Aid Management Platform (AMP) for Uganda. The version used in this paper5 was published in 2016 and tracks 565 geocoded projects across 2,426
locations, running from 1987 to 2014. We keep only aid projects that started between 1996 and 2010, since we use five-year averages from the years before each of the election waves6. Overall 181 different projects representing 1,235 project location points remain7.
In order to treat the data we first extract from this dataset the projects that are geocoded with precision equivalent to ADM2 (county-level). We have information on the number of projects, commitments, and disbursements. When considering projects that are allocated to more than one location point, we weight the aid variable by the population share in the county out of the total population impacted by that project, followingDreher
and Lohmann (2015) nation-wide levels of aid are accounted for through the district-year
fixed effects that we include in all estimations. Table 1.2 shows the summary statistic of aid in 2011, according to the category of the county in 2011.
The data tracking the division of districts in smaller ones and the creation of “mother” and “splinter” counties, DM otherc,d,(t,t−1)and DSplinterc,d,(t,t−1) respectively, is obtained
5Uganda AIMS Geocoded Research Release, Version 1.4.1
6Elections are held early in the year, in February or March, depending on the year
7We do not include budget support in our measure of aid, as that type of aid is generally allocated
from Grossman and Lewis(2014)8. They constructed a county-level dataset to track the
district proliferation, following the districts to which these counties belonged from 1996 to 2011, structuring the temporal dimension around the election cycles.
Since there is no income data available at the county-level, we use nightlights as a proxy for income. The use of nightlights as a proxy for income has been studied in several articles and has shown promising results9.
There are digital archives available since 1992 of the intensity of Earth-based lights obtained from satellites from the United States Air Force Defense Meteorological Program (DMSP) through their Operational Linescan System (OLS). This data is processed by the National Oceanic and Atmospheric Administration’s (NOAA) National Geophysical Data Center (NGDC), which removes natural anomalies10 and leaves mostly man-made light.
After that, the data from all orbits of a satellite in a given year are averaged and a satellite-year dataset is produced.11 These satellite-year datasets report the intensity of
lights for every 30 arc-second output pixel (approximately 0.86 square kilometers) with a digital number between 0 (no light) and 63. This small resolution allows this data to be used for spatial analysis of economic activity in small geographical areas.
Despite many shortfalls in the use of nightlights as a proxy for economic development it is still a very useful proxy for sub-national level of income Chen and Nordhaus (2010). In order to attenuate the instability of nightlights in Uganda12 we use averages of the mean nightlight intensity on the five years previous to the election year analyzed and average that within each ADM2 unit. It is easy to see that Uganda has a very low level of development, with the most lit county, Kampala City, never surpassing the low-forties. Furthermore, approximately half of the counties are completely unlit, and the average of all counties is under one. Table 1.3 shows the summary statistics of the variables from 2001 to 2011.
8The data is available at https://dataverse.harvard.edu/dataset.xhtml?persistentId=doi:10.7910/DVN/26937 9See Henderson et al. (2012), Elvidge et al. (1997), Doll et al. (2006), Sutton et al. (2007), and
Michalopoulos and Papaioannou(2013)
10Ephemeral events such as fires are discarded and then the background noise identified is replaced
with values of zero. For more see Lowe(2014).
11Following best practices, we average the nightlight intensity captured by the different satellites for
years when there is more than one satellite active.
Table 1.3: Descriptive Statistics
mean sd count V oteSharec,t 0.6294 0.2280 483 W inM arginc,t 0.5126 0.2706 483 Lightsc,(t,t−1) 0.7620 2.5314 483 Aidc,d,(t,t−1) = project count 0.2464 0.4313 483 Aidc,d,(t,t−1) = commitments per capita 2.1972 9.6446 483 Aidc,d,(t,t−1) = disbursements per capita 0.7330 6.3736 483
N 483
1.5
Results
Firstly, Table1.4 presents the results from equation1.1 on columns (1) and (2). The results show that being a “breakup” county increases the vote share of the incumbent for both our measures of aid—commitments per capita and disbursements per capita, but there is no impact of aid by itself nor of the interaction of aid with “breakup”. This would suggest that the administrative unit creation does seem to be linked with increased support to the incumbent, but aid has no identifiable impact. Columns (3) and (4) show no effect of any of the variables of interest on the winning margin at the 10 percent significance level.
In the sequence, we try to separate the effects of “mother” or “splinter” counties, to verify if those are distinct effects. When separating the effects to consider only the effect of being a “splinter” or only the effect of being a “mother”—instead of bundling both categories together, we drop all counties that were “mother” counties in either 2006 or 2011 for equation 1.2 and drop all counties that were “splinter” counties in 2006 or 2001 for equation 1.3. The results are presented on Tables 1.5 and 1.6, respectively13. Columns (1) and (2) of Table 1.5 show that while being a “splinter” county before an elections decreases the share of votes to the incumbent, this effect is partially offset when the county receives aid14. Our interpretation of these results is that the creation of a new 13Table1.8in Appendix1.7shows the results for when include both “mother” and “splinter” dummies
and interactions in the same equation
14The inclusion of district-year fixed effects supports the argument that the observed effect is from aid
and not from any other resources because central government transfers are mainly channelled through the districts and therefore absorbed by these fixed effects
Table 1.4: OLS model - Breakup
Panel A:
(1) (2) (3) (4)
VoteShare06,11 VoteShare06,11 WinMargin06,11 WinMargin06,11
DBreakupc,d,(t,t−1) 0.040∗∗ 0.033∗ -0.014 -0.021 (0.019) (0.019) (0.064) (0.059) Aidc,d,(t,t−1)∗ DBreakupc,d,(t,t−1) -0.001∗ -0.000 -0.001 -0.001 (0.001) (0.001) (0.002) (0.001) Lightsc,(t,t−1) -0.026 -0.019 -0.020 -0.012 (0.022) (0.018) (0.052) (0.046)
Aidc,d,(t,t−1) = Comm per capita 0.001 0.001
(0.000) (0.001)
Aidc,d,(t,t−1) = Disb per capita -0.000 0.000
(0.000) (0.000)
Panel B: Parallel Trend
(1) (2) (3) (4)
VoteShare01,06 VoteShare01,06 WinMargin01,06 WinMargin01,06
DBreakupc,d,(t,t−1) -0.029 -0.028 0.002 0.005
(0.021) (0.021) (0.040) (0.040)
Lightsc,(t,t−1) -0.020∗∗∗ -0.018∗∗∗ -0.016 -0.007
(0.006) (0.006) (0.026) (0.026)
Aidc,d,(t,t−1) = Comm per capita 0.000 0.001
(0.000) (0.001)
Aidc,d,(t,t−1) = Disb per capita -0.000 -0.000
(0.000) (0.000)
N 322 322 322 322
County FE Yes Yes Yes Yes
District-year FE Yes Yes Yes Yes
Standard errors in parentheses ∗p < 0.10,∗∗p < 0.05,∗∗∗p < 0.01
administrative unit is not perceived as beneficial from the electorate, and therefore there is no retribution in the form of support unless there is an additional signal - namely the aid commitments -suggesting the new administrative unit will be receiving more funds. Furthermore, we find a positive impact of aid on the vote share when using commitments per capita as a measure of aid, but the effect is insignificant when using disbursements per capita. In an attempt to show a common trend with respect to aid, we run the same model on the lagged outcomes, the results are presented on Panel B and columns (1) and (2) show that there is no significant effect of receiving aid in 2006-2011 on the the incumbent’s vote share in 2001-2006, suggesting that there was no pre-existent trend on the outcome on these counties that received aid.
On columns (3) and (4) we observe the results when using the winning margin as the electoral outcome. We find that in this case, being a “splinter” county is associated with a decrease in the winning margin, suggesting the elections are somewhat more competitive in these counties, and the interaction with aid is positive, suggesting that when counties are “splinters” and receive aid in the same period elections are less competitive. Moreover, aid is positively linked to the winning margin when the measure used is disbursements per capita. However, the parallel trend estimation presented on Panel B does not hold on column (3), suggesting that commitments per capita in 2011 is associated with a higher winning margin in the 2006 elections.
More specifically, being a “splinter” county reduces Museveni’s vote share by 11.7 percentage points and this effect is countered by 1.5 percentage points for each additional dollar per capita in commitments. Additionally aid by itself has a positive impact of 0.1 percentage points of the vote share per dollar of commitments per capita. The average amount of aid commitments per capita in 2011 was 2.19 dollars, so an increase of 1.5 percentage points is equivalent to an increase of almost 70 percent in aid. Note however, that when we consider only the counties that did receive positive aid in 2011, the average commitments per capita is 8.92 dollars, which would make an increase of 1.5 percentage points the equivalent of a about 17 percent in aid.
In the case of disbursements being a “splinter” reduces the incumbent’s vote share by 11.5 percentage points, and aid compensates by 3.4 percentage points per additional dollar per capita in disbursements.
Table 1.5: OLS model - Splinter
Panel A:
(1) (2) (3) (4)
VoteShare06,11 VoteShare06,11 WinMargin06,11 WinMargin06,11
DSplinterc,d,(t,t−1) -0.117∗∗∗ -0.117∗∗∗ -0.257∗∗∗ -0.240∗∗∗ (0.000) (0.003) (0.003) (0.005) Aidc,d,(t,t−1)∗ DSplinterc,d,(t,t−1) 0.015∗∗∗ 0.034∗∗∗ 0.026∗∗∗ 0.036∗∗ (0.003) (0.005) (0.006) (0.017) Lightsc,(t,t−1) 0.019∗∗∗ 0.018∗∗ 0.086∗∗∗ 0.062∗∗∗ (0.004) (0.007) (0.025) (0.012)
Aidc,d,(t,t−1) = Comm per capita 0.001∗∗∗ -0.000
(0.000) (0.001)
Aidc,d,(t,t−1) = Disb per capita 0.002 0.014∗∗∗
(0.003) (0.004)
Panel B: Parallel Trend
(1) (2) (3) (4)
VoteShare01,06 VoteShare01,06 WinMargin01,06 WinMargin01,06
DSplinterc,d,(t,t−1) 0.030∗∗∗ 0.032∗∗∗ 0.247∗∗∗ 0.238∗∗∗
(0.002) (0.003) (0.005) (0.011)
Lightsc,(t,t−1) -0.025∗∗∗ -0.029∗∗∗ -0.081∗∗∗ -0.077∗∗∗
(0.004) (0.005) (0.020) (0.027)
Aidc,d,(t,t−1) = Comm per capita 0.001 0.004∗∗
(0.001) (0.002)
Aidc,d,(t,t−1) = Disb per capita 0.003 0.001
(0.003) (0.010)
N 182 182 182 182
County FE Yes Yes Yes Yes
District-year FE Yes Yes Yes Yes
Standard errors in parentheses ∗p < 0.10,∗∗p < 0.05,∗∗∗p < 0.01
Table 1.6: OLS model - Mother
Panel A:
(1) (2) (3) (4)
VoteShare06,11 VoteShare06,11 WinMargin06,11 WinMargin06,11
DM otherc,d,(t,t−1) 0.211∗∗∗ 0.176∗∗∗ -0.401∗∗∗ -0.462∗∗∗ (0.021) (0.039) (0.055) (0.065) Aidc,d,(t,t−1)∗ DM otherc,d,(t,t−1) -0.001 0.005 -0.002 0.015 (0.001) (0.010) (0.002) (0.019) Lightsc,(t,t−1) -0.023 -0.018 -0.005 0.011 (0.026) (0.021) (0.060) (0.053)
Aidc,d,(t,t−1) = Comm per capita 0.000 0.001
(0.001) (0.002)
Aidc,d,(t,t−1) = Disb per capita -0.000 -0.000
(0.000) (0.000)
Panel B: Parallel Trend
(1) (2) (3) (4)
VoteShare01,06 VoteShare01,06 WinMargin01,06 WinMargin01,06
DM otherc,d,(t,t−1) -0.315∗∗∗ -0.300∗∗∗ 0.546∗∗∗ 0.595∗∗∗
(0.012) (0.019) (0.163) (0.115)
Lightsc,(t,t−1) -0.023∗∗∗ -0.019∗∗∗ -0.031 -0.016
(0.006) (0.006) (0.027) (0.026)
Aidc,d,(t,t−1) = Comm per capita 0.000 0.001
(0.000) (0.001)
Aidc,d,(t,t−1) = Disb per capita -0.000∗∗ -0.001∗∗∗
(0.000) (0.000)
N 164 164 164 164
County FE Yes Yes Yes Yes
District-year FE Yes Yes Yes Yes
Standard errors in parentheses ∗p < 0.10,∗∗p < 0.05,∗∗∗p < 0.01
Next, we observe in Table1.6that being a “mother” county is associated with a higher share of votes for the incumbent and with a smaller winning margin, but there is not effect from aid or from the interaction between aid and mother.
1.6
Robustness check
As the evidence suggests that the observed effect from aid is derived from the “splinter” rather than the “mother” counties, we continue the analysis focusing on this group. As a robustness check and to better understand the mechanisms at play, we run a simultaneous equations model to concomitantly determine the electoral results, aid, and split category. The model is based on the set of equations below.
The first equation in the model regresses the vote share of the incumbent (V oteSharec,d,t) on: an interaction term of aid received and the dummy of being a “splinter” or not AIDc,d,(t,t−1)∗ DSplinterc,d,(t,t−1); an instrument for aid (GovtT ranst∗ P robAidc,d) constructed through the interaction of government transfers to the local governments as a percentage of GDP and a measure of the probability of a county receiving aid; the dummy for splinter, DSplinterc,d,(t,t−1); the nightlights variable (Lightsc,d,(t,t−1)), and a year dummy (Y ear11t). The second equation regresses the aid variable (AIDc,d,(t,t−1)) on the “splinter” dummy(DSplinterc,d,(t,t−1)), the instrument for aid (GovtT ranst∗P robAidc,d), the lagged share of votes for the incumbent (V oteSharec,d,t−1), nightlights (Lightsc,d,(t,t−1)), and a year dummy (Y ear11t). The last equation regresses the “splinter” dummy (DSplinterc,d,(t,t−1)) on the lagged electoral results (V oteSharec,d,t−1), nightlights (Lightsc,d,(t,t−1)), a variable of political marginalization constructed by
Grossman and Lewis (2014) (P olM argc,d,t) that works as an instrument for being a
splinter, and a year dummy (Y ear11t). Similarly to the OLS model, we include county and district-year fixed effects and cluster the standard errors at the county level.
V oteSharec,d,t= α + βAIDc,d,(t,t−1)∗ DSplinterc,d,(t,t−1)∗ P ost
+ζLightsc,d,(t,t−1)+ κY ear11t+ µc+ τd,t+ εc,d,t
AIDc,d,(t,t−1) = α + βDSplinterc,d,(t,t−1)+ ζAID IN STc,d,(t,t−1)+ ηV oteSharec,d,t−1
+θLightsc,d,(t,t−1)+ κY ear11t+ µc+ τd,t+ εc,d,t
DSplinterc,d,(t,t−1) = α + βV oteSharec,d,t−1+ ηP olM argc,d,t
+ζLightsc,d,(t,t−1)+ κY ear11t+ µc+ τd,t+ εc,d,t
(1.7)
The instrument for aid, GovtT ranst∗ P robAidc,d, is an interaction between a time-variant county-intime-variant variable and a time-intime-variant county-time-variant variable. The former is the share of transfers from the central government of Uganda to the local governments as a share of GDP, which is obtained from the Ugandan Ministry of Local Government, and the latter is the number of years between 1996 and 2011 in which the county received positive aid, capturing the proximity between donor and recipient counties. We believe the instrument is relevant because foreign aid and government transfer are substitutes -so they would be negatively related - and the aid is likely to be -somewhat “sticky”, -so receiving aid more frequently in the past is likely to increase the likelihood of receiving aid in the future. The exclusion restriction would imply that central government transfers and aid probability would only impact the electoral outcomes through aid.
The instrument for being a “splinter” county is the ratio of the county’s share of seats on a district-level council to its population share. This measures the extent to which a county is represented on the key’s resource allocation body with respect to its population, and the assumption here is that county that is under-represented at the district-level council is more likely to be unsatisfied in its position and push for the creation of a new district in which it would be absorbed and likely have better representation. The exclusion restriction would imply that the level of representation of the county at the district-level
Table 1.7: Simultaneous Equation
Dependent variable: Incumbent’s share of votes
V oteSharec,d,t AIDc,(t,t−1) DSplinterc,d,(t,t−1)
AIDc,(t,t−1) = Commitments per capita
Lights(t,t−1) -0.00560 12.12∗∗∗ -0.00724 (-0.62) (7.76) (-0.09) AIDc,(t,t−1)∗ DSplinterc,(t,t−1) 0.232∗∗∗ (5.90) Y ear11t 0.156∗∗∗ -3.532 0.293 (4.42) (-0.57) (0.89)
GovtT ranst∗ P robAidc,d -0.0372 -46.48∗∗
(-0.34) (-2.05) DSplinterc,d,(t,t−1) 0.0667∗∗∗ 3.594 (3.64) (1.03) V oteSharec,d,t−1 38.00∗∗ -3.256∗∗∗ (2.17) (-4.43) DEC repc,d,t -0.285∗∗∗ (-5.39) N 245 County FE Yes District-year FE Yes t statistics in parentheses ∗p < 0.10,∗∗p < 0.05,∗∗∗p < 0.01
council only affects the electoral outcomes through the administrative unit creation.
Both instruments used here present considerable weaknesses, but the estimation of the simultaneous equations models is still relevant is it allows us to better explore the potential mechanisms at play.
The results presented in Table 1.7 show the set of equations for aid measured as commitments per capita. The results presented here confirm the previous results showing a positive impact of the interactive term of “splinter” and aid on the incumbent’s share of votes. The coefficient of DSplinterc,d,(t,t−1) on the equation that defines AIDc,d,(t,t−1) is positive, in line with the proposed mechanism that aid increases in response the county being a splinter, but not significant. Finally, the lagged share of votes has a negative effect on the “splinter” dummy, suggesting that counties that voted less for the incumbent previously are more likely to become a splinter.
1.7
Conclusion
Given that many developing countries are neither fully democratic nor fully autocratic either, it is pertinent to investigate how semi-democracies or semi-autocracies operate. The consequences of foreign aid might be different in such countries, particularly with regards to elections. Using geocoded sub-national data on ODA and three presidential election waves in Uganda, we find that aid has a potential positive impact on the incumbent’s vote share, particularly when combined with administrative unit divisions, suggesting that aid could be used by the incumbent for his own electoral benefit. The magnitude of the effect is small but non-negligible.
Working at the local level allows us to focus on within country variation and to a certain extent to control for potential confounding effects through the inclusion of county and district-year fixed effects. However a major caveat is that we do not completely remove the endogeneity and the model is still susceptible to endogeneity at the county-year level. Furthermore, using the simultaneous equations model, we explore the mechanisms that could be behind our results. We find evidence that counties that voted less for the incumbent in previous elections are more likely to become “splinter” counties, which suggests these counties are targeted for splitting. Our approach contributes to an understanding of the how aid could impact elections and provides an important link with the phenomenon of administrative unit division, which is widespread in Africa. The Ugandan evidence presented here could provide insights to other African countries.
Overall, we contribute to the expanding literature on the effects of aid at the local level and to the literature on the governance impacts of aid. We provide initial evidence of a potential unintended effect of aid. Further research on different countries and other types of elections (e.g., parliamentary elections) could clarify other mechanisms through which aid can impact the electoral outcomes in the recipient countries and further inform donors.