HAL Id: hal-03139779
https://hal.inrae.fr/hal-03139779
Submitted on 12 Feb 2021
HAL is a multi-disciplinary open access
archive for the deposit and dissemination of
sci-entific research documents, whether they are
pub-lished or not. The documents may come from
teaching and research institutions in France or
abroad, or from public or private research centers.
L’archive ouverte pluridisciplinaire HAL, est
destinée au dépôt et à la diffusion de documents
scientifiques de niveau recherche, publiés ou non,
émanant des établissements d’enseignement et de
recherche français ou étrangers, des laboratoires
publics ou privés.
Distributed under a Creative Commons Attribution| 4.0 International License
A global database of soil nematode abundance and
functional group composition
Johan van den Hoogen, Stefan Geisen, Diana Wall, David Wardle, Walter
Traunspurger, Ron de Goede, Byron Adams, Wasim Ahmad, Howard Ferris,
Richard Bardgett, et al.
To cite this version:
Johan van den Hoogen, Stefan Geisen, Diana Wall, David Wardle, Walter Traunspurger, et al.. A
global database of soil nematode abundance and functional group composition. Scientific Data ,
Nature Publishing Group, 2020, 7 (1), pp.103. �10.1038/s41597-020-0437-3�. �hal-03139779�
a global database of soil nematode
abundance and functional group
composition
Johan van den Hoogen et al.
#as the most abundant animals on earth, nematodes are a dominant component of the soil
community. they play critical roles in regulating biogeochemical cycles and vegetation
dynamics within and across landscapes and are an indicator of soil biological activity. Here,
we present a comprehensive global dataset of soil nematode abundance and functional group
composition. This dataset includes 6,825 georeferenced soil samples from all continents and
biomes. For geospatial mapping purposes these samples are aggregated into 1,933 unique 1-km
pixels, each of which is linked to 73 global environmental covariate data layers. Altogether,
this dataset can help to gain insight into the spatial distribution patterns of soil nematode
abundance and community composition, and the environmental drivers shaping these patterns.
Background & Summary
To generate a global and quantitative understanding of the biogeography of soil organisms, critical players in global biogeochemistry, large and comprehensive datasets are needed. Due to methodological challenges and the labor-intensiveness of characterizing soil biota, many previous studies have focused on a relatively limited number of spatially distinct sampling sites. Whilst these studies are valuable to dissect local and regional scale patterns, they may not hold the depth of information that is needed to feed global-scale models1.
Soil nematodes are present in all trophic levels in the soil food web, play central roles in regulating carbon and nutrient dynamics, control soil microorganism populations2–4 and, consequently, are good indicators of biological activity in soils5. Here, we present a dataset of 6,825 spatially distinct soil nematode samples from all terrestrial biomes and continents, an updated version of the dataset that was originally used to create a global map of soil nematode abundance and community composition6. The original version contained 6,759 samples; the updated version that we present here contains 66 additional samples located in Ireland. This dataset can prove useful to disentangle the effects of environmental drivers of soil nematode abundance and community composition across broad spatial scales. The original version of this dataset was used to create a high-resolution map of soil nematode abundance, which revealed that nematodes are present in higher densities in sub-Arctic regions compared to tropical and temperate regions6. Soil properties are the primary drivers of soil nematode abundance, whereas cli-matic conditions have an indirect effect by altering soil conditions6. The overall latitudinal gradient, with decreas-ing abundance towards the equator, is the inverse of patterns often observed in aboveground organisms, but is in line with what has been shown for other belowground biota7,8.
Besides data on the total number of nematodes per sample, the dataset contains quantification of the abun-dance of individuals in different functional groups of soil nematodes classified according to five feeding guilds9: bacterivores, fungivores, herbivores, omnivores, predators. For geospatial mapping, these sampling data were aggregated into 1,933 unique 30 Arc-seconds pixels (~1 km2 at the equator) and combined with 73 global
covar-iate layers including information on soil physiochemical properties, and vegetation, climate, and topographic, anthropogenic, and spectral reflectance information. We intend to continue expanding the dataset and are open to contributions of additional data.
Methods
Data collection.
The methods described here are expanded versions of descriptions in our related work6. The dataset encompasses georeferenced data on soil nematode abundances according to trophic groups, which were assigned according to Yeates et al.9. In total, the dataset contains 6,825 georeferenced samples collected in#A full list of authors and their affiliations appears at the end of the paper.
DATA DeScripTor
www.nature.com/scientificdata
www.nature.com/scientificdata/
the top 15 cm of soils, including 66 additional samples compared to the dataset used in our related work6. Across all samples, 67.2% originate from natural sites and 32.8% from agricultural or managed sites. Nematodes were extracted from soil using standard elutriation methods, including the Baermann funnel method10, sugar-floata-tion/centrifugation11,12, decanting and sieving13, Oostenbrink elutriation14, Whitehead tray15 and Seinhorst elutri-ation16. These methods may include variations of the original methods. Most samples present in the dataset were obtained using the Baermann funnel method, followed by Oostenbrink elutriation and sugar-flotation (Jenkins/ Freckman) (Fig. 1). Per-sample method descriptions, sampling depth, and data provider information are available via figshare17. For previously published data, we provide references to the original publications of the respective samples.
Environmental metadata: soil, climate, topography, vegetation, anthropogenic characteristics.
For all sampling locations we provide paired environmental metadata, which can be used to provide insight into the environmental drivers of soil nematode abundance and community composition across spatial scales. To do so, we first prepared a covariate stack of 73 layers, for which we downloaded the covariate layers as geotiff files.
0 1000 2000 3000 Baer mann funne l Oostenbr ink elutr iator Sugar floatation Seinhorst elut riation Decanting and si eving Whitehead tr ay Number of sample s
Fig. 1 Nematode extraction methods used. The majority of the samples were processed using the Baermann funnel method and Oostenbrink elutriation.
Fig. 2 Data processing approach. 6,825 georeferenced samples are included in the raw dataset. These sampling locations represent 1,933 unique 30 arc-seconds pixels (~1 km at the equator), or 1,895 pixels excluding locations falling off the covariate grid. To gain mechanistic insights and discern the major environmental drivers of nematode abundance, these pixels were sampled across 73 global covariate layers.
Next, all layers were resampled and reprojected to a unified pixel grid in EPSG:4326 (WGS84) at 30 arc-seconds resolution. Layers with a higher original pixel resolution were downsampled using a mean aggregation method; layers with a lower original resolution were resampled using simple upsampling (i.e. without interpolation) to align with the higher resolution grid. Next, all layers were converted into a multiband image, i.e. the covariate stack, that was used for pixel sampling.
To prepare the dataset for this purpose, we first need to match the resolution of the dataset to that of the global covariate layer stack that contains the environmental metadata: 30 arc-seconds, which corresponds to approxi-mately 1-km2 at the equator. In this step, we aggregate all data points falling within the same pixel by taking the
mean value, resulting in 1,933 unique pixels. We stress that the covariate layer stack has no coverage in Antarctica and therefore the 503 samples located in this region were dropped at the pixel aggregation step. Next, pixel values across the 73 layers were retrieved and stored as a csv file. This dataset is available via figshare17. We stress that, as some covariate layers were reprocessed since the publication of the nematode mapping study6, there are some slight differences in the sampled covariate data in this updated version. The approach is visualized in Fig. 2.
Full metadata, including descriptions, units, and source information of all global covariate layers are avail-able via figshare17. In short, information about soil texture and physiochemical properties was obtained from SoilGrids18, limited to the upper soil layer (top 15 cm). Climate information was obtained from WorldClim19 (version 2), which includes climate data averaged across 1970–2000 (http://www.worldclim.org/). Plant produc-tivity data (i.e. EVI, NDVI, Gpp, Npp) and spectral reflectance data were obtained from Google Earth Engine (https://developers.google.com/earth-engine/datasets/). Aridity index and potential evapotranspiration lay-ers were obtained from CGIAR20 (version 1) (http://www.cgiar-csi.org/data/global-aridity-and-pet-database). Anthropogenic information (i.e. human development, population density) was obtained from WCS21 (http://
wcshumanfootprint.org) and from Tuanmu and Jetz22. Aboveground biomass data was obtained from CDIAC23
Group mean median n
Bacterivores 1052 250 6788 Fungivores 438 84 6782 Herbivores 656 171 6784 Omnivores 325 41 6787 Predators 119 6 6706 Total_Number 2653 857 6825
Table 1. Mean and median nematode abundances, per trophic group. Values are reported as the number of nematodes per 100 g dry soil.
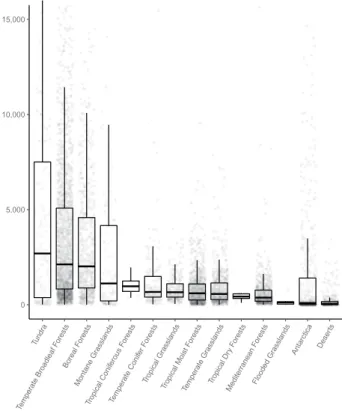
0 5,000 10,000 15,000 Tund ra Temperate Broadleaf Forest s Boreal Forest s Montane Grasslands Tropical Coni ferous Forest s Temperate Coni fer F orest s Tropical Grasslands Tropical Moist Forest s Temperate Gr asslands Tropical Dr y Fo rest s Mediter ranean Forest s Flooded Gra ssla nds Antarctic a Deser ts
Fig. 3 Nematode communities vary across biomes. The median and interquartile range of nematode abundances (n = 6,825) per biome from all continents.
www.nature.com/scientificdata
www.nature.com/scientificdata/
(https://cdiac.ess-dive.lbl.gov/epubs/ndp/global_carbon/carbon_documentation.html). Radiation data was obtained from CliMond24 (https://www.climond.org/BioclimRegistry.aspx#BioclimFAQ). WWF Ecoregion classifications were used to categorize sampling locations into biomes (https://www.worldwildlife.org/ biome-categories/terrestrial-ecoregions).
Data records
All data are available via figshare17. Raw nematode abundance data (6,825 samples) are available as a csv file: “nematode_full_dataset_wBiome.csv”. Sample IDs 20001–20066 are samples not present in our related work6. Abundance data aggregated into 30 Arc-seconds pixels (1,933 unique locations), combined with environmental covariate data are available as a csv file: “nematode_abundance_aggregated_wCovar.csv”. Full metadata, including descriptions, units, and source information, of all global covariate layers are available as a csv file: “metadata.csv”.
technical Validation
Soil nematode abundances are highly variable within and across terrestrial biomes6. On average, the number of nematodes per 100 g dry soil is in the few hundred – few thousand range (median = 859, mean = 2,671), although the highest recorded abundances exceed 20,000 nematodes per 100 g dry soil. Across biomes, bacteri-vores are the most abundant trophic group and predatory nematodes the least abundant (Table 1). Overall, the highest abundances are observed in tundra (median = 2,695 nematodes per 100 g dry soil), temperate broadleaf forest (median = 2,119) and in boreal forest (median = 2,016) soils. The lowest abundances are observed in Mediterranean forest (median = 374), flooded grasslands (median = 124), Antarctic (median = 89) and hot desert
Biome mean median n
Tundra 7298 2695 148
Temperate Broadleaf Forests 4465 2120 2175
Boreal Forests 3959 2016 669
Montane Grasslands 6096 1120 116 Tropical Coniferous Forests 1000 970 8 Temperate Conifer Forests 1800 670 158 Tropical Grasslands 863 657 272 Tropical Moist Forests 914 601 968 Temperate Grasslands 945 565 627 Tropical Dry Forests 430 431 11 Mediterranean Forests 619 374 704 Flooded Grasslands 183 124 7
Antarctica 2245 89 503
Deserts 193 44 361
Table 2. Mean and median nematode abundances, per biome. Values are reported as the total number of nematodes per 100 g dry soil.
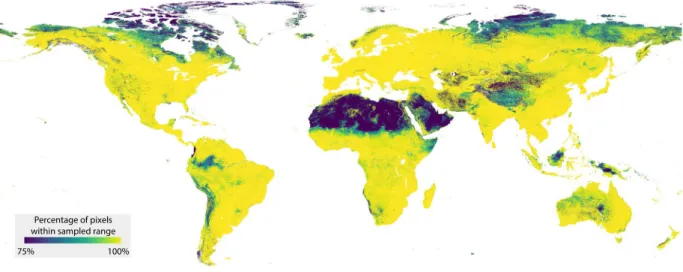
Percentage of pixels within sampled range
75% 100%
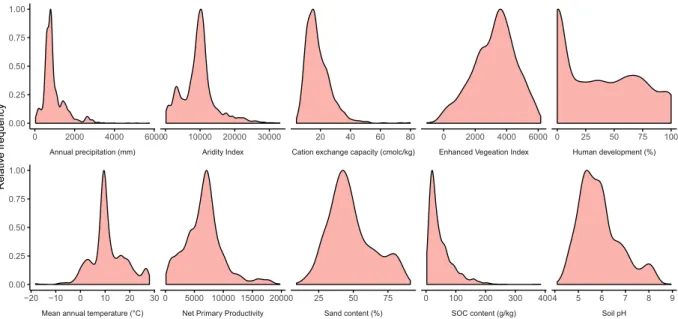
Fig. 4 Environmental representativeness of the dataset. The sampled locations represent a wide range of environmental conditions. For illustrative purposes, ten environmental variables were chosen from the full set of 73.
(median = 44) soils (Fig. 3, Table 2). We stress that these numbers slightly differ from the values reported in our accompanying paper6, where we reported the aggregated pixel median values.
As with any global ecological dataset, combining data from many researchers across the world, there is inher-ent variation in the data. Also, the differinher-ent nematode extraction methods may vary in their efficiencies25,26. This underscores the need for large datasets for global scale analyses of ecological patterns. When a sufficiently large sample size allows to detect strong patterns through this statistical noise, we can be confident that a biological pattern exists6. As a consequence, there may be limitations to the use of the dataset at finer scales. Yet, by subset-ting the dataset by extraction method or region, for example, it can serve as a starsubset-ting point for local scale studies.
Environmental representativeness of the dataset.
To evaluate the comprehensiveness of the data-set, we explored the environmental conditions that the sampling locations represent. Across individual envi-ronmental variables, the samples represent a wide range of envienvi-ronmental conditions (Fig. 4). To gain spatial insight into the environmental representativeness of the dataset, information that is important when comparing observations across spatial scales, we evaluated how the multidimensional environmental space covered by the dataset compares to the global environmental space. To do so, we used a similar approach as in our previous work6. First, we set out to reduce the computational load, as exploring the full stack of 73 global environmental covariate layers across ~210 million terrestrial pixels would require exorbitantly large computing power. To this end, we transformed the set of global environmental covariate layers into Principal Component (PC) space. We reduced the number of selected PCs to 17, collectively explaining more than 90% of variation. Next, we assessed the proportion of the world’s terrestrial pixels falling within convex hulls of the 136 bivariate combinations of the 17 PCs. The resulting map provides a spatially-explicit depiction of the representativeness of the dataset, showing that the majority of the terrestrial pixels fall within these convex hulls, with most of the outliers existing in arid regions such as the Sahara and Arabian Deserts, and in sub-arctic regions such as the far north of Canada and Russia (Fig. 5).code availability
Code is available via https://github.com/hooge104/2020_global_nematode_dataset.
Received: 5 November 2019; Accepted: 2 March 2020; Published online: 26 March 2020
references
1. Crowther, T. W. et al. The global soil community and its influence on biogeochemistry. Science 365, eaav0550 (2019).
2. Crowther, T. W., Boddy, L. & Jones, T. H. Species-specific effects of soil fauna on fungal foraging and decomposition. Oecologia 167, 535–545 (2011).
3. Ferris, H. Contribution of nematodes to the structure and function of the soil food web. J. Nemat. 42, 63–67 (2010).
4. Ingham, R. E., Trofymow, J. A., Ingham, E. R. & Coleman, D. C. Interactions of bacteria, fungi, and their nematode grazers: effects on nutrient cycling and plant growth. Ecol. Monogr. 55, 119–140 (1985).
5. Neher, D. Role of nematodes in soil health and their use as indicators. J. Nemat. 33, 161–168 (2001).
6. van den Hoogen, J. et al. Soil nematode abundance and functional group composition at a global scale. Nature 572, 194–198 (2019). 7. Bahram, M. et al. Structure and function of the global topsoil microbiome. Nature 560, 233–237 (2018).
8. Phillips, H. R. P. et al. Global distribution of earthworm diversity. Science 366, 480–485 (2019).
Mean annual temperature (°C) Net Primary Productivity Sand content (%) SOC content (g/kg) Soil pH Annual precipitation (mm) Aridity Index Cation exchange capacity (cmolc/kg) Enhanced Vegeation Index Human development (%)
−20 −10 0 10 20 30 0 5000 10000 15000 20000 25 50 75 0 100 200 300 4004 5 6 7 8 9 0 2000 4000 60000 10000 20000 30000 20 40 60 80 0 2000 4000 6000 0 25 50 75 100 0.00 0.25 0.50 0.75 1.00 0.00 0.25 0.50 0.75 1.00 Relativ e frequenc y
Fig. 5 Assessment of the representativeness of the dataset in multivariate environmental space. The map displays the percentage of pixels that fall within the convex hulls of the first 17 principal component spaces (collectively covering >90% of the sample space variation).
www.nature.com/scientificdata
www.nature.com/scientificdata/
9. Yeates, G. W., Bongers, T., De Goede, R. G. M., Freckman, D. W. & Georgieva, S. S. Feeding habits in soil nematode families and genera–an outline for soil ecologists. J. Nematol. 25, 315–331 (1993).
10. Baermann, G. Eine einfache methode zur auffindung von Ancylostomum (Nematoden) larven in erdproben. Geneeskd Tijdschr Ned
Indie 57, 131–137 (1917).
11. Jenkins, W. R. A rapid centrifugal-flotation technique for separating nematodes from soil. Plant Dis. Rep. 48, 692 (1964). 12. Freckman, D. W. & Virginia, R. A. Low-diversity antarctic soil nematode communities: distribution and response to disturbance.
Ecology 78, 363–369 (1997).
13. Flegg, J. J. M. Extraction of Xiphinema and Longidorus species from soil by a modification of Cobb’s decanting and sieving technique.
Ann. Appl. Biol. 60, 429–437 (1967).
14. Oostenbrink, M. Estimating nematode populations by some selected methods. Nematology 6, 85–102 (1960).
15. Whitehead, A. G. & Hemming, J. R. A comparison of some quantitative methods of extracting small vermiform nematodes from soil. Ann.Appl. Biol. 55, 25–38 (1965).
16. Seinhorst, J., others. The relation between nematode density and damage to plants. Nematologica 11, 137–154 (1965).
17. van den Hoogen, J. et al. A global database of soil nematode abundance and functional group composition. figshare, https://doi. org/10.6084/m9.figshare.c.4718003 (2020).
18. Hengl, T. et al. SoilGrids250m: Global gridded soil information based on machine learning. PLoS ONE 12, e0169748 (2017). 19. Fick, S. E. & Hijmans, R. J. WorldClim 2: new 1-km spatial resolution climate surfaces for global land areas. Int. J. Climatol 37,
4302–4315 (2017).
20. Zomer, R. J., Trabucco, A., Bossio, D. A. & Verchot, L. V. Climate change mitigation: A spatial analysis of global land suitability for clean development mechanism afforestation and reforestation. Agr. Ecosyst. Environ. 126, 67–80 (2008).
21. Venter, O. et al. Global terrestrial human footprint maps for 1993 and 2009. Sci. Data 3, 160067 (2016).
22. Tuanmu, M.-N. & Jetz, W. A global 1-km consensus land-cover product for biodiversity and ecosystem modelling: Consensus land cover. Global Ecol. Biogeogr. 23, 1031–1045 (2014).
23. Ruesch, A. & Gibbs, H. K. New IPCC Tier-1 global biomass carbon map for the year 2000, https://cdiac.ess-dive.lbl.gov (2008). 24. Kriticos, D. J. et al. CliMond: global high-resolution historical and future scenario climate surfaces for bioclimatic modelling:
CliMond: climate surfaces for bioclimatic modelling. Methods Ecol. Evol. 3, 53–64 (2012).
25. De Goede, R. G. & Verschoor, B. The nematode extraction efficiency of the Oostenbrink elutriator-cottonwool filter method with special reference to nematode body size and life Strategy. Nematology 2, 325–342 (2000).
26. Cesarz, S., Schulz, A. E., Beugnon, R. & Eisenhauer, N. Testing soil nematode extraction efficiency using different variations of the Baermann funnel method. Soil Org. 91, 61–72 (2019).
Acknowledgements
We are thankful to Walter S. Andriuzzi and Louise E. Jackson for help in the initial phases of this study and for providing data. This research was supported by a grant from DOB Ecology to T.W.C., a grant from the Netherlands Organization for Scientific Research (grant 016.Veni.181.078) to S.G., grants from NSF (OPP 1115245, 1341736, 0840979) to B.J.A., by a Ramon y Cajal fellow award (RYC-2016-19939) to R.C.H., a grant from UNEP & Global Environment Facility to J.E.C., grants from NERC’s Soil Security Programme to R.D.B. (NE/M017028/1) T.C. (NE/M017036/1), a grant from FAPEMIG/FAPESP/VALE S.A.(CRA-RDP-00136-10) to L.B.C., through the strategic programme UID/BIA/04050/2013 (POCI-01-0145-FEDER-007569) awarded to S.R.C., a grant from CNPq PROTAX (562346/2010-4) to J.M.d.C.C., a grant from DFG (CRC990) to V.K. and S.S., a grant from the MSHE of Russia (AAAA-A17-117112850234-5) to A.A.K., grants from the Chinese Academy of Sciences (XDB15010402) and the National Natural Science Foundation of China (41877047) to Q.L., grants from the National Natural Science Foundation of China (31330011, 31170484) to W.L., grants from NERC (NE/ M017036/1) to M.M., grants from the Spanish Ministry of Innovation (CGL2009-14686-C02-01/02, CGL2013-43675-P) to J.A.R.M., grant from the Spanish Ministry of Innovation (RYC-2016-19939) to R.C.H., grants from NSF (DEB-0450537, DEB-1145440) to P.M., T.O.P. and K. Powers, grants from the German Academic Exchange Service (PKZ 91540366) and NAFOSTED (106.05–2017.330) to T.A.D.N., by an ARC Discovery project (DP150104199) to U.N.N., by the National Key Research and Development Program of China (2016YFC0502101) and the National Natural Science Foundation of China (31370632) to K. Pan, a ERC Research Council Advanced grant (ERC-Adv 323020 SPECIALS) to W.H.v.d.P, a grant from the Natural Environment Research Council (NERC) to D.G.W., a grant from BAPHIQ (106AS-9.5.1-BQ-B3) to J.-i.Y., a grant from the Russian Foundation for Basic Research (18-29-05076) to A.V.T. The James Hutton Institute receives financial support from the Scottish Government Rural and Environment Science and Analytical Services (RESAS) division. Investigations in Northwest Russia were carried out under state order for IB KarRC RAS and are partially supported by the Russian Foundation for Basic Research (18-34-00849).
author contributions
J.v.d.H., S.G., D.R. and T.W.C. designed and performed the data analyses. S.G., H.F., W.T., D.A.W., R.G.M.d.G., B.J.A., W.A., W.S.A., R.D.B., M.B., R.C.H., J.E.C., T.C., X.C., S.R.C., R.C., J.M.C.C., M.D., L.B.C., D.D., M.E., B.S.G., C.G., K.H., D.K., P.K., A.K., G.K., V.K., A.A.K., Q.L., W-J.L., M.M., M.M., J.A.R.M., E. Matveeva, E.H.M., E. Mzough, C.M., P.M., R.N., T.A.D.N., U.N.N., H.O., J.E.P.R., K.P., V.P., L.P., J.C.P.S., C.P., T.O.P., K.P., C.W.Q., S.R., S.M., S.S., H.S., A.S., A.V.T., J.T., W.H.v.dP., M.V., C.V., L.W., D.H.W., R.A.W., D.G.W., J.-I.Y., O.S. R.B., Z.F., and A.M.K. contributed data. J.v.d.H., S.G. and T.W.C. wrote the manuscript.
competing interests
The authors declare no competing interests.
additional information
Correspondence and requests for materials should be addressed to J.v.d.H., S.G. or T.W.C. Reprints and permissions information is available at www.nature.com/reprints.
Publisher’s note Springer Nature remains neutral with regard to jurisdictional claims in published maps and institutional affiliations.
Open Access This article is licensed under a Creative Commons Attribution 4.0 International License, which permits use, sharing, adaptation, distribution and reproduction in any medium or format, as long as you give appropriate credit to the original author(s) and the source, provide a link to the Cre-ative Commons license, and indicate if changes were made. The images or other third party material in this article are included in the article’s Creative Commons license, unless indicated otherwise in a credit line to the material. If material is not included in the article’s Creative Commons license and your intended use is not per-mitted by statutory regulation or exceeds the perper-mitted use, you will need to obtain permission directly from the copyright holder. To view a copy of this license, visit http://creativecommons.org/licenses/by/4.0/.
The Creative Commons Public Domain Dedication waiver http://creativecommons.org/publicdomain/zero/1.0/
applies to the metadata files associated with this article. © The Author(s) 2020
Johan van den Hoogen
1,61✉, Stefan Geisen
2,61✉, Diana H. Wall
3, David a. Wardle
4,
Walter traunspurger
5, ron G. M. de Goede
6, Byron J. adams
7, Wasim ahmad
8,
Howard Ferris
9, richard D. Bardgett
10, Michael Bonkowski
11, raquel campos-Herrera
12,
Juvenil e. cares
13, Tancredi caruso
14, Larissa de Brito caixeta
13, Xiaoyun chen
15,
Sofia r. costa
16, rachel creamer
6, José Mauro da cunha e castro
17, Marie Dam
18,
Djibril Djigal
19, Miguel Escuer
20, Bryan S. Griffiths
21, carmen Gutiérrez
20, Karin Hohberg
22,
Daria Kalinkina
23, paul Kardol
24, alan Kergunteuil
25, Gerard Korthals
2,
Valentyna Krashevska
26, alexey a. Kudrin
27, Qi Li
28, Wenju Liang
28, Matthew Magilton
29,
Mariette Marais
30, José Antonio rodríguez Martín
31, elizaveta Matveeva
23,
El Hassan Mayad
32, e. Mzough
32, christian Mulder
33, peter Mullin
34, roy Neilson
35,
T. A. Duong Nguyen
11,36, Uffe N. Nielsen
37, Hiroaki okada
38, Juan emilio palomares rius
39,
Kaiwen pan
40, Vlada peneva
41, Loïc pellissier
42,43, Julio carlos pereira da Silva
44,
camille pitteloud
42, Thomas o. powers
34, Kirsten powers
34, casper W. Quist
45,46,
Sergio rasmann
47, Sara Sánchez Moreno
48, Stefan Scheu
26,49, Heikki Setälä
50,
Anna Sushchuk
23, alexei V. tiunov
51, Jean trap
52, Mette Vestergård
53, cecile Villenave
52,54,
Lieven Waeyenberge
55, rutger A. Wilschut
2, Daniel G. Wright
56, aidan M. Keith
56,
Jiue-in Yang
57, olaf Schmidt
58, r. Bouharroud
59, Z. Ferji
60, Wim H. van der putten
2,46,
Devin routh
1& Thomas W. crowther
1✉
1Department of environmental Systems Science, institute of integrative Biology, etH Zürich, Zürich, Switzerland. 2Department of terrestrial ecology, netherlands institute of ecology, Wageningen, the netherlands. 3Department
of Biology and School of Global environmental Sustainability, colorado State University, fort collins, cO, USA.
4Asian School of the environment, nanyang technological University, Singapore, Singapore. 5Animal ecology,
Bielefeld University, Bielefeld, Germany. 6Soil Biology Group, Wageningen University & Research, Wageningen,
the netherlands. 7Department of Biology, evolutionary ecology Laboratories, Monte L. Bean Museum, Brigham
Young University, Provo, Ut, USA. 8nematode Biodiversity Research Laboratory, Department of Zoology, Aligarh
Muslim University, Aligarh, india. 9Department of entomology & nematology, University of california, Davis, cA,
USA. 10Department of earth and environmental Sciences, the University of Manchester, Manchester, UK. 11institute
of Zoology, terrestrial ecology, University of cologne and cluster of excellence on Plant Sciences (cePLAS), cologne, Germany. 12instituto de ciencias de la Vid y del Vino (Universidad de La Rioja, cSic, Gobierno de La Rioja),
Logroño, Spain. 13Department of Phytopathology, institute of Biological Sciences, University of Brasília, Brasília,
Brazil. 14School of Biology and Environmental Science, University College Dublin, Belfield, Dublin 4, Ireland. 15Soil
ecology Laboratory, college of Resources and environmental Sciences, nanjing Agricultural University, nanjing, china. 16centre of Molecular and environmental Biology, University of Minho, Braga, Portugal. 17empresa Brasileira
de Pesquisa Agropecuária (embrapa), centro de Pesquisa Agropecuária do trópico Semiárido, Petrolina, Brazil.
18Zealand institute of Business and technology, Slagelse, Denmark. 19institut Sénégalais de Recherches Agricoles/
cDH, Dakar, Senegal. 20instituto de ciencias Agrarias, cSic, Madrid, Spain. 21crop and Soil Systems Research
Group, SRUc, edinburgh, UK. 22Senckenberg Museum of natural History Görlitz, Görlitz, Germany. 23institute
of Biology of Karelian Research centre, Russian Academy of Sciences, Petrozavodsk, Russia. 24Department of
forest ecology and Management, Swedish University of Agricultural Sciences, Umeå, Sweden. 25Laboratory of
functional ecology, institute of Biology, University of neuchâtel, neuchâtel, Switzerland. 26J. f. Blumenbach
institute of Zoology and Anthropology, University of Göttingen, Göttingen, Germany. 27institute of Biology of
the Komi Scientific Centre, Ural Branch of the Russian Academy of Sciences, Syktyvkar, Russia. 28Erguna
www.nature.com/scientificdata
www.nature.com/scientificdata/
29School of Biological Sciences, institute for Global food Security, Queen’s University of Belfast, Belfast, UK. 30nematology Unit, Agricultural Research council, Plant Health and Protection, Pretoria, South Africa. 31Department
of environment, instituto nacional de investigación y tecnología Agraria y Alimentaria, Madrid, Spain. 32Laboratory
of Biotechnology and Valorization of natural Resources, faculty of Science Agadir, ibn Zohr University, Agadir, Morocco. 33Department of Biological, Geological and environmental Sciences, University of catania, catania, italy. 34Department of Plant Pathology, University of Nebraska-Lincoln, Lincoln, NE, USA. 35ecological Sciences, the
James Hutton institute, Dundee, UK. 36institute of ecology and Biological Resources, Vietnam Academy of Science
and technology, Hanoi, Vietnam. 37Hawkesbury institute for the environment, Western Sydney University, Penrith,
new South Wales, Australia. 38nematode Management Group, Division of Applied entomology and Zoology,
central Region Agricultural Research center, nARO, tsukuba, Japan. 39institute for Sustainable Agriculture,
Spanish national Research council, córdoba, Spain. 40ecological Processes and Biodiversity, center for ecological
Studies, chengdu institute of Biology, chinese Academy of Sciences, chengdu, china. 41institute of Biodiversity
and ecosystem Research, Bulgarian Academy of Sciences, Sofia, Bulgaria. 42Landscape ecology, institute of
terrestrial ecosystems, Department of environmental Systems Science, etH Zürich, Zürich, Switzerland. 43Swiss
federal Research institute WSL, Birmensdorf, Switzerland. 44Department of Phytosanitary Defense, Universidade
federal de Santa Maria, Santa Maria, RS, Brazil. 45Biosystematics Group, Wageningen University, Wageningen,
the netherlands. 46Laboratory of nematology, Wageningen University, Wageningen, the netherlands. 47institute
of Biology, University of neuchâtel, neuchâtel, Switzerland. 48Plant Protection Products Unit, instituto nacional
de investigación y tecnología Agraria y Alimentaria, Madrid, Spain. 49centre of Biodiversity and Sustainable Land
Use, University of Göttingen, Göttingen, Germany. 50faculty of Biological and environmental Sciences, ecosystems
and environment Research Programme, University of Helsinki, Lahti, finland. 51A. n. Severtsov institute of ecology
and evolution, Russian Academy of Sciences, Moscow, Russia. 52eco&Sols, University of Montpellier, ciRAD, inRA,
iRD, Montpellier SupAgro, Montpellier, france. 53Department of Agroecology, AU-Flakkebjerg, Aarhus University,
Slagelse, Denmark. 54eLiSOL environnement, congénies, france. 55Plant Sciences Unit, flanders Research
institute for Agriculture, fisheries and food, Merelbeke, Belgium. 56UK centre for ecology & Hydrology, Lancaster
environment centre, Lancaster, UK. 57Department of Plant Pathology and Microbiology, national taiwan University,
taipei, taiwan. 58UCD School of Agriculture and Food Science, University College Dublin, Belfield, Dublin 4, Ireland. 59Research Unit of integrated crop Production, centre Regional de la Recherche Agronomique d’Agadir, Agadir,
Morocco. 60institut Agronomique et Vétérinaire Hassan ii, campus d’Agadir, Département de Protection des Plantes,
Agadir, Morocco. 61these authors contributed equally: Johan van den Hoogen, Stefan Geisen. ✉e-mail: johan.

![[PDF] Support pour apprendre word par la pratique | Cours informatique](data:image/gif;base64,R0lGODlhAQABAIAAAP///wAAACH5BAEAAAAALAAAAAABAAEAAAICRAEAOw==)