HAL Id: cea-01842363
https://hal-cea.archives-ouvertes.fr/cea-01842363
Submitted on 2 Jun 2021
HAL is a multi-disciplinary open access archive for the deposit and dissemination of sci-entific research documents, whether they are pub-lished or not. The documents may come from teaching and research institutions in France or abroad, or from public or private research centers.
L’archive ouverte pluridisciplinaire HAL, est destinée au dépôt et à la diffusion de documents scientifiques de niveau recherche, publiés ou non, émanant des établissements d’enseignement et de recherche français ou étrangers, des laboratoires publics ou privés.
Defect imaging on CFRP and honeycomb composite
structures by guided waves generated and detected by a
sparse PZT array
Andrii Kulakovskyi, Bastien Chapuis, Olivier Mesnil, Nas-Redine Bedreddine,
Oscar D’almeida, Alain Lhémery
To cite this version:
Andrii Kulakovskyi, Bastien Chapuis, Olivier Mesnil, Nas-Redine Bedreddine, Oscar D’almeida, et al.. Defect imaging on CFRP and honeycomb composite structures by guided waves generated and detected by a sparse PZT array. Structural Health Monitoring 2017, Sep 2017, Stanford, United States. �10.12783/shm2017/13888�. �cea-01842363�
COVER SHEET
NOTE:
· Please attach the signed copyright release form at the end of your paper and
upload as a single ‘pdf’ file
· This coversheet is intended for you to list your article title and author(s) name
only
· This page will not appear in the book or on the CD-ROM
Title: Defect imaging on CFRP and honeycomb composite structures by guided waves generated and detected by a sparse PZT array
Authors: Andrii KULAKOVSKYI Bastien CHAPUIS Olivier MESNIL Nas-Redine BEDREDDINE Oscar D’ALMEIDA Alain LHÉMERY Corresponding author: Bastien Chapuis CEA LIST
Department of Imaging and Simulation for Control (DISC) 91191 Gif-sur-Yvette
France
Tel: +33 1 69 08 93 32
(FIRST PAGE OF ARTICLE)
ABSTRACT
Sandwich honeycomb structures (aluminum core bonded to Carbon Fiber Reinforced Polymer (CFRP) sheets on either side) are widely employed in the aerospace industry for their high strength to mass ratio. However, they might be subjected to damages such as delaminations of the composite sheets or debondings between the face sheets and the core due to impacts or thermo-mechanical aging. In order to reduce maintaining costs and extend the service time, Guided Waves (GW) based Structural Health Monitoring (SHM) systems are considered an adequate solution. Indeed, GW propagate over long distances and exhibit low attenuation, thus allowing to monitor wide areas with a limited number of sensors. Defect imaging on CFRP composites and honeycomb composite structures using both Delay-And-Sum [1] and correlation-based algorithm Excitelet [2] is presented in this communication.
A machine learning algorithm is finally implemented in order to automatically identify and isolate defects on a given cartography map. The machine learning algorithm is trained on an experimental database of false and positive results obtained on representative specimens.
INTRODUCTION
In the past years, the use of composite materials in the aeronautic industry has considerably increased. This rapid growth is mainly due to the considerable economic benefits due to the mass reduction allowed by the use of composites. These materials are now used for a wide range of complex structures, such as aircraft nacelles, which are of interest in this study. The aircraft nacelle, the housing of the aircraft engine, is _____________
Andrii Kulakovskyi, Safran Tech, Magny-Lès-Hameaux, France ; CEA LIST, NDE Department, Gif-sur-Yvette Cedex, France
Bastien Chapuis & Olivier Mesnil, CEA LIST, NDE Department, Gif-sur-Yvette, France Nas-Redine Bedreddine, Safran Nacelles, Le Havre, France
Oscar D’Almeida, Safran Tech, Magny-Lès-Hameaux, France Alain Lhémery, CEA LIST, NDE Department, Gif-sur-Yvette, France
mostly made of honeycomb composite (aluminum cores encapsulated by carbon fiber based composite sheets on the top and bottom surfaces). These composite structures exhibit excellent strength-to-weight ratio, stiffness, toughness and corrosion resistance.
However, appearance of defects such as face sheets delamination or core-sheet debonding due to impacts or thermo-mechanical aging may decrease these properties. Guided elastic waves are considered an adequate mean to monitor such systems in a Structural Health Monitoring (SHM) context. Indeed, Guided Waves (GW) propagate over long distances with low attenuation, allowing to monitor wide areas with a limited number of sensors [3]. However, the analysis of GW signals is of increasing complexity as the structure becomes more complex, due to their multi-modal and dispersive behavior.
In this study, we mainly focus on damage detection and localization in Carbon Fiber Reinforced Polymer (CFRP) and honeycomb composite structures. Two imaging algorithms, Delay–And-Sum (DAS) [1] and Excitelet [4] are implemented and tested on multiple samples of different materials. A machine learning algorithm is finally implemented in order to automatically identify and isolate defects on a given cartography obtained by GW imaging. The machine learning algorithm is trained on an experimental database of false and positive results obtained on representative specimens.
GUIDED WAVE IMAGING
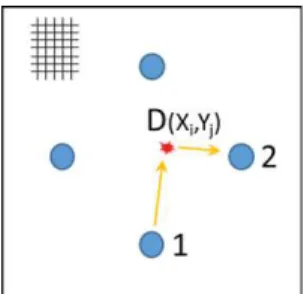
Delay-And-Sum (DAS) and Excitelet are two guided wave based imaging algorithms and require a similar type of measurement procedure. In particular, the knowledge of the initial state of the studied structure, the baseline signal, is required for both methodologies. The specimen of interest is instrumented by a sparse array of piezoelectric (PZT) sensors and each pair of sensors acts sequentially as emitter and receiver of guided waves, thus creating a scan of the specimen. Two identical scans of the studied structure are taken in a healthy and a damaged state. The residual signal is obtained as the difference between both scans, thus removing the incident wave packets and the reflection from the edges. A schematic of the scanning process of the specimens is represented in the Figure 1. For each pair of sensors, the first wave-packets of the residual signal, corresponds to the ‘echoes’ from defect, i.e. the energy reflected from the flaw. In order to build a cartography representing the health of the specimen, the entire upper surface of the specimen is discretized in a grid where each pixel is given a Damage Index (DI) value that can be interpreted as a probability of the presence of a defect presence at each pixel. The methodologies DAS and Excitelet use different strategies to calculate the DI.
Delay and sum (DAS)
The process to compute a DI with DAS is the following: 1) the residual signal is computed as the difference between the scans measured in the reference and a damaged state; 2) For each pair of sensor, the received baseline signal is delayed of the theoretical time of flight, computed using the propagation speed of the GW, creating a DI for this pair of sensors; 3) The DI contribution of each pair is summed for all pair of sensors,
Figure 1. Schematic of the measurement process for guided wave imaging. The blue circles represents PZT transducers acting sequentially as GW emitter and receiver. The red spot
represents the defect reflecting GWs generated by PZT 1 and received by PZT 2.
creating the final DI map. The algorithm DAS requires only the knowledge of the directional group velocity of the GW mode and the frequency of interest. The detailed process of computing a DI with DAS can be found in [5]. Considering that GW are dispersive, it is required to use a single GW mode with a narrow bandwidth excitation in order to mitigate the dispersion effects.
Excitelet
The process to compute a DI with Excitelet is the following: 1) For each pair of sensors and each pixel (Xi, Yi), the theoretical contribution that would be received by the receiver from a wave packet generated by the emitter and reflected by pixel (Xi, Yi) is computed; 2) the correlation coefficient is computed for each pixel of the cartography as the correlation between the theoretical and the measured residual signals. The detailed process of computing a DI with Excitelet can be found in [4]. Unlike DAS, by comparing the measured wave packets to the theoretical ones, the dispersion is taken into account in the process, therefore Excitelet is generally highly accurate but computationally intensive. However, Excitelet requires the knowledge of the dispersion curves of the studied specimen.
In this work, we make the far-field-radiation approximation (FFA) assumption to compute the theoretical signals. For anisotropic samples, the angular dependency of guided waves is measured using a laser vibrometer and taken into account in the computation of the theoretical signals.
EXPERIMENTAL RESULTS
First, two CFRP plates are studied. The first plate is made of 8 layers with a [0°,45°,0°45°]s layup and of dimensions 400 x 400 x 2.2 mm3. The second plate is made
of 21 plies all aligned with the 0° orientation and of dimensions 1000 x 600 x 5.6 mm3.
Four PZT sensors are permanently glued on the first plate, as represented in Figure 3 and six on the second. The excitation signal is a 40 kHz burst modulated by a two-cycle Hann window with an amplitude of 10V. This frequency is chosen as the wave propagated is dominated by the A0 mode under these parameters. Secondly, two
honeycomb composite structures are instrumented as well by four PZT each. Both specimens are made of aluminum honeycomb cores of 29.2 mm in height and 9.375 mm in diameter bounded on each side to 2-layer CRFP plates of 0° orientation and of
0.275 mm in thickness each. The dimension of the first plate is 400 x 400 x 29.75 mm3 while the second if 1000 x 600 x 29.75 mm3. The chosen excitation signal is similar to
the previous by at 25 kHz. For the sake of experiment repeatability, the defect was simulated by attaching magnets of 25 mm in diameter on both sides of the structures. This type of defect is not fully representative of reflective defects but is an easy way to test imaging algorithms capabilities.
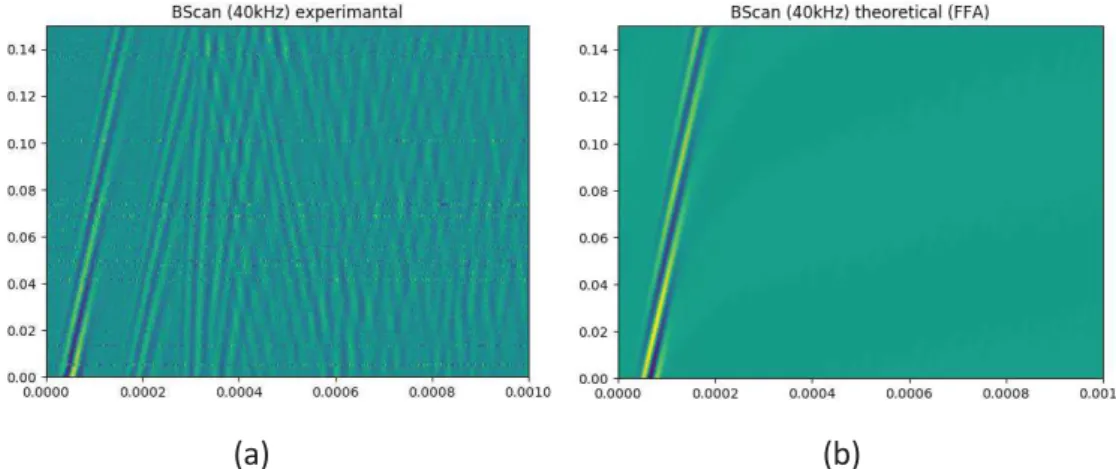
Before applying Excitelet, it is necessary to measure the dispersion relations and validate the far-field approximation. To do so, a Laser Doppler Vibrometer is used to measure B-scans in all directions for all the specimens. Dispersion relations are then extracted and used to compute Excitelet. For illustration purposes, a theoretical signal computed with the FFA is compared in Figure 4 to the same signal measured by Polytech laser Doppler.
The results of DAS for the first CFRP plate and the first honeycomb plate are represented in Figure 3. It is observed that, even though the defects are located, the results are rather inaccurate, which is mainly to the fact that DAS neglects the dispersion. The results for Excitelet on the second CFRP plate and the second honeycomb plate are presented in the Figure 4. It is observed that Excitelet detects the defects in an appropriate fashion even with four or six transducers. The results with Excitelet are more precise than the ones with DAS due to the fact that the dispersion is taken into account. Also, it is observed that with an increasing number of sensors the noise of cartography decreases and the overall quality is improved.
MACHINE LEARNING
Due to the complexity of the analysis of the cartography obtained by both algorithms and the potentially large number of images to analyze, machine learning algorithms are a solution to automatically and quickly analyze GW imaging pictures [7]. In the current context, the Support Vector Machine (SVM) classifier is used to extract the defect position from the cartographies. This approach is potentially transposable to various SHM systems with a large number of sensors with which complex images are obtained.
(a) (b)
Figure 2: Measured (a) and theoretical (with FFA) (b) b-scans for the CFRP plate in the 0° direction. The theoretical b-scan does not take into account edge reflections.
(a) (b) (c)
Figure 3 (a): CFRP plate instrumentation, with 4 PZT transducers and magnets to simulate a reflector, (b): Results of DAS imaging on the CFRP specimen and (c): Results of DAS imaging on
the honeycomb composite structures. The exact defect position is denoted by the red diamond.
(c) (d)
Figure 4. Defect cartographies for CFRP (c) and honeycomb composite structures (d) obtained with Excitelet. Magenta circles denote PZT elements on the plate while the defect position is represented
by the red diamond.
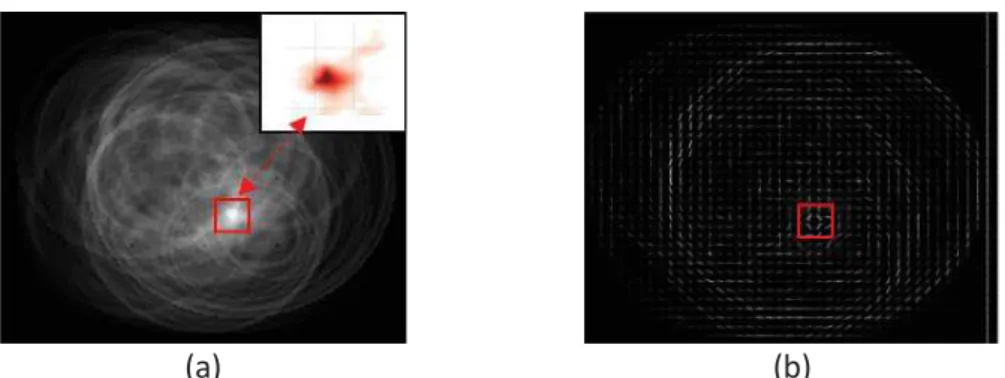
The Histograms of Oriented Gradients (HOG) descriptor is a widely used tool in image processing and is capable of extracting unique features of the object [8]. The gray scaled cartography is analyzed by an 8x8 pixels sliding widow in order to replace each pixels by a scalar among 9 possible values representing the local orientation of the cartography (0°, 20° … 180°). HOG descriptor reduces the dimension of the studied picture and highlights their important features. As the GW imaging algorithms attempt to reconstruct defects as an omnidirectional point sources, the defects detected on the previous cartographies are represented by a vortex of oriented gradients in the pictures processed by the HOG description, as represented in Figure 5.
This process can be automated for defect extraction by using a 2D window with a 50% overlap sliding along the cartography. The features extracted by HOG are feed to a SVM classifier, trained on an experimental database to automatically classify cartographies. Machine learning, and in particular SVM classifiers, is very promising to automate and speed up the processing of data obtained by SHM systems. In future works, the authors will pursue this cartography analysis in order to identify defect size and type.
(a) (b)
Figure 5. Defect cartography (a) and its representation by HOG descriptor (b). Each group of 8x8 pixels is replace by a scalar among 9 possible values to reduce feature dimension. The red square denotes the defect location on the HOG descriptor representation. The appereance of a vortex of the
gradient is observed and represents the defects.
CONCLUSIONS
This work reports on the comparison of DAS and Excitelet Guided Wave imaging algorithms and their application on CFRP and honeycomb composites. The far-field radiation approximation is used as an approximation of the propagated signal in order to compute the wave propagation in composite structures. A support vector classifier is then applied on the images obtained by GW imaging in order to automatically extract the defect location for further analysis. The use of machine learning is encouraging to further study defect description and classification.
REFERENCES
1. Michaels J. E. and Michaels T. E., 2007. Guided wave signal processing and image fusion for in situ damage localization in plates.
2. Ostiguy P.-C., Masson P., Quaegebeur N. et Elkoun S. 2011. Sensitivity of the Excitelet Imaging Algorithm on Material Properties for Isotropic Structures 3. Su Z., Ye, L. et Lu, Y. 2006. Guided lamb waves for identification of damage in
composite structures: a review.
4. Masson P., 2011. Assessment of a novel imaging technique for commercial structural health monitoring and NDT systems.
5. Z Sharif-Khodaei, M H Aliabadi, 2014 Assessment of delay-and-sum algorithms for damage detection in aluminium and composite plates.
6. Chapuis B., 2010. Contrôle santé intégré par méthode ultrasonore des réparations composites collées sur des structures métalliques, PhD thesis (in French).
7. Charles R. Ferrar, Keith Worden 2013. Structural health monitoring: a machine learning perspective.
8. Dalal N. and Triggs B., 2005. Histograms of Oriented Gradients for Human Detection.