Optimized DLLME Method Coupled to HPLC for Simultaneous Analyses
of Benzoates, Sorbates and Methyl p-hydroxyl Benzoates in Fruits Products
Tighrine Abderrahmane
1, Mamou Marzouk
2, Amir Youcef
1*1. Laboratory LQSA, and Laboratory of Food Technology, Department of Agronomy, Faculty FSBSA, University Mouloud Mammeri Tizi Ouzou, 15000, Algeria
2. Laboratory of Analytical Chemistry, Department of Pharmacy, Faculty of Medicine, UMM Tizi Ouzou, 15000, Algeria
* Email: youcefam2008@gmail.com (Corresponding author)
Received: 21 November 2018; Accepted: 14 December 2018; Available online: 15 March 2019
Abstract: We used an accurate and green technique “Dispersive Liquid Liquid Micro Extraction” (DLLME)
followed by HPLC-UV analysis for the analysis of benzoates (BA), sorbates (SA), and p-hydroxyl methyl benzoates (MB) in fruits products. We optimized the extraction parameters by the box Behnken design. We validated the method by using the β accuracy profile including the systematic (trueness) and random (intermediate precision) errors. The extraction efficiency varied from 82.98 to 100.8 %. This method was linear with R2s values
higher than 0.9752 for all the compounds. The repeatability and intermediate precision were less than 3.18 and 12.02 respectively; whereas, the detection limits were respectively 0.304, 0.306 and 0.153 mg/ ml for BA, SA and MB. This method is therefore reliable to the simultaneous quantification of these preservatives in fruit juices, nectars and jams. The levels of these additives in the samples exceeded 833.97 and 290.67 ppm for BA and SA, respectively; while, MB was not detected.
Keywords: Benzoates; Sorbates; DLLME; Fruit juices; HPLC –UV; Jams; Method validation.
1. Introduction
Preservatives such as Benzoic acid, sodium and potassium benzoates, sorbic acid and sorbates, methyl para hydroxyl benzoates or their salts are used widely in different industrial sectors such as pharmaceuticals, cosmetics and food [1- 4]. These compounds are used to extend the shelf life of food products because of their large spectrum activity against bacteria, yeasts, and moulds [4-6].
Toxicological studies carried out on animal models had fixed an acceptable daily intake 25 mg/ kg and 10 mg/kg body weight per day [7] and of 5 mg/kg[8], respectively for BA, SA and MB. Foodstuffs are generally considered as the most important source of these food preservatives. Therefore, international regulatory authorities (Codex
alimentarius) or Algerian regulatory authorities had set the maximum permitted limits in food matrices, which do
not cause adverse effects on consumer’s health. If the added amounts exceed these limits, different potential toxicological symptoms could affect the consumer. According to literature, the main adverse effects caused by BA, SA and their salts on human health are asthma, urticaria, metabolic acidosis and convulsions [9-11]. However, the toxicity of MBs increased with the ester chain length. Hence, lipophilic PBs can penetrate biological membranes and bioaccumulate in fatty tissues. According to Bledzka [12], these compounds are detected in breast tissues, suggesting the possibility of their involvement in breast cancer. The monitoring of these additives in fruit-based products is essential to protect consumers’ health from toxicological effects.
Foods matrices are generally considered as complex samples; since, they are not ready for direct introduction into instruments for analysis. Hence, these matrices need pre-treatment and extraction procedures of the target compounds before analysis by chromatographic instruments. Traditional extraction methods such as Liquid liquid extraction (LLE) [11, 13] and solid phase extraction [5, 14, 15] were reported and currently used. However, these extraction methods are harmful to the analyst’s health, and to the environment; and expensive by the use of high volumes of high purity solvents and costly SPE cartridges. To overcome these disadvantages, different micro extraction techniques were developed for the extraction and the pre concentration of the compounds of interest, which makes it possible to have very high enrichment ratio and a high sensitivity due to the use of very small volume of extracting solvent. Solid phase micro extraction (SPME) was the first method to be applied; but its main disadvantage is the use of expensive and degradable cartridges. Three extraction methods are used: single-drop micro extraction (SDME), hollow fiber liquid phase micro extraction (HF-LPME) and dispersive liquid-liquid micro extraction (DLLME).
This last method developed by Rezaee et al. [16] is a very quicker, simple, cheaper and environmentally sustainable miniaturized extraction technique. It is applied for the determination of organic compounds in water using a mixture of extractive and dispersive solvents at microliter volumes. Indeed, a mixture of extractive and dispersive solvents at defined proportions is rapidly injected into the aqueous sample. Therefore, few microliters of the extracting solvent were dispersed resulting in a cloudy emulsion that maximizes the interface between the two phases. Therefore, the extraction equilibrium is quickly reached, so the analytes were extracted and pre concentrated as organic droplets. Afterwards, the cloudy emulsion is centrifuged to separate the aqueous phase from the immiscible organics droplets which are recovered and analysed.
Different experimental factors affecting the sensitivity of this extraction method such as the extracting and dispersive solvents were selected using univariate method. Other parameters such as the volume of solvents, the pH of the medium, the salting out effect (amount of salt) and the volume of sample were investigated and optimized with the aid of an experimental Box Behnken design to minimize the number of experiments, save time and reduce cost of analysis. Analytical method validation is a demonstration and a verification of the performance of a method in a determined range to check its ability to quantify accurately the unknown analytes. The classical approaches allow only checking of the conformity of a performance measure to a reference value. In this present investigation, a new method named accuracy profile developed by the “Société Française des Sciences et Techniques Pharmaceutiques” (SFSTP) [17-19] was used as a graphical decision tool to assess the performance and the validity of a method. This graph was drawn according to the total error obtained from the sum of the bias and the intermediate precision for each level and takes into account the expected proportion of acceptable results comprised between predefined acceptability limits or expresses the probability of measurements that are expected to fall outside the acceptance limits during routine analysis. Hence, this approach allows minimizing considerably the risk to accept a procedure, which is not sufficiently accurate, or to reject a procedure giving accurate measures. The aim of this present work is the development, optimization and validation of a DLLME technique followed by an HPLC-UV analysis. The performance of the method and the control of its validity were accomplished by using the accuracy profile approach as a simple decision tool based on the notion of the total error that includes systematic (absolute bias) and random errors (intermediate precision standard deviation). Afterwards, the method was applied for extraction, pre-concentration and assessment of sodium benzoate SB, potassium sorbate PS and p-hydroxy methyl benzoate MB. It was applied to estimate the utilization rate in agro food industry and for the detection of any possible illegal addition in Algerian fruit derivatives such as juices, nectars and jams.
2. Materials and methods
2.1 Materials and reagents
The following reference standard compounds purchased from Sigma Aldrich were used: SA (purity: 99-100.5 %), potassium sorbate PS (≥ 99 %) and MB (≥ 99%). Acetonitrile (Sigma Aldrich) and methanol (Biochem Chemopharma) were HPLC grade (≥ 99.9 %). All other solvents are of analytical grade: acetone (≥ 99.8%), ethanol (≥ 99.8 %), acetic acid (99-100 %), chloroform (99- 99.4 %), ammonium acetate (≥ 98 %), hydrochloric acid HCl (36.5-38 %), and sodium chloride NaCl (≥ 99.5%), were obtained from (Sigma Aldrich). Carbone tetrachloride (99 %) obtained from Riedel- de Haen, carbone disulfide (≥ 99 %) and sodium hydroxide pellets NaOH (100 %) were obtained from (VWR Prolabo). The water used in our experiments was purified through a Milli Q Ultra-Pure Purification System (South Korea).
2.1.1 Preparation of solutions
Stock solutions of SA and PS were prepared in ultrapure water at a concentration of 1000 mg/l; while, MB stock solution was prepared at 500 mg/l in a mixture of ultrapure water and methanol (20:80 v/v). An intermediate solution of 100 mg/l of each standard was prepared in ultrapure water. This solution was used for the preparation of calibration curves, calibration and validation standards. The calibration standards are samples without matrix, containing known concentrations of the studied compounds which are used for the inverse prediction of the introduced concentrations of validation standards. Three series of calibration standards were prepared in mobile phase at the rate of one series per day for each experiment. The concentration levels were ranged from 1 to 20 mg/l for SA, PS and 0.5 to 10 mg/l for MB. For the validation standards, three independent series at a rate of one series per day were prepared in pure distilled water with juice matrix. The concentrations levels were the same as calibration standards and ranged from 1 to 20 mg/l for SA, PS and 0.5 to 10 mg/l for MB.
2.1.2 Sampling
In this study, a total of 80 samples including different brands of fruit juices, nectars and jams were randomly purchased from different local markets including large, and small commercial stores at Tizi ouzou city from north central Algeria. The analysed samples include 60 beverage samples (fruit juices and nectars) and 20 jam samples. All these samples were stored at cold before analyses.
2.2 Sample preparation and DLLME procedure
Different brands of fruit juices either non-carbonated and or pulp-free were diluted without pre-treatment. Juices with pulp were centrifuged at 6000 g for 2 min and carbonated juices were degassed for 3 min by agitation. The samples were diluted one hundred fold with distilled water.
From fruit jams, (2.5 g for each sample) were accurately weighed into beakers, diluted with distilled water, mixed with a glass rod until total dissolution, and ultra sonicated for 5 min. The samples were transferred into 25 ml glass flasks. The beakers were washed twice with distilled water that was added to the same flask. The diluted samples were ultra sonicated for 3 min and the flasks were adjusted to the gauge marks. Then, each sample was filtered through Whatman filter n°40 and 5 ml of the filtrate were diluted 10 fold and ultra sonicated for 2 min again.
The pH values of samples were adjusted to 3.0 with hydrochloric acid (0.5 N) and each flask was completed to the gauge mark. Then, each sample was agitated and ultra sonicated for 2 min. An aliquot of 4 mL was placed in a 15 ml conical bottom tube containing NaCl (1g). Then chloroform and acetone at 350 and 650 µl, respectively were added rapidly the aqueous solution. The tube was gently shaken ten times; vortexed for 30 sec and a cloudy solution appeared. After that, each tube was centrifuged at 6000 rpm for 4 min. The sedimented extracting solvent containing pre concentrated analytes was withdrawn using a Hamilton micro syringe and transferred to a glass flask. The recovered organic phase was afterwards evaporated in a water bath at 100°C. Finally, the residue was diluted in 1 ml of the mobile phase, sonicated for 3 min and 20 µl were injected into the HPLC apparatus.
2.3 HPLC-UV apparatus and parameters
A Shimadzu prominence liquid chromatography series equipped with an LC-20AT quaternary solvent delivery system (pump), SPD-20AV/UV detector, CTO-20 a column oven, a SIL-20A auto sampler with a 20 μl loop, a DGU 20-A5 degasser and communication bus module (CBM-20A) were used in this study. HPLC separations were carried out on an analytical C18 Interchrom column (250 × 4.6 mm id, 5-μm particle size). An optimized
mobile phase (acetate buffer 20 mM at pH 4.4; acetonitrile purity HPLC) (67: 33, v/v) was used at a flow rate of 1 ml/min. The separation was performed at room temperature using an isocratic elution mode with a total runtime of 10 min including 2 min for reequilibration of the column. The wavelength of the detector was set at 235 nm and the injection volume was 20 µl.
2.4 Experimental design and statistical analysis
In this work, the statistical analysis software “package Design-Expert 10.0.3 - trial version” was used for box Behnken design generation with 30 runs and 6 points at the center to obtain a good estimation of pure error and analysis of the experimental parameters. This design was used firstly to decrease the number of experimental trials, and secondly to investigate the effects and the interactions between variables and optimize true optimum conditions of DLLME using response surface methodology (RSM). According to literature and preliminary trials, four important variables with three levels for each were used (Table 1). These variables were the volumes of extractive solvent (A), of dispersive solvent (B), pH of sample (C) and amount of added salt (D).The analyses of regression, of variance (Anova) and the graphical optimizations as well as the desirability function were performed in order to determine the optimal conditions.
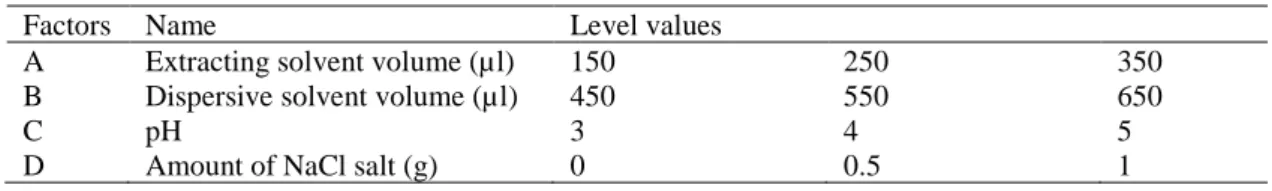
Table 1. Level values of the factors used in the Behnken box design for DLLME optimization
Factors Name Level values
A Extracting solvent volume (µl) 150 250 350
B Dispersive solvent volume (µl) 450 550 650
C pH 3 4 5
D Amount of NaCl salt (g) 0 0.5 1
3. Results and discussion
3.1 DLLME method development
3.1.1 Selection of the extracting and dispersive solvents
The extractive and dispersive solvents are essential parameters in DLLME development. In fact, these two solvents are the most relevant factors which affect the efficiency of this technique. The choice of these solvents is based on the following criteria: the extracting solvent was selected after a previously screening of different solvents according to their water miscibility, affinity with the analytes of interest and high yield of extraction (efficiency) and high sensitivity, with also higher density than water to facilitate its recovery. Moreover, this
solvent should have low boiling point to accelerate its evaporation. Based on these requirements, the following solvents such as chloroform (CHCl3), carbon tetrachloride (CCl4) and carbon disulfide (CS2) were selected to be
tested. The selection of the dispersive solvent is based on its miscibility with both the extracting solvent and the aqueous phase to obtain the formation of a stable cloudy solution. Hence, acetonitrile, methanol, ethanol and acetone were selected as the most adequate.
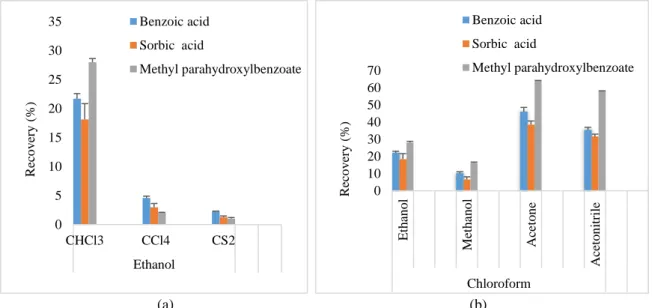
In this study, these solvents were selected using univariate method. For the selection of the extracting solvent, experiments were accomplished by a combination of 500 µl of ethanol and 200 µl of CHCl3, CCl4 and CS2. As can
be seen in Figure 1a, the recoveries for the three studied compounds are higher for CHCl3. Therefore, among the
tested solvents, CHCl3 was selected as the most suitable extracting solvent. In the second step, a combination of
200 µl of CHCl3 with 500 µl of ethanol, methanol, acetone C3H6O and acetonitrile C2H3N was prepared to select
the most suitable dispersive solvent. Higher extraction recoveries were obtained for acetonitrile and acetone than those obtained with methanol and ethanol (Figure 1b). Moreover, acetone is the cheapest solvent, which is chosen as the dispersive solvent.
(a) (b)
Fig. 1 Effect of different extracting solvents (a) and different dispersive solvent (b) on the extraction recoveries of the different analytes (Extracting solvent volume: 200𝜇𝜇l; dispersive solvent volume: 0.5 ml; sample volume: 4 ml; spiked concentration: 10 mg/l Benzoic acid and Sorbic acid and 5 mg/l for Methyl para hydroxyl benzoate).
3.1.2 Box Behnken design for optimization of DLLME method
A three-level and four-factor Box-Behnken design was chosen to evaluate the effect and the combined effect of the studied independent variables and to assess the best experimental conditions to maximize DLLME efficiency. The minimum and maximum values for the studied factors were, extracting solvent volume between 150 and 350 µl (A), dispersive solvent volume (B) between 450 and 650 µl, pH (C) 3 and 5 and NaCl (D) between 0 and 1 g. (Figure 2a,b, c). The design matrix consists of 30 trials according to 2k (k-1) containing six central points to 2evaluate the pure error. The coefficient of the model for each compounds were calculated using the least square regression analysis method. F-value and the p-value are used as a tool to check the significance of the models, the factors and the interaction strength between factors. The validation of the model was accomplished by an appropriate analysis of variance (Anova). All the results of the box Behnken design were reported in Table 2. The Anova performed on the obtained data suggests that the quadratic fitted models were significant as the Fisher F-test (F, mean square regression/ mean square residual were 66.19, 94.75, 37.56) for BA, SA and MB with p-value less than 0.001 which means that only a 0.01 % chance that a “Model F-Value” could occur due to noise.
The large adjusted regression coefficient Rs2 indicates a good relationship between the experimental results
and the fitted model. In addition, the reliability and the quality of the fit of the model was checked by the determination of coefficient Rs2, adjusted determination coefficient Rs2a and coefficients of variance CV for each
compound. The high R2 values (0.9841, 0.9888 and 0.9723) for BA, SA and MB respectively indicate the good
quality of the quadratic regression models which implied that 98.41, 98.88 and 97.23 % of the variation could be explained by the fitted model; whereas, only 1.59, 1.12 and 2.77 % of the total variations were not explained by this model. The predicted R2 for all the models were (0.9154, 0.9434 and 0.8527) were in reasonable agreement
withR2 adjusted (0.9692, 0.9784 and 0.9464) respectively for BA SA and MB which indicate a high correlation
between experimental and predicted values (Table 2).
0 5 10 15 20 25 30 35 CHCl3 CCl4 CS2 Ethanol R eco v er y ( % ) Benzoic acid Sorbic acid Methyl parahydroxylbenzoate 0 10 20 30 40 50 60 70 E tha n ol M et ha no l A ce ton e A ce to n itr ile Chloroform R eco v er y ( % ) Benzoic acid Sorbic acid Methyl parahydroxylbenzoate
Figure 1(a, b and c) reveals that the predicted responses (values) generally fall on a straight line. Moreover, the lack of fit showed p-values of 0.0606, 0.1504 and 0.0604 for BA, SA and MB respectively which indicates that the regression equation models were not lack of fit and they are not significant relative to the pure error. The low coefficient of variation (CV % = 5.39, 3.69 and 3.18 %) among the replicate experimental data indicates that the precision of the experimental data was very good.
a b
c
Fig. 2. Response surfaces for the box Behnken design for the three analytes estimated by plotting (a) extracting solvent volume (µl) versus dispersive solvent volume (µL); (b) Extractive solvent volume (µl) versus NaCl amount (g); (c) NaCl amount (g) versus pH.
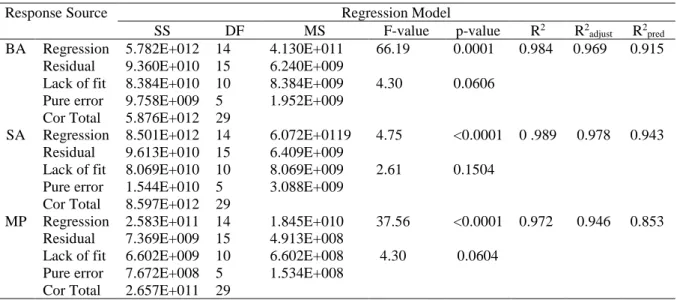
Table 2. Analysis of variance (Anova) for Behnken box design of target analytes
Response Source
Regression Model
SS DF MS F-value p-value R2 R2
adjust R2pred
BA Regression 5.782E+012 14 4.130E+011 66.19 0.0001 0.984 0.969 0.915
Residual 9.360E+010 15 6.240E+009
Lack of fit 8.384E+010 10 8.384E+009 4.30 0.0606
Pure error 9.758E+009 5 1.952E+009 Cor Total 5.876E+012 29
SA Regression 8.501E+012 14 6.072E+0119 4.75 <0.0001 0 .989 0.978 0.943
Residual 9.613E+010 15 6.409E+009
Lack of fit 8.069E+010 10 8.069E+009 2.61 0.1504 Pure error 1.544E+010 5 3.088E+009
Cor Total 8.597E+012 29
MP Regression 2.583E+011 14 1.845E+010 37.56 <0.0001 0.972 0.946 0.853 Residual 7.369E+009 15 4.913E+008
Lack of fit 6.602E+009 10 6.602E+008 4.30 0.0604 Pure error 7.672E+008 5 1.534E+008
The response surface plots, which show the curvature of the interaction effect between pair of the independent variables, were used to investigate the significance of the two interaction effects in the simultaneous preconcentration of the three analytes (Figure 2). As shown in Figure 2, three-dimensional (3D) response surface plots of interactive effects for the sum of analytical signal of the three analytes were presented. It is clear that the extraction efficiency increase with large extracting solvent volume. On the other hand, it was observed that the dispersing solvent volume effect was not significant. The pH of sample is one of the important factors that could have an impact on the extraction performance of the DLLME method. This is due to the fact the analyte could exist at different molecular states those more soluble in aqueous phase or in the organic phase. Consequently, a lower pH value of an aqueous sample in which all the compounds were protonated is essential to reach the ionic form and to transfer all the analytes into the organic solvent to increase extraction efficiency. Concerning the salting out effect, we observed that the added salt promoted an increase in ionic strength, which may cause a decrease in the solubility of the compounds in the aqueous phase facilitating their transfer into the organic phase. The desirability function (DF) was used as an efficient alternative for simultaneous optimization of several responses simultaneously and to find the operating conditions that can ensure compliance with the criteria of all the involved responses [20]. To achieve this goal an individual DF comprised inside the following interval (0 - 1) was assigned according to the fitted model and specified optimization criteria. Then, an overall DF which is a geometric mean of the individual DF was calculated to found the optimal conditions. Once again, these individual functions were maximized (Table 2). The optimal conditions were found as 280 µl, 650 µl, 3 and 1 g for extracting solvent, dispersive solvent, pH and salt amount, respectively (with a desirability= 0.989).
3.2 Method validation
Accuracy profiles based β expectation tolerance interval for the total error (sum of the bias and standard deviation of intermediate precision) was applied for method validation [17-19]. Different validation criteria such as Selectivity, calibration curve, linearity, precision, trueness, accuracy, limit of detection (LOD), limit of quantification (LOQ) and assay range were evaluated.
The matrix used in the validation step was diluted one hundred times with the accomplishment of an extraction step, thus, the matrix effect is much reduced and it is very small if it exists. Based on this information, the modified experimental design V2 with adding an additional level to the calibration and the validation standards was used. This design was defined as 3 independent series, four concentration levels 1, 5, 10, 20 mg/l for BA and SA and 0.5, 2.5, 5, 10 mg/l for MB with two replicates in each level for calibration standards and three replicates for validation standards. All the results were calculated using the total error approach (bias + standard deviation of intermediate precision) of the procedure and they were validated using the reference E-noval V3.0 and back-predicter software (Arlenda, Liège, Belgium).
3.2.1 Response function and linearity
For the validation of analytical method using SFSTP guidelines, different responses functions as linear straight line with or without intercept and non linear that include quadratic functions can be applied. These functions responses fitted to the analysis of the relationship between the introduced concentrations (x) and the instrumental signal response (y) of the validation standards were evaluated from three independent series of calibration curves that correspond to the calibration standards. The accuracy index was used to determine the optimal response function which provides better results and which is adequate for the quantitative estimation of the studied compounds. Hence, the response function that provides the best result were quadratic regression, linear regression weighted (1/X2) and quadratic regression weighted (1/X) for BA, SA and MB, respectively.
The linearity of the method was assessed by the relationship between the back calculated and the introduced concentrations of the validation standards. The regression line that fit of the back- calculated concentrations against the introduced concentrations was plotted by applying a linear regression model. As shown in Table 2, the results of the slopes and the intercepts are close to 1 and 0 with a correlation coefficient R2 of 0.9752, 0.9915 and 0.9969
for BA, SA and MB, respectively. Therefore, the results demonstrated that the method has a good linearity in the tested interval for all the studied preservatives.
3.2.2 Precision
The precision of an analytical method is a criterion that provides information regarding the random error or dispersion of measurements. This criterion is evaluated on the whole range of the method validation by calculating the relative standard deviation (RSD %) of repeatability (intraday precision) and the RSD % of the intermediate precision (inter-day precision) at each concentration level from the validation standards data. As presented in Table 1, relative standard deviation for the repeatability and intermediate precision seemed relatively good except for RSD % of intermediate precision of the level 20 mg/ l for BA which is relatively high with a value of 12.02 %.
The trueness of an analytical method estimates the systematic error; this criterion can be estimated in terms of absolute or relative bias and in term of percentage recovery for each concentration level of validation standards. As shown in Table 1, the method showed good recoveries, which are from 82.98 to 99.44 for the BA and MB. For SA the recoveries a ranged from 70 to 91.14 % and they were within the accepted range 70-120% [21]. However, the accuracy profile lower limit was beyond the accepted limit λ set at ± 30 %. In this case, a correction factor was applied [22, 23]. The correction factor of 1.34 that represents the inverse of the slope, linking the recovered concentrations to the introduced concentrations of the validation standards, was applied to all the tested response functions obtained for SA. As shown in Table 1, linear regression weighted 1/X2 with the lowest slope of 0.7474
was selected as the response function that gives the best results of recoveries. Recoveries were evaluated on jam at four concentration levels 1, 5, 10, 20 mg/L for BA and SA and at 0.5, 2.5, 5, 10 mg/l for MB using standard addition method and three micro extraction replicates were performed for each level. As the jam samples may contain natural BA and SA, so the endogenous content was subtracted and then the recoveries were calculated. The method showed good recoveries of respectively 84.09 ± 2.94 % for BA and 90.08 ± 4.58 % for MB. For SA, the main recovery was 79.71 ± 3.4 % as in the juice samples; a correction factor of 1.32 was applied to the jam, which gives good recoveries with a maximum of 105.29 ± 3.55 %. Hence, there is a need to apply a correction factor to assess the true concentrations of SA in unknown samples.
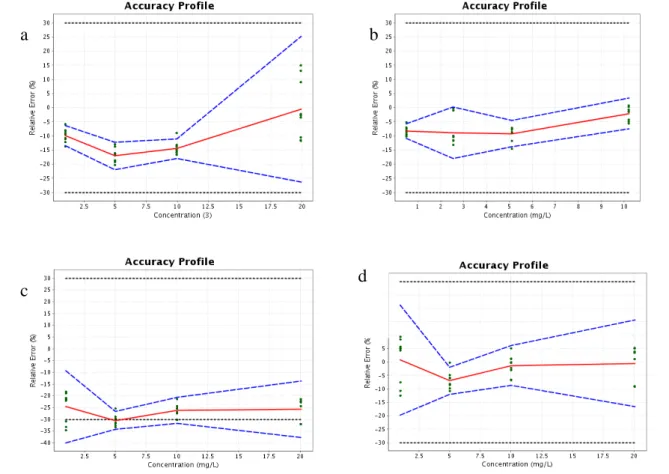
3.2.4 Accuracy profile, LOD and quantification LOQ
The accuracy profile approach that gives the analyst a sense of what a procedure will be able to produce during routine analysis over the intended range is used [24]. Accuracy, assessed from the accuracy profile, is the expression of the sum of the trueness and the precision and it represents the closeness of agreement between the measured value and the acceptable true value [25]. As illustrated in Figure 3, one single graphic was used to represent the tolerance intervals (TI) and acceptability limits (± 30) allowing a 15 % maximum bias of trueness and a 15 % maximum of relative standard deviation for precision for each analyte. It is obvious that all TIs were comprised within the acceptability limits of ± 30 % for BA and MB. However, In the case of SA, the lower TI was outside the acceptability limit and the main recovery was 79.71 ± 3.4 %. Hence, a new accuracy profile computation was carried out with taking into account a correction coefficient on the validation data in order to compensate lower recoveries for SA [25].
Therefore, as shown in Figure 3, the method could be considered as valid in the range limited by LLOQ and ULOQ defined graphically by the intersection between the TI and the acceptance limits set at ± 30 % [17, 24]. Therefore, LLOQs were 1.005, 1.011 and 0.5043 mg/l for BA, SA and MB respectively. Moreover, LODs were estimated as LLOQ/3.3 and they were 0.304, 0.306 and 0.153 mg /l, respectively.
The developed method was applied for simultaneous quantification and monitoring of the three studied preservatives used in foodstuffs. In this work, eighty commercial diet samples that include sixty beverages (fruit juices and nectars) and twenty jam samples available in the Algerian market from different industries were freshly analysed.
Table 3 summarizes the results obtained in all the investigated samples in terms of their occurrence and concentrations. From the results, it can be deduced that the most abundant compound to be found was BA and its salts. In fact, these compounds were encountered at high occurrence of 100 % compared to the two other preservatives (SA or its salts with an occurrence or frequency of 95 % and MB with occurrence of 0 %).
BA and its salts were found to be used extensively and was found to present different quantifiable levels from amounts < LOD to a concentration up to 833.97 ppm. As reported in the Algerian legislation, all the studied compounds are forbidden in the studied matrices with the exception of BA, which is permitted in jams at a maximum level of 500 ppm [26]. However, these compounds were detected and quantified in forty juices and nectars (66.66% of samples) that mention or not their presence on the label with a maximum concentration that reaches 269.04 mg/kg. In the other 20 samples (33.33% of samples) that do not mention their presence on the label, these compounds were detected at very low concentrations that do not exceed 5.45 mg/kg. In fact, these low amounts may be due to the natural occurrence of BA in fruits. The results are generally in agreement with Codex
Alimentarius norm since there is no sample that exceeds 1000 ppm [27]. Moreover, BA or its salts were detected
in all jam samples and only 4 (20%) of samples were found with high levels of 784.87 to 833.97 mg/kg that exceed the imposed concentration of 500 mg/ kg[26]. In addition, according to Codex alimentarius [27], all the results were found to be lower than the permitted concentration of 1000 mg/kg.
SA and its salts were also determined at high occurrence from not detectable amount to a highest concentration of 290.67 ppm in jam samples. This compound was detected in 40 samples (100 %) at a maximum concentration inferior to 241.76 ppm in fruits juice and nectars samples that mention or not these compounds in their label. However, in others samples (20), tough, this compound was not mentioned on the labels; it was found at very low concentrations which do not exceed 16.09 ppm. In jam samples, this compound was not detected in 4 samples (20% of samples) also it was found at high concentrations ranging from 160.55 to 290.67 mg/kgin 4 other samples (representing 20% of samples). In other samples, SA was found at a maximum concentration of 6.12 mg/kg. As
in the case of BA, these low amounts may occur from fruits (indigenous contents). These results for SA and its salts in several samples did not fulfil the Algerian regulation that banned totally their use [26]. However, these results did not surpass the maximum permitted concentration of 1000 ppm that is recommended by the Codex
alimentarius in the fruit juices, nectars and jams studied [27].
Fig.3 HPLC/UV analytical method for the quantification of BA (a), MB (b) and SA (c: before application and d: after application of a correction coefficient): relative bias, dashed lines: β-expectation tolerance limits (β= 80 %), dotted lines: ± 30 % acceptance limit.
3.3 samples analyses
Table 3. Validation performance of the analytical method for the target analytes. Additives level(mg/l) Recovery
(%) Repeatability (RSD %) Intermediate precision (RSD %) Linearity R2 BA 1 90.20 2.39 2.39 Y= 1.01 X- 0.96 0.9752 5 82.98 1.66 2.73 10 85.51 2.38 2.38 20 99.44 1.81 12.02 SA 1 100.8 2.35 9.76 Y = 1.00 X- 0.14 0.9915 5 93.03 2.94 3.28 10 98.74 2.54 4.15 20 99.45 0.96 7.49 MB 0.5 91.80 1.3 1.61 Y = 0.9851 X+ 0.17 0.9969 2.5 91.13 3.18 5.20 5 90.82 1.75 2.67 10 97.95 0.77 2.61
On the other hand, even though, the Algerian regulation do not permit the use of BA and SA or their salts together in all the investigated products [26]; however, they were detected together in 76 samples (95 % of samples). In contrast, the use of these two preservatives in combination is permitted by the Codex alimentarius
a
b
[27] and the results found did not exceed the maximum permitted limits. Other studies concerning BA, SA and MB in some foodstuffs such as fruit juices, nectars, and jams showed different results. In fact, in few cases, the results were found to be higher in fruit juices than those reported in this study. Therefore, in a previous study conducted by Tfouni and Toledo [9] showed higher amounts of BA and SA in Brazilian juices that vary from undetected to 804 ppm and from undetected to 450 ppm for BA and SA, respectively. In addition, the study of Dong and Wang [28] showed only high concentration for SA that reached 835.6 ppm. Mota et al.[5] and Wen et al. [29] reported results lower than those found in this present study: In fact, BA and SA were not detected in any sample [29] and they ranged from undetected to 151 ± 1.1 ppm for BA and from undetected to 210 ± 5.2 ppm for SA. However, BA was not detected in juice samples as reported by Dong and Wang [28].
For jams, the results of others studies showed, only the presence of SA at high concentration that reached 639 ± 16 ppm [5] and 308 ppm [29]; whereas, others results were found below those obtained in our study. The study of Saad et al. [30] reported no detection of both BA and MB. However, in the same study SA was quantified at concentrations of 162 to 266 ppm in jam samples. Moreover, BA was found at concentrations from undetected to 789 ± 6 ppm [5] and from undetected to 392 ppm [29].
4. Conclusion
To conclude, the results found in this study are generally higher than those found in other studies. Hence, it can be deduced that the studied foodstuffs could be important sources of BA and SA in Algerian human diet. Monitoring of food additives in various foodstuffs needs more attention in order to develop good quality products and ensure food safety to Algerian consumers such as infant and sensitive populations. In this present work, DLLME combined to HPLC-UV has been optimized and validated for the monitoring of the contents of three preservatives in different foodstuffs. In fact, the feasibility of using DLLME for sample preparation leads to the reduction of toxic waste, organic solvents and sample volume. Moreover, this method is characterized by simplicity, rapidity and a high sensitivity.
The method was optimized by using the box Behnken design and fully validated according to the total error approach. The experimental results revealed that this method fulfil good linearity, trueness (recoveries), sensitivity, low LODs and good precision for accurate analysis and monitoring of the presence of the studied compounds in fruit juices, nectars and jam samples. The developed method was successfully applied to accurate and routine monitoring of preservatives in eighty commercial samples to ensure good quality of products. BA and SA were detected in 100 and 95 % of samples, respectively; whereas, MB was not detected in any sample. The results show almost the analysed samples did not show compliance with the Algerian and European Regulation. However, they comply with the Codex alimentarius regulation [27].
5. Acknowledgments
The present research was funded by the DGRSDT and the Algerian Ministry of University studies and scientific research (MESRS).
6. References
[1] Horiyama, S., Honda, C., Suwa, K., Okada, Y., Semma, M., Ichikawa, A., & Takayama, M. Negative and positive ion mode LC/MS/MS for simple, sensitive analysis of sorbic acid. Chemical Pharmaceutical Bulletin. 2010; 58 (1): 106-109.
[2] Baranowska, A., Wojciechowska, I., Solarz, N., & Krutysza, E. Determination of preservatives in cosmetics, cleaning agents and pharmaceuticals using fast liquid chromatography. Journal of Chromatography Science. 2014; 52 (1): 88-94.
[3] Alshana, U., Ertas, N., & Göger, N.G. Determination of parabens in human milk and other food samples by capillary electrophoresis after dispersive liquid–liquid micro extraction with back-extraction. Food Chemistry. 2015;181: 1-8.
[4] Schlittenbauer, L., Seiwert, B., & Reemtsma, T. Ultrasound-assisted hydrolysis of conjugated parabens in human urine and their determination by UPLC–MS/MS and UPLC-HRMS. Analytical Bio analytical Chemistry. 2016; 408 (6):1573-1583.
[5] Mota, F.J.M., Ferreira, I.M.P.L.V.O., Cunha, S. C., Oliveira, M., & Beatriz, P.P. Optimisation of extraction procedures for analysis of benzoic and sorbic acids in foodstuffs. Food Chemistry. 2003; 82: 469- 473. [6] Can, N.O., Arli, G., & Lafci, Y. A novel RP-HPLC method for simultaneous determination of potassium
sorbate and sodium benzoate in soft drinks using C18-bonded monolithic silica column. Journal of Separation Science. 2011; 34 (16-17): 2214-2222.
[7] Joint FAO/OMS Expert Committee on Food Additives. Toxicological evaluation of certain food additives with a review of general principles and of specifications (17th report of the Joint FAO/WHO Expert
Committee on Food Additives JECFA). Geneva, Switzerland: WHO Technical Report Series; 1974. No.539. [8] Joint FAO/WHO Expert Committee on Food Additives JECFA. Evaluation of certain food additives and
contaminants (41th report on the Joint FAO/WHO Expert Committee on Food Additives). Geneva: WHO
Technical Report Series, JECFA;1997. No. 868.
[9] S.A.V. Tfouni, & Toledo, M.C.F. Determination of benzoic and sorbic acids in Brazilian food. Food Control. 2002; 13:117-123.
[10] Ding, M., Peng, J., Ma, S., & Zhang, Y. An environment-friendly procedure for the HPLC determination of benzoic acid and sorbic acid in soy sauce. Food Chemistry. 2015; 183:26-29.
[11] Gören, A.C., Bilsel, G., Simsek, A., Bilsel, M., Akçadag, F., Topal, K., & Ozgen H. HPLC and LC– MS/MS methods for determination of sodium benzoate and potassium sorbate in food and beverages: Performances of local accredited laboratories via proficiency tests in Turkey. Food Chemistry. 2015;175: 273-279.
[12] Bledzka, D., Romadzinska, J., & Wasowicz, W. Parabens: From environmental studies to human health. Environment international. 2014; 67: 27-42.
[13] Fuselli, F., Guarino, C., La Mantia, A., Longo L., Faberia A., & Marianella, R.M. Multi-detection of preservatives in cheeses by liquid chromatography–tandem mass spectrometry. Journal of Chromatography B. 2012; 906: 9-18.
[14] Techakriengkrai, I., & Surakarnkul, R. Analysis of benzoic acid and sorbic acid in Thai rice wines and distillates by solid-phase sorbent extraction and HPLC. Journal of Food Composition and Analysis. 2007; 20 (34): 220-225.
[15] Wang, L., Zhang, X., Wang, Y., & Wang W. Simultaneous determination of preservatives in soft drinks, yogurts and sauces by a novel solid-phase extraction element and thermal desorption-gas chromatography. Analytica Chimica Acta. 2006; 577 (1): 62-67.
[16] Rezaee, M., Assadi, Y., Milani Hosseini, M.R., Aghaee, E. , Ahmadi, F., & Berijani, S. Determination of organic compounds in water using dispersive liquid-liquid microextraction. Journal of Chromatography A. 2006; 1116:1-9.
[17] Hubert, P., Nguyen-Huu, J.J., Boulanger, B., Chapuzet, E., Chiap, P., Cohen, N., Éwé, W., Feinberg, M., Laurentie, M., Mercier, N., Muzard, G., Nivet, C., & Valat, L. Harmonization of strategies for the validation of quantitative analytical procedures. A SFSTP proposal Part I. Journal of Pharmaceutical and Biomedical Analyses. 2004; 36: 579-86.
[18] Hubert, P., Nguyen-Huu , J.J., Boulanger, B., Chapuzet, E., Chiap, P., Cohen, N., Compagnon, P.A., Éwé, W., Feinberg, M., Lallier, M., Laurentie, M. , Mercier, N., Muzard , G., Nivet, C., Valat, L., & Rozet, E. Harmonization of strategies for the validation of quantitative analytical procedures. A SFSTP proposal-part II. Journal of Pharmaceutical and Biomedical Analyses. 2007a; 45: 70-81.
[19] Hubert, P., Nguyen-Huu, J. J., Boulanger, B., Chapuzet, E., Cohen N., Compagnon, P.A. , Dewé, W., Feinberg, W., Laurentie, M., Mercier, N., Muzard, G., Valat, L., & Rozet E. Harmonization of strategies for the validation of quantitative analytical procedures. A SFSTP proposal-part III. Journal of Pharmaceutical and Biomedical Analyses. 2007b; 45: 82-96.
[20] Homem, V., Alves, A., & Santos, L. Ultrasound-assisted dispersive liquid–liquid microextraction for the determination of synthetic musk fragrances in aqueous matrices by gas chromatography-mass spectrometry. Talanta. 2016; 148: 84–930.
[21] EU Regulation of the European Parliament and of the Council, European Union, Brussels. http://ec.europa.eu/food/plant/protection/ pesticides/index en.htm. 2005. No 396.
[22] Hubert, P., Nguyen-Huu, J.J., Boulanger, B., Chapuzet, E., Cohen, N., Compagnon, P.A., Dewé, W., Feinberg, W., Laurentie, M., Mercier N., Muzard, G., Valat, L., & Rozet E. Harmonization of strategies for the validation of quantitative analytical procedures: A SFSTP proposal Part IV. Examples of applications. Journal of Pharmaceutical and Biomedical Analyses. 2008; 48:760-771.
[23] Mottier, N., Tharin, M., Cluse, C., Crudo María, J. R., Lueso, G., Goujon- Ginglinger, G. C. G., Jaquier, A., Mitova, M. I., Rouget, E.G.R., Schaller, M., & Solioz, J. Validation of selected analytical methods using accuracy profiles to assess the impact of a Tobacco Heating System on indoor air quality. Talanta. 2016; 158: 165–178.
[24] Rozet, E., Ceccato, A., Hubert, C., Ziemons, E., Oprean, R., Rudaz, S., Boulanger, B., & Hubert, P. Analysis of recent pharmaceutical regulatory documents on analytical method validation. Journal of Chromatography A. 2007; 1158: 111-125.
[25] Feinberg, M., San-Redon, J., & Assié, A. Determination of complex polysaccharides by HPAE-PAD in foods: Validation using accuracy profile. Journal of Chromatography B. 2009 ; 877: 2388–2395.
[26] Executive Decree No. 12-214 establishing the conditions and modalities for the use of food additives in foodstuffs intended for human consumption. Official Journal of the Algerian Republic: Decree No. 12, 2012, 214. Available at: www.commerce.gov.dz/reglementation/decret-executif-12-214.
[27] Codex alimentarius. General Standard for food additives. Codex Stan; 1995. No. 192.
[28] Dong, C., & Wang, W. Headspace solid-phase micro extraction applied to the simultaneous determination of sorbic and benzoic acids in beverages. Analytica Chimica Acta. 2006; 562: 23-29.
[29] Wen, Y., Wang, Y., & Feng Y.Q. A simple and rapid method for simultaneous determination of benzoic and sorbic acids in food using in-tube solid-phase micro extraction coupled with high-performance liquid chromatography. Analytical Bio analytical Chemistry. 2007; 388 (8):1779-1787.
[30] Saad, B., Bari, M.F., Saleh, M.I., Ahmad, K., & Talib, M.K. Simultaneous determination of preservatives (benzoic acid, sorbic acid, methylparaben and propylparaben) in foodstuffs using high-performance liquid chromatography. Journal of Chromatography A. 2006; 1073: 393-397.
© 2019 by the author(s). This work is licensed under a Creative Commons Attribution 4.0 International License (http://creativecommons.org/licenses/by/4.0/). Authors retain copyright of their work, with first publication rights granted to Tech Reviews Ltd.