HAL Id: hal-03121294
https://hal.inrae.fr/hal-03121294
Submitted on 26 Jan 2021HAL is a multi-disciplinary open access archive for the deposit and dissemination of sci-entific research documents, whether they are pub-lished or not. The documents may come from teaching and research institutions in France or abroad, or from public or private research centers.
L’archive ouverte pluridisciplinaire HAL, est destinée au dépôt et à la diffusion de documents scientifiques de niveau recherche, publiés ou non, émanant des établissements d’enseignement et de recherche français ou étrangers, des laboratoires publics ou privés.
Distributed under a Creative Commons Attribution - NonCommercial - NoDerivatives| 4.0 International License
Genetic variation underlies the plastic response to shade
of snapdragon plants ( Antirrhinum majus L.)
Mathilde Mousset, Sara Marin, Juliette Archambeau, Christel Blot, Vincent
Bonhomme, Laura Garaud, Benoît Pujol
To cite this version:
Mathilde Mousset, Sara Marin, Juliette Archambeau, Christel Blot, Vincent Bonhomme, et al.. Ge-netic variation underlies the plastic response to shade of snapdragon plants ( Antirrhinum majus L.). Botany Letters, Taylor & Francis, 2021, pp.1-14. �10.1080/23818107.2020.1857833�. �hal-03121294�
Full Terms & Conditions of access and use can be found at
https://www.tandfonline.com/action/journalInformation?journalCode=tabg21
Botany Letters
ISSN: (Print) (Online) Journal homepage: https://www.tandfonline.com/loi/tabg21
Genetic variation underlies the plastic response to
shade of snapdragon plants (Antirrhinum majus L.)
Mathilde Mousset , Sara Marin , Juliette Archambeau , Christel Blot , Vincent
Bonhomme , Laura Garaud & Benoit Pujol
To cite this article: Mathilde Mousset , Sara Marin , Juliette Archambeau , Christel Blot , Vincent Bonhomme , Laura Garaud & Benoit Pujol (2020): Genetic variation underlies the plastic response to shade of snapdragon plants (Antirrhinum�majus L.), Botany Letters, DOI: 10.1080/23818107.2020.1857833
To link to this article: https://doi.org/10.1080/23818107.2020.1857833
© 2020 The Author(s). Published by Informa UK Limited, trading as Taylor & Francis Group.
View supplementary material
Published online: 24 Dec 2020. Submit your article to this journal
Article views: 80 View related articles
Genetic variation underlies the plastic response to shade of snapdragon plants
(Antirrhinum majus L.)
Mathilde Mousseta, Sara Marinb, Juliette Archambeauc, Christel Blotd, Vincent Bonhommee, Laura Garaudf
and Benoit Pujol b
aLaboratoire Evolution & Diversité Biologique (UMR5174 EDB), Université Fédérale Toulouse Midi-Pyrénées, CNRS, IRD, UPS, Toulouse cedex 9, France; bPSL Université Paris: EPHE-UPVD-CNRS, USR 3278 CRIOBE, Université De Perpignan, Perpignan Cedex, France; cBIOGECO, INRA, University of Bordeaux, Pessac, France; dDépartement Des Sciences Fondamentales, University of Québec in Chicoutimi, Saguenay, Canada; eInstitut Des Sciences De L’évolution (ISEM), UMR 5554, Université De Montpellier, CNRS, IRD, EPHE, Place Eugène Bataillon, France; fDepartment of Ecology and Evolution, University of Lausanne, Lausanne, Biophore, Switzerland
ABSTRACT
A classic example of phenotypic plasticity in plants is the set of traits that change in response to shade. There is widespread evidence that plants in low light conditions often avoid shade by growing taller or by increasing their photosynthetic efficiency, i.e. the shade avoidance syn-drome. Whether this plasticity might evolve in response to natural selection depends upon the presence of its standing genetic variation in wild populations. There is limited evidence for heritable standing variation in the plastic response of plants to shade. In this study, we used an experimental common garden approach to investigate this plastic response in snapdragon plants (Antirrhinum majus L.) originating from four natural populations from the Mediterranean region. Our results showed that individual plants reacted strongly to the presence of shade by growing longer shoots, longer internodes, and increasing their specific leaf area in these four populations. Our results also revealed genetic variation for the plastic response within these populations, as well as little genetic constraints to its evolution. Our findings imply that natural populations of
A. majus harbour standing genetic variation for phenotypic plasticity in response to shade,
providing them the potential to evolve in response to selection.
ARTICLE HISTORY
Received 28 July 2020 Accepted 16 November 2020
KEYWORDS
Phenotypic plasticity; shade avoidance syndrome; quantitative genetics; stem elongation; specific leaf area
Introduction
Environmental heterogeneity is the norm rather than the exception in nature. As a consequence, organisms often experience variation in their environment across space and time. In this case, theory predicts that phe-notypic plasticity (the capacity of one genotype to express different trait values in different environ-ments) is likely to evolve (Via and Lande 1985; Schei ner 1993, 2013; Gavrilets and Scheiner 1993). The capacity of a population to evolve different levels of phenotypic plasticity is conditioned, however, by the presence of genetic variation for the plastic response. There is a large body of evidence showing a genetic basis to phenotypic plasticity for many traits (Beldade et al. 2011). A variety of approaches can be used to test for this genetic component (Pigliucci 2005). One clas-sical method involves testing populations for gene-by- environment (GxE) interactions, by investigating how identical or related individuals sharing genes express different phenotypes in responses to a change in their environmental conditions.
The response of plants to a given light intensity and spectrum is a classic example of phenotypic plasticity (e.g. Smith 1982; Schmitt and Wulff 1993; Schmitt et al. 1995,
1999). In many species, shade triggers a suite of develop-mental, physiological, and phenological trait modifica-tions. These modifications can include increased shoot (often through internode elongation), petiole or hypoco-tyl growth (Smith 1982; Ballaré et al. 1991; Ballaré 1999; Pierik et al. 2004; Pujol et al. 2005; Bell and Galloway 20 07; Franklin 2008), modification of leaf position (Pierik et al. 2003), increased apical dominance (Smith 1982; Smith and Whitelam 1997), reduction of branching or tillering (Smith 1982; Schmitt and Wulff 1993), earlier flowering (Smith 1982; Schmitt and Wulff 1993), and a greater leaf area to biomass ratio (increase in specific leaf area; Lewandowska and Jarvis 1977; Dong 19 95; Evans and Poorter 2001). Collectively, these trait mod ifications characterise the shade avoidance syndrome. Physiological and developmental mechanisms underly-ing this syndrome are well described (e.g. Ballaré et al.
1987, 1990; Ballaré and Pierik 2017), and involve the act ion of photoreceptors and phytohormones.
CONTACT Mathilde Mousset, mathilde.mousset@gmail.com CNRS, Evolution & Diversité Biologique, Université de Toulouse Paul Sabatier, Toulouse, 31062, France; Benoit Pujol benoit.pujol@univ-perp.fr CNRS, CRIOBE, Université Perpignan Via Domitia, 52 Av. Paul Alduy, Perpignan, 66860, France
Supplemental data for this article can be accessed here. https://doi.org/10.1080/23818107.2020.1857833
© 2020 The Author(s). Published by Informa UK Limited, trading as Taylor & Francis Group.
This is an Open Access article distributed under the terms of the Creative Commons Attribution-NonCommercial-NoDerivatives License (http://creativecommons.org/licenses/by- nc-nd/4.0/), which permits non-commercial re-use, distribution, and reproduction in any medium, provided the original work is properly cited, and is not altered, transformed, or built upon in any way.
The shade avoidance syndrome in plants is widely acknowledged as ecologically significant. This is because it is a functional mechanism that increases the ability of plants to reach or exploit light in the presence of compe-tition. Stem elongation, for example, can result in longer shoots with the top leaves reaching above the canopy of competitors. The presence of this functional response in natural populations implies that past evolution has shaped the plant plasticity to light conditions. However, contemporary evolution requires both actual selection pressures and heritable variation. In terms of selection, the shade avoidance syndrome is often considered to be adaptive, and several studies have demonstrated a fitness advantage associated with its expression under neigh-bour shade (van Kleunen and Fischer 2001; Schmitt et al. 2003; Bell and Galloway 2007). In terms of heritable variation, knowledge is growing about the molecular mec hanisms underlying the plastic response of plants to shade in mutant and inbred lines. Most data on the heritable genetic variation for the magnitude of this plastic response is based on inbred lines and variation between specific mutants (e.g. Schmitt et al. 1995; Dono hue et al. 2000; Botto and Smith 2002; Huber et al. 2004). In contrast, knowledge regarding the presence of stand-ing genetic variation for this plastic response is scarce in natural populations. Two notable exceptions are the stu dy of Bell and Galloway (2007) on Geranium
carolinia-num L., and a series of studies from Donohue and collea
gues in field-derived inbred lines of Impatiensis capensis Meerb (e.g. Donohue and Schmitt 1999; Donohue et al.
2000; Huber et al. 2004). The presence of standing heri-table variation for the expression of the plant response to shade at the scale of natural populations is the specific knowledge gap addressed by this study.
In this article, we investigated the plastic response to a modification of its environment induced by shade in individuals of four natural populations of Antirrhinum
majus L. in a common garden experiment. Our aim was
to evaluate the evolutionary potential of their plastic response to shade. A. majus grows in Mediterranean garrigues (dry scrubland comprised of a mixture of shrub and herb species) and Pre-Pyrenean mountain habitats, where there is variation in plant density and competition for light at both spatial and temporal scales. We therefore expected natural A. majus popula-tions to exhibit a suite of plastic responses that are typical of the shade avoidance syndrome. We tested for a genetic component of plasticity variation by eval-uating whether related individuals express a more simi-lar plastic response than non-related individuals. We used a quantitative genetic approach to test for 1) the presence of a plastic response to shade in these four natural populations, and 2) genetic variation for this plastic response in these populations, and for each trait within the light and shade treatments separately, which would provide evidence for its evolutionary potential.
Material & methods Study species
Antirrhinum majus L. is an hermaphroditic, self-
incompatible (Andalo et al. 2010), short-lived perennial species, from the Plantaginaceae family. It has a patchy distribution in the eastern half of the Pre-Pyrenees and in the Mediterranean region, from Barcelona (Spain) to Montpellier (France) (Khimoun et al. 2013) at altitudes ranging from 0 to 1900 meters above sea level (Andalo et al. 2010). Antirrhinum majus is a species that colonises open habitats, typically limestone or siliceous substrates, and is adept at colonising screes, road banks and stone walls. Antirrhinum majus is characterised by a wide var-iation of floral morphology and colour and is easy to grow, with cultivated varieties being widely used in hor-ticulture. Two subspecies have been described; A. m. pseu
domajus and A. m. striatum, which are respectively
char-acterized by magenta and yellow flowers. In this study, we studied A. m. pseudomajus populations. It has a diploid genome (2n = 16) and has become an important model in population genetics, speciation studies, and floral devel-opment research (Schwarz-Sommer et al. 2003). Seed collection in wild populations
The plants used in this experiment originate from four natural populations of A. m. pseudomajus (Khimoun et al. 2011): Bages (BAG), Banyuls-sur-mer (BAN), Lagrasse (LAG), and Besalù (BES), which are located in Southern France and North Eastern Spain (Supplementary file 1). The general habitat of these four populations is typical of Mediterranean garrigues. In this dry environment, plants grow in a large variety of microhabitats, including open and shaded areas. The four populations used in this study were chosen on the basis of their high environmental heterogeneity in vegetation cover, resulting in different light condi-tions within a population. This choice was motivated by the expectation that shade is a stable cue for the presence of vegetation cover in these habitats and that plasticity is more likely to occur in predictably hetero-geneous environments (Via and Lande 1985). Additionally, these four populations are significantly genetically differentiated at neutral markers (FST ran-ging from 0.08 to 0.12, Pujol et al. 2017) and thus can be considered as population replicates within the spe-cies level. In each population, we collected fruits that contained hundreds of seeds on 30 to 50 mature dis-tant individuals in October 2011.
First generation of parents in a common environment
In order to reduce the influence of parental environ-mental effects, we grew a first generation of plants from
the seeds collected in the wild in a common environ-ment during spring 2012 in the greenhouse at the CNRS experimental station in Moulis (Station d’Ecologie Théorique et Expérimentale, Moulis, France). We per-formed within-population crosses during spring and summer 2012 between maternal plants (BAG: 24 mothers, BAN: 25 mothers, BES: 23 mothers, LAG: 15 mothers) and different paternal plants (three to five paternal plants, sometimes including a plant that was used as a maternal plant in other crosses, were used to pollinate different flowers on a given maternal plant). This design produced three to five groups of full sibs (corresponding to three to five different fruits) polli-nated by different paternal plants per maternal plant. At the global level, the fruits produced included a large amount of half sibs (groups of 25 to ca.100 plants shared either a father or a mother in the experimental plant po pulation), which optimises the relatedness variance for quantitative genetic analyses. Mature seeds were col-lected during autumn 2012 and were stored in paper bags at room temperature. Subsequently, we used the seeds produced in this common environment to per-form a further common garden experiment where we manipulated shade levels.
Common garden experiment
In June 2014, we sowed seeds from 14 to 16 full sib families per population (Supplementary file 1) in peat- based universal compost in 8*8*7 cm pots. We sowed three seeds per pot. As soon as a seed germinated, seed-lings that were found in excess in a pot (more than one) were transplanted into another pot. Around 900 seeds were sown and 336 seeds germinated and survived. These pots were spatially randomized in the EDB labora-tory experimental garden at the Ecole Nationale Supéri eure de Formation de l’Enseignement Agricole (ENSF EA, Toulouse-Auzeville). The bases of the pots rested on an irrigation mat (400 g/m2) to regulate moisture con-tent. A layer of soil of a few centimetres covered the base of the pots and the irrigation mat. To limit neighbour interference, pots were separated by at least 20 cm. On the 336 plants that grew, 88 individuals flowered. From June until September, approximately half the plants (n = 169) were exposed to natural light. The other half (n = 167) was exposed to a shade treatment. We ran-domly assigned half of the plants within each family to each treatment prior to the experiment. Shade was cre-ated for each plant individually, using vertical tunnels (height = 40 cm) that filtered the light that could reach the plant. These tunnels were made of a metallic mesh shaped into a tube, which was covered in green shading cloth, with an open top to allow for biotic interactions. No herbivory was recorded, probably as a result of the experimental garden isolated location and setting. Whether pollinators also had limited access to the plants is irrelevant to this study because we did not quantify
plant reproductive success. We did not separate the direct effect of shade on plants from its potential indirect effects: reduced temperature, increased humidity and reduced mechanical disturbance caused by wind. All plants were watered similarly, with no nutrient addition, only when the lack of natural rain made it necessary to provide water to ensure the survival of plants in small pots. Average monthly temperatures ranged from 20.6°C to 21.5°C, and cumulative monthly rainfall ranged from 28.3 to 73.4 mm.
The shade treatment modified the light spectrum that the plants received (Supplementary file 2). In particular, it reduced the levels of Photosynthetically Active Radiation (PAR). PAR measurements were tak en once on a sunny day with a spectrometer (model AVASPEC-ULS 2048-USB2, Avantes, Apeldoorn, the Netherlands), from 8 am to 12 am, with one measure-ment per minute. The average PAR in the light treat-ment was 390.6 µmol.m−2.s−1, and its average in the shade treatment was 107.2 µmol.m−2.s−1. The average Red to Far Red ratio (R/FR) was reduced from 2.4 in the light to 1.7 in the shade, as expected from the effect of a green shading cloth.
Trait measurements
In order to quantify the response of plants to shade in the different populations, we took measures of plant height, internode length, and specific leaf area (SLA). We measured the vegetative height of every plant 40 days after germination, measured as distance (in centimetres) between the ground level and the last node at the top of the plant, or the last node below the first inflorescence if an individual flowered. We counted the number of nodes on this part of the stem, and divided the height by the number of nodes to obtain the mean internode length of 40-day-old plants (Internode 40 days, available for 327 individuals beca use 9 plants did not reach 40 days).
A similar measure was recorded at the date of first flowering (Internode first flower). However, flowering inhibition in the shade treatment resulted in very unba-lanced data for this trait (N = 67 in the light and N = 21 in the shade, half of the latter belonging to the LAG population). We therefore chose not to perform analy-sis on this measurement other than testing for its cor-relation to the other measurements of internode length (see below). In order to obtain a measure of internode length for every individual, we measured the average internode length of the first six nodes of the stem start-ing from the base of the plant (Internode six nodes), on both flowering and non-flowering plants at the end of the experiment (N = 336).
For every plant, we estimated the specific leaf area (SLA), which is the ratio of the leaf area to its dry mass. For this, we sampled five mature non-senescent leaves on each plant. These leaves were stored in water and in
the dark during 6 h to 8 h before being scanned. They were then kept in silica gel until drying in the oven at 65°C for three days before weighing. SLA was derived by taking the ratio of the area of leaves to the mass of the dried leaves (cm2.g−1).
Finally, at the end of the experiment, we estimated the total height of each plant, from the ground level to the top (Height, which includes the height of the inflorescence in individuals that flowered), and recorded whether each plant had flowered (Flowering).
Statistical analysis Trait correlations
The first statistical analysis that we ran estimated the correlation between our three measurements of inter-node length (Interinter-node 40 days, Interinter-node first flower and Internode six nodes), by using a Pearson correla-tion test, to evaluate whether these traits were provid-ing similar information. As these measures were well correlated, we only present analysis involving Interno
de six nodes, for which we had most data. We used the
statistical program R (R Core Team 2016) to estimate Pearson correlations.
Model 1: quantitative genetic linear mixed model to estimate families-level reaction norms
The second statistical analysis that we ran was a quantitative genetic linear mixed model. We used it to estimate the effect of the population of origin (Population) and the shade treatment (Shade) on
Height, SLA, and Internode six nodes and the genetic
variation of the plastic response. Genetic variation was estimated by the among-family variation of slopes between the two treatments (i.e. magnitude and direc-tion of the change in trait values). We approximated the genetic variance underlying the plastic response by using the family effect which includes various degrees of genetic relatedness (e.g. Scheiner and Lyman 1989). This model was based on the availability of measure-ments for several members from the same maternal family in each treatment, which allowed us to estimate the between-family variance of the slope of the reac-tion norm between the light and the shade environ-ments. This model included Shade and Population as fixed factors, as well as their interactions. The random part of the model included the interaction Mother:
Shade, which allowed us to test whether individuals
from different families had different reaction norms, thereby testing for the genetic basis of trait reaction norms in the broad sense. This model provided esti-mates for the between-family trait variance (intercept) in the light treatment. The variance term for the inter-cept was set for the light condition as the reference level but we also present the between-family trait
variance for the intercept in the shade treatment. This model also provided estimates for the between- family variance of the slope of the reaction norm between light and shade as well as the covariance between the intercept value measured in the light treatment and the slope of the reaction norm. We allowed for, estimated and present different residual variances for light and shade treatments. For all these estimates, we present the posterior predicted 95% credible intervals.
Model 2: a second quantitative genetic linear mixed model
We ran two slightly different models that addressed slightly different questions. This second model was also a quantitative genetic linear mixed model. This approach is commonly used to decompose environ-mental and genetic effects (Charmantier et al. 2008; Pujol and Galaud 2013). We used it to consider the phenotypes expressed in the different environments as different traits, which allowed us to estimate the genetic covariance and calculate the genetic correla-tion between the two states (following the approach by Via and Lande 1985). This model thereby evaluates the independence of trait genetic variation between light and shade. The second model is a quantitative genetic linear mixed model, often referred to in the literature as the “Animal Model”, with Animal referring to the additive genetic components estimated by the model. This model fully accounts for the different degrees of relatedness that can be identified in a population. In our dataset, the different degrees of relatedness between individuals were restricted to full sibs and half sibs, the only ones available to us from our cross-ing design. The added value of this approach com-pared to a classical linear mixed model is that it uses the relationship between individuals separated by dif-ferent degrees of relatedness to estimate breeding values and thus the additive genetic component of the trait (the Animal random factor in this model). One must note that although this model produced estimates of the additive genetic component of phe-notypic variance in each environment, this genetic effect was likely confounding additive, dominant and epistatic genetic effects in the absence of parent- offspring and double first cousin phenotypic data, thereby estimating the broad sense rather than the narrow sense genetic components of trait variance. This model included the same fixed effects as the first model: Shade, Population and their interaction. In order to estimate the additive genetic variance com-ponent in both treatments adequately, we excluded the possibility of a bias caused by the lack of independence of the estimates between the two treatments. To achieve this, we used an unstructured variance- covariance matrix between Animal (additive genetic
component) and Shade (environmental treatments). We then built a bivariate model where trait values obtained under shade and light could be analysed separately. We also used this model to estimate the genetic covariance between the two treatments. We derived genetic correlations between the trait value in the light environment and the trait value in the shade environment for each trait on the basis of these covariances (Falconer and Mackay 1996). This genetic correlation shows how the expression of the phenotype is affected across the two environments. Finally, a heterogeneous residual variance was included for each shade treatment, allowing different residual variances in the light and shade, but no cov-ariance between the residuals in the two treatments. For all these estimates, we present the posterior pre-dicted 95% credible intervals.
Common features of the two quantitative genetic linear mixed models
The two models were fitted in a Bayesian framework using MCMCglmm (Hadfield 2016) in the statistical program R (R Core Team 2016). Default prior assign-ments followed an inverse-wishart distribution (V = diag(2) and nu = 3 for the Animal:Shade (with animal being the default name for the additive genetic component in the MCMCglmm package) and the
Mother:Shade effects, and V = diag(2) and
nu = 0.002 for the residuals). We used a burn-in time of 900,000–4,800,000 iterations – thi
nning of 3000. These parameters were chosen because they allowed us to sample the posterior distribution 1300 times (except for Internode six nodes, where we used 1,500,000 burning iterations – 8,000,000 itera-tions – 5000 thinning to reduce autocorrelation). We used posterior distributions and model autocorrela-tion to assess the quality of model runs. Finally, we ran identical models with identical priors five times and used the Gelman–Rubin convergence criterion to assess run quality. This step yielded identical results, demonstrating high reliability between runs. 95% Credible Intervals (CIs) were derived from the runs for all parameters. The P values derived from Chi- squared tests were used for fixed effects. Random effects were considered significant if their 95% credible intervals did not overlap 0. Another approach that is often used to interpret whether random effects (family effects in model 1 and genetic effects in model 2) are meaningful is to compare a model with the random effect of interest and a simpler model excluding this factor by using information criterions (e.g. parametric linear models coefficient of determination R2 and Akaike Infor
mation Criterion for maximum likelihood estimates, Deviance Information Criterion for Bayesian linear models). An information criterion showing that
more information is explained by the more complex model reflects a better fit of the data by the model including a meaning
ful random effect. However, this approach conducted by comparing DIC between Bayesian GLMMs may suffer methodological caveats (MacKenzie et al.
2018). We therefore chose to use CIs as explained above because this approach is highly reliable and gives all the necessary information about the para-meter estimate. For example, a large but positive CI around a large parameter estimate value does confirm that the parameter estimate can be considered positive but also means that its value is imprecise and should not be considered to be high. Such information is relevant to evaluate whether the phenotypic variation of populations sampled in the wild has a genetic basis in an experimental setting. We did not compute the heritability estimates for reaction norms based on our experimental sibship data recorded in artificially mod-ified environments because it would not provide meaningful quantitative information about the evolu-tionary potential of wild populations.
Results
Trait correlations
The three measures of internode length were strongly positively correlated (Internode six nodes and Internode
40 days: ρ = 0.60, p < 10−15, Internode six nodes and
Internode first flower: ρ = 0.73, p < 10−15, Internode
40 days and Internode first flower: ρ = 0.57, p < 10−7). We chose to focus on only one of these measurements, the Internode six nodes for the following analyses because this is the measure for which we had the most data. Trait means
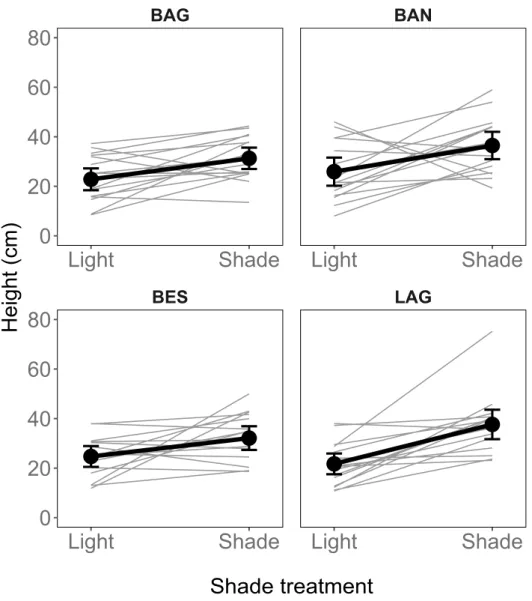
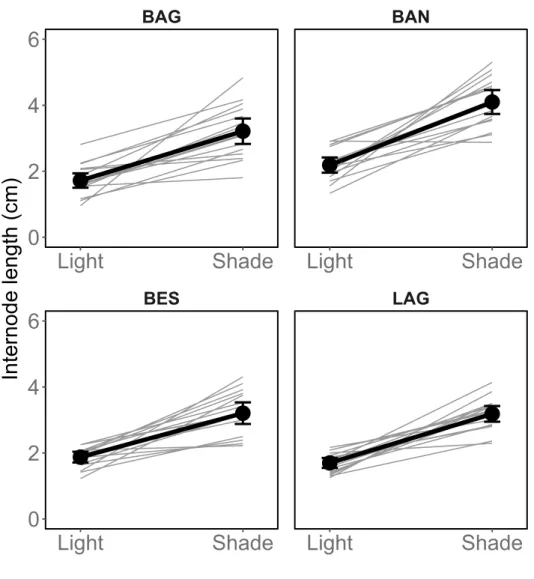
Table 1 presents trait values in the light and shade trea-ments. Overall, mean Height was 29.4 cm (sd = 16.2 cm) and was 23% to 42% less in the light than in the shade depending on the population (Figure 1). Overall, mean internode length (Internode six nodes) was 2.6 cm (sd = 1.1 cm) and was, depending on the population, 42% to 47% shorter in the light than in the shade (Figure 2). Overall, average SLA was 285.8 cm2.g−1 (sd = 158.1 cm2.g−1) and was 63% smaller in the light than in the shade (Figure 3). The probability of Flowering was 53% to 85% lower in the shade than in the light. We did not conduct an in-depth statistical analysis of this trait because too few plants flowered.
Model 1: quantitative genetic linear mixed model estimating families-level reaction norms
The effect of Shade on Height was significant (Table 2,
– 35.8)). No differences in mean Height were detected among the four populations (Table 2, Supplementary file 3). There was no interaction between Population and the Shade treatment, as shown by null parameters for the
interaction term (Supplementary file 4). There was sig-nificant variance between families for the intercept, i.e. mean trait values differed among families in the light treatment (VLight = 0.14 (CI: 0.09 – 0.27), VShade = 0.25
Figure 1. Longer stems in the shade than in the light. Average responses and family responses are presented for the four populations BAG, BAN, BES, and LAG. Grey: family means. Black dots and lines: population means based on family means. Error bars represent 95% credible intervals. These estimates are raw data summary statistics.
Table 1. Phenotypic trait values in the light and in the shade, by population. Population means (sd) for the traits in all four populations, in both the light and shade environments.
Trait Population Light Shade
Flowering (probability) BAG 0.4 (0.3) 0.1 (0.1) BAN 0.3 (0.3) 0 (0.1) BES 0.4 (0.3) 0.1 (0.2) LAG 0.4 (0.3) 0.2 (0.3) Height (cm) BAG 22.8 (9.3) 31.3 (8.8) BAN 25.9 (11.6) 36.5 (11.3) BES 24.7 (8.4) 32.1 (9.8) LAG 21.7 (8.6) 37.6 (12.2) Internode six nodes (cm) BAG 1.7 (0.5) 3.2 (0.8) BAN 2.2 (0.5) 4.1 (0.7) BES 1.9 (0.3) 3.2 (0.7) LAG 1.7 (0.3) 3.2 (0.5) SLA (cm2.g1) BAG 151 (18.2) 411.9 (98.4) BAN 156.1 (24) 431.7 (98.7) BES 167.9 (14.5) 449.5 (88.6) LAG 145.6 (15.9) 397.3 (60.6)
(CI: 0.15 – 0.37), Table 3). Families also significantly differed in their response to the shade treatment: there was significant variance between families for the slope of the reaction norm (Vslope = 0.17 (CI: 0.1 – 0.31), Table 3). The covariance between the intercept (in the light) and
the slope of the reaction norm was not different from zero (cov = 0.02 (CI: −0.11 – 0.14), Table 3).
The effect of Shade on Internode six nodes was signifi-cant (Table 2, Light: 1.9 cm (CI: 1.8 – 2); Shade: 3.4 cm (CI: 3.2 – 3.6)). There were significant differences in ave
Figure 2. Longer internode length in the shade than in the light. Average responses and family responses are presented for the four populations BAG, BAN, BES, and LAG. Grey: family means. Black dots and lines: population means based on family means. Error bars represent 95% credible intervals. These estimates are raw data summary statistics.
Table 2. Significance tests for the Population and the Shade treatment. Chi-square tests are given for the fixed effects of the two models and the three traits of interest (Height, Internode six nodes, and SLA).
Trait model D.I.C. Treatment Chi2 D.f. P.
Log Height Model 1 604.2 Population 1.5 6 0.96
Shade 22.7 4 0.00
Model 2 282.8 Population 1.3 6 0.97
Shade 15.3 4 0.00
Internode 6 nodes Model 1 754.6 Population 15.8 6 0.01
Shade 165.7 4 < 10-3
Model 2 475.8 Population 15.7 6 0.02
Shade 114.0 4 < 10-3
Log SLA Model 1 −55.2 Population 1.9 6 0.93
Shade 314.9 4 < 10-3
Model 2 −898.2 Population 4.9 6 0.55
Shade 304.0 4 < 10-3
rage internode length among populations (Table 2, Supplementary file 3), but no interaction between
Population and Shade (Supplementary file 4). There was
significant variance between families for the intercept (VLight = 0.18 (CI: 0.10–0.27), VShade = 0.4 (CI: 0.23 –
0.65), Table 3). There was significant variance between families for the slope of the reaction norm (Vslope = 0.31 (CI: 0.16 – 0.56), Table 3). The covariance between the intercept and the slope of the reaction norm was not different from zero (cov = − 0.04 (CI: − 0.14 – 0.02),
Table 3).
The effect of Shade on SLA was significant (Table 2,
Light: 153.4 m2.g−1 (CI: 139.5–165.6); Shade: 412.5 cm2. g−1 (CI: 357.6–459.4)). No differences in average SLA were detected among the four populations (Table 2, Supplementary file 3). There was no interaction between
Population and the Shade treatment (Supplementary
file 4). There was significant variance between families for the intercept (VLight = 0.08 (CI: 0.05 – 0.12), VShade
= 0.14 (CI: 0.1 – 0.24), Table 3) and for the slope of the reaction norm (Vslope = 0.1 (CI: 0.07 – 0.17), Table 3). The covariance between the intercept and the slope was not different from zero (cov = −0.01 (CI: − 0.04 – 0.02),
Table 3).
In summary, all studied populations of A. majus exhibited a strong response to shade for all the three traits. There was no evidence of an interaction between
Population and Shade in any of the traits (Supplementary
file 3).
Model 2: a second quantitative genetic linear mixed model
The effect of Shade on Height was significant (Table 2,
Light: 20.6 cm (CI: 17.3 – 23.8); Shade: 30.2 cm (CI:
26.6 – 36)). No differences in mean Height were detec ted among the four populations (Table 2, Supplement ary file 3). There was additive genetic variance in both
populations BAG, BAN, BES, and LAG. Grey: family means. Black dots and lines: population means based on family means. Error bars represent 95% credible intervals. These estimates are raw data summary statistics.
light (VLight = 0.24 (CI: 0.12 – 0.54), Table 4) and shade (VShade = 0.28 (CI: 0.15 – 0.43), Table 4). The genetic covariance of the trait in the Light and Shade treatment was null, and with large credible intervals (Table 4).
The effect of Shade on Internode six nodes was signifi-cant (Table 2, Light: 1.9 cm (CI: 1.7 – 2.1); Shade: 3.4 cm (CI: 3.2 – 3.7)). There were significant differences in average internode length among populations (Table 2, Supplementary file S3). There was additive genetic var-iance in both light (VLight = 0.26 (CI: 0.14 – 0.54), Table 4) and shade (VShade = 0.44 (CI: 0.24 – 1.17), Table 4), but no genetic covariance of the trait between the Light and
Shade treatment (Table 4).
The effect of Shade on SLA was significant (Table 2,
Light: 151.1 cm2.g−1 (CI: 141 – 161.3); Shade: 340.3 cm2. g−1 (CI: 373.6 – 445.6)). No differences in average SLA were detected among the four populations (Table 2, Supplementary file 3). There was additive genetic var-iance in both light (VLight = 0.06 (CI: 0.05 – 0.08), Table 4) and shade (VShade = 0.11 (CI: 0.08 – 0.13), Table 4), but no genetic covariance of the trait between the Light and
Shade treatment (Table 4).
In summary, all studied populations reacted strongly to shade, Model 2 estimated null (and small) covariances between the Light and Shade treatment, which means that individuals with high trait values in the light did not consistently have high (or low) trait values in the shade
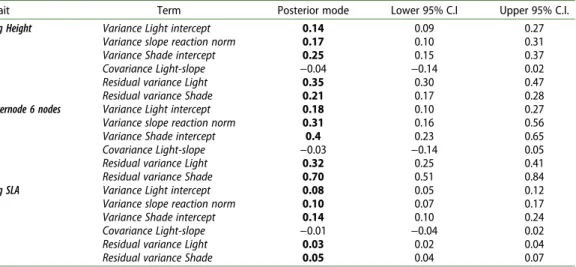
Table 3. Model 1. Family variation in the intercept and the slope of the reaction norm. Parameter estimates for the random effects estimated by Model 1 are given by the posterior mode estimates and their 95% credible intervals (C.I.). In this table, we present the family variance for the intercepts of the light and shade treatments (Variance Light of Shade intercept), the family variance for the slope of the reaction norm (Variance slope reaction norm), the covariance between the intercept of the light treatment and the slope of the reaction norm (Covariance Light-slope), and the residual variances in the two treatments (Residual variance Light and Shade) for the three traits of interest (Height, Internode six nodes, and SLA). Height and SLA were log transformed to meet the assumptions of the linear model. Values that were considered significant after examination of their credible intervals are presented in bold.
Trait Term Posterior mode Lower 95% C.I Upper 95% C.I.
Log Height Variance Light intercept 0.14 0.09 0.27
Variance slope reaction norm 0.17 0.10 0.31
Variance Shade intercept 0.25 0.15 0.37
Covariance Light-slope −0.04 −0.14 0.02
Residual variance Light 0.35 0.30 0.47
Residual variance Shade 0.21 0.17 0.28
Internode 6 nodes Variance Light intercept 0.18 0.10 0.27
Variance slope reaction norm 0.31 0.16 0.56
Variance Shade intercept 0.4 0.23 0.65
Covariance Light-slope −0.03 −0.14 0.05
Residual variance Light 0.32 0.25 0.41
Residual variance Shade 0.70 0.51 0.84
Log SLA Variance Light intercept 0.08 0.05 0.12
Variance slope reaction norm 0.10 0.07 0.17
Variance Shade intercept 0.14 0.10 0.24
Covariance Light-slope −0.01 −0.04 0.02
Residual variance Light 0.03 0.02 0.04
Residual variance Shade 0.05 0.04 0.07
Table 4. Model 2. Genetic additive variance (Va) and covariances between light and shade. Parameter estimates for the random effects estimated by Model 2 are given by the posterior mode estimates and their 95% credible intervals (C.I.) for the three traits of interest (Height, Internode six nodes, and SLA). The last two traits were log transformed to meet the assumptions of the linear model. Values that were considered significant after examination of their CI are presented in bold.
Trait Term Posterior mode Lower 95% C.I. Upper 95% C.I.
Log Height Va Light 0.24 0.12 0.50
Va Shade 0.28 0.15 0.43
Genetic covariance Light-Shade 0.02 −0.11 0.14
Residual variance Light 0.22 0.07 0.35
Residual variance Shade 0.00 0.00 0.16
Internode 6 nodes Va Light 0.26 0.14 0.54
Va Shade 0.44 0.24 1.17
Genetic covariance Light-Shade −0.02 −0.23 0.24
Residual variance Light 0.15 0.00 0.24
Residual variance Shade 0.00 0.00 0.61
Log SLA Va Light 0.06 0.05 0.08
Va Shade 0.11 0.08 0.13
Genetic covariance Light-Shade 0.00 −0.02 0.02
Residual variance Light 0.00 0.00 0.01
environment. Consequently, the very weak genetic cor-relations derived from these covariances had very large credible intervals (Log Height: 0.16 (CI: -0.32 – 0.49);
Internode six nodes: 0.10 (CI: -0.44 – 0.45); Log Log SLA: −0.02 (CI: -0.25 – 0.21)).
Discussion
Our results showed that A. majus plants have a large phenotypic plastic response to shade and its potential indirect effects on humidity, temperature and mechanical disturbance. When exposed to shade, A. majus plants increased in height, internode length, and SLA, typical of the shade avoidance syndrome (Smith and Whitelam
1997). In a situation where light may become, or is already, scarce, stem elongation through increased dis-tance between nodes and/or stem height is expected to allow plants that are not shade tolerant to outgrow com-petitors. An increase in SLA in the shade, while techni-cally not a shade avoidance strategy, is a functional response that has often been observed (Lewandowska and Jarvis 1977; Dong 1995; Evans and Poorter 2001; van Kleunen et al. 2011; Liu et al. 2016), and is expected to improve the physiological performance of plants in a light-limited environment. However, caution must be taken when interpreting SLA because its increase might also reflect a failure of plants to maintain adequate mass balance in tissues, possibly as a consequence of resource limitation (e.g. light restriction, given the large reductions in PAR experienced by plants in the Shade treatment).
Similar plastic responses have been observed in other studies involving A. majus or other Antirrhinum culti-vars. In A. majus cultivars, Munir et al. (2004) found increased total height and reduced branching at lower light intensity and Khattak and Pearson (2005) found higher internode length in reaction to light filtering. In addition, Cremer et al. (1998) observed shorter flowering time under low R/FR ratio in an inbred A. majus line (Sippe50). Our results demonstrate the existence of a plastic response to shade of A. majus plants from wild populations and suggest the possibility of a shade avoid-ance syndrome in A. majus. The R/FR levels are relatively high in our experiment. They are usually lower under canopy shade. The high R/FR levels in the present experi-ment were probably too high to induce the full suite of responses to canopy shading and limited plants to mainly express response to reduced PAR, temperature, mechan-ical disturbance and increased humidity. One reason for the high R/FR levels in the shaded plants may have been the use of green shade cloth, which might not have significantly differed from black shade cloth. In order to simulate canopy shade r-absorbing filters have to be used, where the spectral composition is changed after the light passes through the filter.
Furthermore, we did not observe different levels of plasticity in the four populations. These populations are characterized by high habitat heterogeneity. The low
population differentiation might indicate that there has been little variation in selection pressures among popula-tions. Caution must nevertheless be taken when extra-polating our results to the natural environment. Our results do not necessarily mean that plants from these populations will express the same responses when grow-ing in wild conditions. Complex environments may con-strain the expression of plasticity, particularly if some phenotypes are more costly than others in a particular set of conditions (Donohue et al. 2000; Huber et al. 2004). The plastic response to shade is an evolutionary labile trait that can be lost quickly during evolutionary transi-tions, even at the within-species scale, such as between wild populations and cultivars (Pujol et al. 2005). However, the combined results from past studies of
A. majus cultivars and this study support the hypothesis
that plasticity is widespread among A. majus populations, whether it evolved post-speciation or was conserved from ancestral species.
For such a set of plastic responses to evolve, or to be conserved, individuals need to have access to reliable cues that describe the current and/or future light environment. Plants usually rely on a reduction of the ratio of red to far- red radiations (R/FR ratio) as a cue indicating the pre-sence of competitors for light: plant responses under reduced R/FR ratios are similar to those observed in dense patches where there is competition for light (Smith 1982; Ballaré et al. 1987, 1990). The reduction of total light intensity, and in particular blue light, also induces a response to shade in some species (Ballaré
1999; Pierik et al. 2004; Franklin 2008, 2016; Ballaré and Pierik 2017). Previous studies on A. majus inbred lines and cultivars showed that the reduction of both the R/FR ratio and the amount of blue radiation are likely to be involved in A. majus response to shade (Cremer et al.
1998; Khattak and Pearson 2005). However, no study had evaluated this plastic response in A. majus plants origi-nating from natural populations. In our experiment, we did not attempt to test these two cues in isolation. Instead, we evaluated the effect of a controlled light environment simulating competition for light but excluding other effects of high density (e.g., plant hormones modification, nutrient or water competition), and found that A. majus responded strongly to this controlled light environment, suggesting that either reduction of light intensity, R/RF ratio or both act as cues in this species.
We performed a study of the population variation of plant responses to shade, both between populations and between families, for several morphological and func-tional traits. Our results showed that families within populations varied in their phenotypic plasticity induced by shade, thereby supporting the presence of a genetic basis for this variation in plasticity. Family effects are often used to evaluate the genetic component of trait variation because members of the same family are geneti-cally related (Lynch and Walsh 1998). This heritable variation in plasticity must be interpreted in the broad
sense because it encompasses additive genetic, dominan ce, maternal, and epistatic effects. While growing the parental generation in a common environment reduces the possible environmental component of maternal effec ts, it does not entirely eliminate it, and we cannot distin-guish between all components of variance with our design.
Genotype by environment interactions are often fou nd in studies of phenotypic plasticity (Pigliucci 2005). However, only a few cases of GxE interactions were docu mented for the plastic response of plants to shade or competition. For example, Donohue and Schmitt (1999) found a G × E interaction in the plastic response to plant density in natural settings, using inbred lines of Impatiens
capensis Meerb. Botto and Smith (2002) found a G × E
interaction for the plastic response of Arabidopsis
thali-ana (L.) Heynh. accessions to R/FR ratio modifications.
However, for the shade avoidance response, most known G × E interactions correspond to comparisons between a plant wild type and mutant lines (Skalova and Krahulec
1992; Andersson and Shaw 1994; Schmitt et al. 1995,
2003), or between populations (Pigliucci et al. 1995; Van Hinsberg 1997), and habitats (Humphrey et al.
2018). Results from past studies did not necessarily sup-port family variation in the plastic response to shade, i.e. variation in the slope of the reaction norm in plants from natural populations (e.g. Andersson and Widén 1994). As this genetic variation in the plastic response is the basis for the evolution of different degrees of plasticity, our results imply that A. majus populations have the potential to evolve under selection for higher or lower plasticity when grown under controlled conditions.
Whether the population evolutionary potential of a trait provided by its genetic variation can be realised in wild populations depends obviously on the presence of selection pressures that could not be quantified in this experimental setting. Under natural selection pressures, other biological mechanisms might however be acting as potential constraints to the response to selection (Pujol et al. 2018). In terms of trait reaction norms, pleiotropy between the differential expression of a trait in different environments might constrain the evolution of plasticity (Via and Lande 1985; van Kleunen and Fischer 2005). We therefore investigated trait genetic covariance between the two environments in each of our three traits and found no genetic covariances between trait values mea-sured in the light and in the shade treatment, in all traits. Furthermore, the family means in the light treatment did not strongly co-vary with the slope of the reaction norm, which suggests no genetic correlations between the trait value in the light treatment and the plastic response. Collectively, these results suggest few genetic constraints on the differential expression of the trait in the light and in the shade, with genes involved in the mean trait response in one environment likely independent from the genes acting on the plastic response. This might be
because genes expressed in the light environment are mostly different from the genes expressed in the shade environment. The absence of genetic covariance allowing families to evolve independently in a given environment might be the underlying mechanisms shaping the between-fami
ly variation in the A. majus plastic response to shade. A limitation of our approach is that the lack of genetic covariance between trait expression in light and shade may be masked by uncontrolled-for covariates that vary between Families (e.g. growth rate, growth rate under resource limitation). In contrast, other studies that esti-mated the genetic covariance or correlations between traits under light and shade conditions found a much higher correlation between the mean of the trait and the magnitude of the plastic response (Donohue and Schmitt
1999; Donohue et al. 2000). Whether the surprising lack of genetic covariance between environments that we detected questions the value of analysing plasticity as a trait in itself through the analysis of its family variation as a proxy for its genetic variation is a general hypothesis that would deserve further investigation. The relevance of our findings is obviously limited to their experimental background and it would be useful to evaluate whether our conclusions hold in the more stringent natural set-tings of the four natural populations that we studied. Nevertheless, our current findings suggest that genetic correlations between the differential expression of shade responsive traits in light and shade do not constrain the reaction norm to shade in these A. majus populations. Conclusion & perspectives
Our experimental findings imply that A. majus plants can react to shade, its indirect effects on temperature, humid-ity and mechanical disturbance, and might potentially play a role in the competition for light in natural popula-tions. This plasticity gives them the potential to respond to the temporal and spatial variation of density. Our results support the presence of genetic variation for the traits under both light and shade environments, between- family variation for the slope of the reaction norm, with no evidence for genetic correlations that could constrain the evolution of plasticity. Collectively, our findings sug-gest a plausible shade avoidance syndrome in A. majus but more investigations are needed to validate that spe-cific aspect. To this aim, it is indeed necessary to take into account the allometric relationship between the plasticity of morphological traits and the plant overall growth under shade, and whether this relationship leads to fitness benefit in the presence of heterogeneous vegetation cover. Our findings strongly support the presence of heritable variation for the plastic response to shade in A. majus populations with the possibility for selection to act inde-pendently on trait values under shade and under light. This heritable variation, which represents the potential
for this plastic response to evolve in response to selection, might be widespread in A. majus populations.
Acknowledgments
We thank David Field, Caroline Thomson and Isabel Winney for constructive comments on this manuscript. We thank Alexandra Magro and Jean-Louis Hemptinne for providing the access to the experimental field at ENSFEA, and technicians at ENSFEA for their help at the experimental site, Castanet Tolosan, France. This project has received funding from the European Research Council (ERC) under the European Union’s horizon 2020 research and innovation program (grant agreement No ERC-CoG-2015-681484-AN GI) awarded to BP. This work was supported by funding from the French “Agence Nationale de la Recherche” (ANR-13- JSV7-0002 “CAPA”) to BP. This project was also supported by the ANR funded French Laboratory of Excellence projects “LABEX TULIP” and “LABEX CEBA” (ANR-10-LABX-41, ANR-10-LABX-25-01).
Author contributions
BP conceived the study. SM, JA and CB ran the experiment. SM, JA, CB and VB recorded the data. MM, JA and LG ran the analyses. MM and BP wrote the paper. All authors commented the manuscript.
Data archiving
Phenotypic data and pedigree data used in this article are available on Zenodo Open Aire repository, DOI: 10.5281/ zenodo.3963754
Disclosure statement
The authors declare no conflict of interest.
Funding
This work was supported by the Agence Nationale de la Recherche [ANR-13-JSV7-0002 CAPA]; European Research Council [ERC-CoG-2015-681484-ANGI].
ORCID
Benoit Pujol http://orcid.org/0000-0001-9703-6760
References
Andalo, C, M Cruzan, C Cazettes, B Pujol, M Burrus, C Thébaud. 2010. Post-pollination barriers do not explain the persistence of two distinct Antirrhinum subspecies with parapatric distribution. Plant Syst Evol. 286(3–-4):223–234. doi:10.1007/s00606-010-0303-4.
Andersson, S, RG Shaw. 1994. Phenotypic plasticity in Crepis
tectorum (Asteraceae): genetic correlations across light
regimens. Heredity. 72(2):113. doi:10.1038/hdy.1994.17. Andersson, S, B Widén. 1994. Reaction norm variation in
a rare plant, Senecio integrifolius (Asteraceae). Heredity. 73(6):598. doi:10.1038/hdy.1994.167.
Ballaré, C. 1999. Keeping up with the neighbours: phytochrome sensing and other signalling mechanisms. Trends Plant Sci. 4 (3):97–102. doi:10.1016/S1360-1385(99)01383-7.
Ballaré, C, R Pierik. 2017. The shade-avoidance syndrome: multiple signals and ecological consequences. Plant Cell Environ. 40:2530–2543.
Ballaré, C, R Sánchez, A Scopel, J Casal, CM Ghersa. 1987. Early detection of neighbour plants by phytochrome per-ception of spectral changes in reflected sunlight. Plant Cell Environ. 10:551–557.
Ballaré, C, A Scopel, R Sánchez. 1990. Far-red radiation reflected from adjacent leaves: an early signal of competition in plant canopies. Science. 247(4940):329–332. doi:10.1126/ science.247.4940.329.
Ballaré, C, A Scopel, R Sánchez. 1991. Photocontrol of stem elongation in plant neighbourhoods: effects of photon flu-ence rate under natural conditions of radiation. Plant Cell Environ. 14(1):57–65. doi:10.1111/j.1365-3040.1991. tb01371.x.
Beldade, P, ARA Mateus, RA Keller. 2011. Evolution and molecular mechanisms of adaptive developmental plasticity. Mol Ecol. 20(7):1347–1363. doi:10.1111/ j.1365-294X.2011.05016.x.
Bell, D, L Galloway. 2007. Plasticity to neighbour shade: fitness consequences and allometry. Funct Ecol. 21 (6):1146–1153. doi:10.1111/j.1365-2435.2007.01327.x. Botto, JF, H Smith. 2002. Differential genetic variation in
adaptive strategies to a common environmental signal in Arabidopsis accessions: phytochrome-mediated shade avoidance. Plant Cell Environ. 25:53–63.
Charmantier, A, RH McCleery, LR Cole, C Perrins, LE Kruuk, BC Sheldon. 2008. Adaptive phenotypic plasticity in response to climate change in a wild bird population. Science. 320(5877):800–803. doi:10.1126/science.1157174. Core Team, R (2016). R: A language and environment for
statistical computing.
Cremer, F, A Havelange, H Saedler, P Huijser. 1998. Environmental control of flowering time in Antirrhinum
majus. Physiol Plant. 104(3):345–350. doi:10.1034/j.1399- 3054.1998.1040308.x.
Dong, M. 1995. Morphological responses to local light con-ditions in clonal herbs from contrasting habitats, and their modification due to physiological integration. Oecologia. 101(3):282–288. doi:10.1007/BF00328813. Donohue, K, D Messiqua, E Hammond Pyle, S Heschel,
J Schmitt. 2000. Evidence of adaptive divergence in plasticity: density- and site-dependent selection on shade-avoidance responses in impatiens capensis. Evolution. 54(6):1956–1968. doi:10.1111/j.0014-3820.2000.tb01240.x.
Donohue, K, J Schmitt. 1999. The genetic architecture of plasticity to density in Impatiens capensis. Evolution. 53 (5):1377–1386. doi:10.1111/j.1558-5646.1999.tb05402.x. Evans, J, H Poorter. 2001. Photosynthetic acclimation of
plants to growth irradiance: the relative importance of specific leaf area and nitrogen partitioning in maximizing carbon gain. Plant Cell Environ. 24:755–767. doi:10.1046/ j.1365-3040.2001.00724.x.
Falconer, D, T Mackay. 1996. Introduction to quantitative genetics. Ed. 4, Pearson Prenctice Hall. Harlow, Essex, UK. p. 464.
Franklin, K. 2008. Shade avoidance. New Phytol. 179:930– 944. doi:10.1111/j.1469-8137.2008.02507.x.
Franklin, K. 2016. Photomorphogenesis: plants feel blue in the shade. Curr Biol. 26:R1275–R1276.
Gavrilets, S, S Scheiner. 1993. The genetics of phenotypic plasticity. V. Evolution of reaction norm shape. J Evol Biol. 6:31–48. doi:10.1046/j.1420-9101.1993.6010031.x.
Hadfield, J (2016). MCMCglmm: MCMC generalised linear mixed models.
Huber, H, NC Kane, MS Heschel, EJ von Wettberg, J Banta, AM Leuck, J Schmitt. 2004. Frequency and microenviron-mental pattern of selection on plastic shade-avoidance traits in a natural population of Impatiens capensis. Am Nat. 163:548–563.
Humphrey, PT, AD Gloss, J Frazier, AC Nelson–Dittrich, S Faries, NK Whiteman. 2018. Heritable plant phenotypes track light and herbivory levels at fine spatial scales. Oecologia. 187:427–445. doi:10.1007/s00442-018-4116-4. Khattak, A, S Pearson. 2005. Light quality and temperature
effects on Antirrhinum growth and development. J Zheji ang Univ Sci B. 6:119. doi:10.1631/jzus.2005.B0119. Khimoun, A, M Burrus, C Andalo, Z-L Liu, C Vicédo-
Cazettes, C Thébaud, B PUJOL. 2011. Locally asymmetric introgressions between subspecies suggest circular range expansion at the Antirrhinum majus global scale. J Evol Biol. 24:1433–1441. doi:10.1111/j.1420-9101.2011.02276.x. Khimoun, A, J Cornuault, M Burrus, B Pujol, C Thebaud,
C Andalo. 2013. Ecology predicts parapatric distributions in two closely related Antirrhinum majus subspecies. Evol Ecol. 27:51–64. doi:10.1007/s10682-012-9574-2.
Lewandowska, M, P Jarvis. 1977. Changes in chlorophyll and carotenoid content, specific leaf area and dry weight fraction in Sitka spruce, in response to shading and season. New Phytol. 79:247–256.
Liu, Y, W Dawson, D Prati, E Haeuser, Y Feng, M van Kleunen. 2016. Does greater specific leaf area plasticity help plants to maintain a high performance when shaded? Ann Bot. 118:1329–1336. doi:10.1093/aob/mcw180. Lynch, M, B Walsh. 1998. Genetics and analysis of quantitative
traits. Sinauer. Sunderland, Massachussets, USA. p. 980. MacKenzie, DI, JD Nichols, J Andrew Royle, KH Pollock,
LL Bailey, JE Hines. 2018. Chapter 3 - Fundamental principals of statistical inference. In D I MacKenzie, J D Nichols, J A Royle, K H Pollock, L L Bailey, J E Hines, editors. Occupancy estimation and modeling. Second ed. Cambridge (MA): Academic Press; p. 71–111. Munir, M, M Jamil, J Baloch, K Khattak. 2004. Impact of
light intensity on flowering time and plant quality of
Antirrhinum majus L. cultivar Chimes White. J Zhejiang
Univ-Sci A. 5:400–405. doi:10.1631/jzus.2004.0400. Pierik, R, E Visser, H De Kroon, L Voesenek. 2003. Ethylene
is required in tobacco to successfully compete with prox-imate neighbours. Plant Cell Environ. 26:1229–1234. doi:10.1046/j.1365-3040.2003.01045.x.
Pierik, R, G Whitelam, L Voesenek, H De Kroon, E Visser.
2004. Canopy studies on ethylene-insensitive tobacco identify ethylene as a novel element in blue light and plant–plant signalling. Plant J. 38:310–319. doi:10.1111/ j.1365-313X.2004.02044.x.
Pigliucci, M. 2005. Evolution of phenotypic plasticity: where are we going now? Trends Ecol Evol. 20:481–486. doi:10.1016/j. tree.2005.06.001.
Pigliucci, M, J Whitton, CD Schlichting. 1995. Reaction norms of Arabidopsis. I. Plasticity of characters and cor-relations across water, nutrient and light gradients. J Evol Biol. 8:421–438. doi:10.1046/j.1420-9101.1995.8040421.x. Pujol, B, J Archambeau, A Bontemps, M Lascoste, S Marin,
A Meunier. 2017. Mountain landscape connectivity and subspecies appurtenance shape genetic differentiation in natural plant populations of the snapdragon (Antirrhinum majus L.). Bot Lett. 164:111–119.
doi:10.1080/23818107. 2017.1310056.
Pujol, B, S Blanchet, A Charmantier, E Danchin, B Facon, P Marrot, F Roux, I Scotti, C Teplitsky, CE Thomson, et al.
2018. The missing response to selection in the wild. Trends Ecol Evol. 33:337–346. doi:10.1016/j.tree.2018.02.007. Pujol, B, J-P Galaud. 2013. A practical guide to quantifying the
effect of genes underlying adaptation in a mixed genomics and evolutionary ecology approach. Bot Lett. 160:197–204. Pujol, B, G Mühlen, N Garwood, Y Horoszowski, E Douzery,
D McKey. 2005. Evolution under domestication: contrasting functional morphology of seedlings in domesticated cassava and its closest wild relatives. New Phytol. 166:305–318. doi:10.1111/j.1469-8137.2004.01295.x.
Scheiner, S. 1993. Genetics and evolution of phenotypic plasticity. Annu Rev Ecol Syst. 24:35–68. doi:10.1146/ annurev.es.24.110193.000343.
Scheiner, SM. 2013. The genetics of phenotypic plasticity. XII. Temporal and spatial heterogeneity. Ecol Evol. 3:4596–4609. doi:10.1002/ece3.792.
Scheiner, SM, RF Lyman. 1989. The genetics of phenotypic plasticity I. Heritability. J Evol Biol. 2:95–107. doi:10.1046/ j.1420-9101.1989.2020095.x.
Schmitt, J, S Dudley, M Pigliucci. 1999. Manipulative approaches to testing adaptive plasticity: phytochrome- mediated shade-avoidance responses in plants. Am Nat. 154: S43–S54. doi:10.1086/303282.
Schmitt, J, A McCormac, H Smith. 1995. A test of the adaptive plasticity hypothesis using transgenic and mutant plants disabled in phytochrome-mediated elon-gation responses to neighbors. Am Nat. 146:937–953. doi:10.1086/285832.
Schmitt, J, J Stinchcombe, S Heschel, H Huber. 2003. The adaptive evolution of plasticity: phytochrome-mediated shade avoidance responses. Integr Comp Biol. 43:459– 469. doi:10.1093/icb/43.3.459.
Schmitt, J, R Wulff. 1993. Light spectral quality, phyto-chrome and plant competition. Trends Ecol Evol. 8:47–51. doi:10.1016/0169-5347(93)90157-K.
Schwarz-Sommer, Z, B Davies, A Hudson. 2003. An ever-lasting pioneer: the story of Antirrhinum research. Nat Rev Genet. 4:655–664. doi:10.1038/nrg1127.
Skalova, H, F Krahulec. 1992. The response of three Festuca
rubra clones to changes in light quality and plant density.
Funct Ecol. 6:282–290. doi:10.2307/2389518.
Smith, H. 1982. Light quality, photoperception, and plant strategy. Annu Rev Plant Physiol. 33:481–518. doi:10.11 46/annurev.pp.33.060182.002405.
Smith, H, G Whitelam. 1997. The shade avoidance syn-drome: multiple responses mediated by multiple phyto chromes. Plant Cell Environ. 20:840–844. doi:10.1046/ j.1365-3040.1997.d01-104.x.
Van Hinsberg, A. 1997. Morphological variation in Plantago
lanceolata L.: effects of light quality and growth regulators
on sun and shade populations. J Evol Biol. 10:687–701. doi:10.1007/s000360050049.
van Kleunen, M, M Fischer. 2001. Adaptive evolution of plastic foraging responses in a clonal plant. Ecology. 82:3309–3319. doi:10.1890/0012-9658(2001)082[3309:AE
OPFR]2.0.CO;2.
van Kleunen, M, M Fischer. 2005. Constraints on the evolu-tion of adaptive phenotypic plasticity in plants. New Phytol. 166:49–60. doi:10.1111/j.1469-8137.2004.01296.x. van Kleunen, M, D Schlaepfer, M Glaettli, M Fischer. 2011.
response to shading differ between invasive and non invasive plant species in their native range? J Biogeogr. 38:1294–1304. doi:10.1111/j.1365-2699.2011.
02495.x.
Via, S, R Lande. 1985. Genotype-environment interac-tion and the evoluinterac-tion of phenotypic plasticity. Evolution. 39:505–522. doi:10.1111/j.1558-5646.1985. tb00391.x.